CONTINUED FINANCIAL ILLITERACY OF FINANCIAL GURUS EQUALS FINANCIAL DISCRIMINATION OF SENIOR SINGLES (Part 2 of 2)

CONTINUED FINANCIAL ILLITERACY OF FINANCIAL GURUS EQUALS FINANCIAL DISCRIMINATION OF SENIOR SINGLES (Part 2 of 2)

(These thoughts are purely the blunt, no nonsense personal opinions of the author and are not intended to provide personal or financial advice.)

This blog post is a comment on the Broadbent Institute Report on the economic circumstances of Canadian seniors.  The Broadbent Institute is a left-leaning social democratic think tank founded by Ed Broadbent who was a past leader of the New Democratic Party .  It describes itself as an independent, non-partisan organization championing progressive change through the promotion of democracy, equality, and sustainability and the training of a new generation of leaders.  Its mission is to “Support, develop, and promote social democratic principles for the 21st century”, “Propose new solutions for a more equal society”, and “Equip a new generation of progressive campaigners & thinkers with the tools they need to build a social democratic society through training and education”.

This post addresses excerpts from the report first (Part 1), and then is followed by comments on the report (Part 2).

COMMENTS ON  REPORT – PART 2 OF 2

In February, 2016 the Broadbent Institute in Canada and Richard Shillington of Tristat Resources published the report:  “An Analysis of the Economic Circumstances of Canadian Seniors”.       (analysis_of_the_economic_circumstances_of_canadian_seniors)

The report information is mainly directed towards poverty of seniors without an employer pension plan (roughly 47 per cent) and therefore, many of these seniors have wholly inadequate retirement savings.

(It should be noted in the report that single seniors does not refer to marital status, but the fact that they live alone.  Therefore, single seniors includes ‘ever’-never married, no kids-singles, divorced/separated, and widowed seniors living alone).

Review of the report reveals some points that are very disconcerting.

  • The true facts of what it costs singles to live is under-reported.  Married/coupled persons and, indeed, the author of the Broadbent report do not seem to realize that the widowed (married/coupled persons whose spouses are deceased) are a part of the singles population.  It is a well known fact that it costs singles approximately 70 per cent of what it costs married/coupled persons to live as a single unit.  This fact is never addressed in the report. (Using LIM 11.1 percent of seniors live in poverty–719,000 seniors:  419,000 singles and 250,000 living in an economic family.  The poverty is astonishingly high at almost 30 per cent for senior singles without employer pension plans).  (Widowed persons and the extra benefits they get are discussed later in this post).
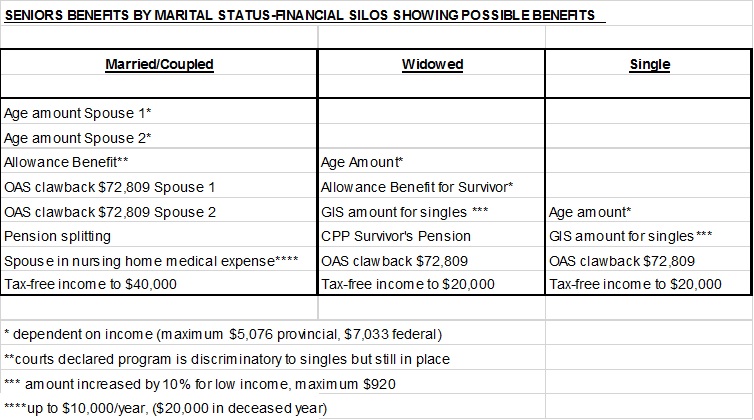
  • All the extra benefits that have been given to married/coupled persons are never addressed.  Governments continue to create financial silos where more and more benefits are given to married/coupled persons even though they are able to live with less because of economies of scale, but not to singles resulting in financial inequality.  (Following table was updated on March 8, 2016 with additional information).

financial silos6

  • It is ludicrous that this report does not treat home equity as a retirement asset.  Those who have to rent are at a much greater financial disadvantage than those who own their own home.  Quote from report : “ …..Many of those who argue that there is no looming pension crisis have included home equity as a liquid asset.  This analysis has not treated home equity as a retirement asset because the replacement rate analysis has as its objective an income that allows one to enjoy a lifestyle comparable to that which existed pre-retirement.  We do not include home equity here because we accept that the pre-retirement lifestyle for many middle- and moderate-income Canadians include continued homeownership”, (Page 19).

According to Statistics Canada 2011 articles “Living Arrangements of Seniors” and “Homeownership and Shelter Costs in Canada”:      (statcan.gc.ca) and (statcan)

  • The average household total income for couple-family households was about twice that of non-family households (which were primarily one-person households) and lone-parent households ($101,000 per year versus $43,000 per year and $55,000 per year respectively).  Thus, while lone-parent households and non-family households had a lower cost than couple-family households, the lower household total income results in a higher proportion exceeding the affordability threshold”.
  • Approximately 69 per cent of Canadians own their own home.  About  four out of five (82.4%) married/coupled people own their own home, while less than half (48.5%) of non-family households (singles) own their dwellings.  Just over half (55.6%) of lone-parent households own their dwelling.  (It stands to reason that more senior married/coupled and widowed persons will own their own homes, while senior singles–‘ever’ single and early divorced)–are more likely to have to rent placing them in greater income inequality and a lower standard of living and quality of life). Regardless of housing tenure, the proportion of non-family households and lone-parent households that paid 30% or more of total income towards shelter costs was about twice the proportion of the couple-family households.
  • Quote “approximately 56.4 per cent of the senior population (5 million total seniors in 2011) live as part of a couple and about 24.6 per cent of the senior population live alone (excludes those living with someone else, in senior citizen facilities and collective housing).

Singles are constantly told to ‘go live with someone’ when they have difficulties paying for housing; meanwhile married/coupled and widowed persons may be living in their big houses (enjoying the same lifestyle they had before pre-retirement) and seeking help with paying their taxes while refusing to move to a less expensive dwelling.  (senior-singles-pay-more-part-3-of-4)

  • It is ludicrous for this report to state that seventy per cent  income replacement should be a benchmark in the formulas.  Seventy per cent income replacement is entirely different for those who own their own home versus those who rent.  It is selfish to think that the rich and married/coupled persons should be able to live same lifestyle post-retirement as pre-retirement when singles and early divorced generally will have a poorer lifestyle throughout their entire lives.

An example is the Financial Post financial evaluation “Bright Future Despite Big Debt, Small Income” published in Calgary Herald on February 20, 2016 where Ontario young couple’s after tax income is $4,800 per month and their food budget is $800 and entertainment $160 per month for two people.  Just these two items are 20 per cent of their budget.  Either they live in an area with very high food costs or they are living the high life for one of the necessities of life in Maslow’s Hierarchy of need.  Seventy per cent replacement at retirement would give this couple an unreasonably high style of life for food in comparison to singles.   Reader letter mentioned above in ‘senior-singles-pay-more-part 3-of-4’ link suggested singles should be able to live on just $200 per month for food.

  • It is ludicrous to suggest that persons without employer pension plans cannot save, especially those with incomes over $100,000.

Quote from report:  “For those with incomes in $50,000-$100,000 range, the median value (savings) is only $21,000” (Page 3).

If those with pension plans have forced saving, it it is ridiculous to say that those without pension plans are not able to save.  For example, a $75,000 before-tax income may result in $600-$700 per month being deducted from pay cheque (employer deductions are excluded in this discussion).   It is also ridiculous to say that in this First World country persons with $100,000 plus incomes cannot save.  One of the principles of good finances is to save 10 per cent.  Whole report promotes greed of looking for more benefits and not planning for the future if there is no plan for saving during working years.

  • Reporting false information on marital status is a crime.  Quote from report states:  “Table 7 represents the results of increasing the single and married GIS amounts by the same percentage.  One should keep in mind that there is an incentive for seniors to appear as singles to governments even if they are living as a couple.  This is because the GIS for senior couples is less than twice the amount for singles.  An increase in the GIS for singles only (with no increase for couples) would increase this so-called ‘tax on marriage’ and associated incentives.  This would encourage couples to hide their cohabitation from the authorities for financial reasons”, (Page 21).

GIS for senior couples should, repeat, should be less than twice the amount for singles.  Singles (particularly ‘ever’ and early divorced singles including the author of this blog) have worked very hard to have financial formulas include singles at 70 per cent of married/coupled persons living as a single unit.  The GIS for senior singles is more than married/coupled persons because it costs more for singles (including widowed persons)  to live than it does for married/coupled persons living as a single unit.  Why can’t married/coupled persons understand this?  When married/widowed persons become widowed their living costs will go up.

The statement  “An increase in the GIS for singles only (with no increase for couples) would increase this so-called ‘tax on marriage’ and associated incentives. This would encourage couples to hide their cohabitation from the authorities for financial reasons” is absurd and selfish.  Tax on marriage, why can’t married/coupled persons realize all the extra benefits they receive as outlined in table above???  When is ‘enough’ ever going to be ‘enough’ for them???

The notation (# 28) at the bottom of page 21 states:  “While legislation treats those cohabiting the same regardless of their marital status, it is easier to deceive the government if you are not married”.  This statement is false and backwards.  If it is anyone being deceitful, it is the married/coupled persons.  Can someone explain why it would be easier to deceive the government if you are not married (‘ever’ single)?  The issue with false reporting lies with those who are married/coupled, divorced or separated.  They are trying to ‘milk’ the system by falsely reporting their marital status even though the Canada Revenue income tax rules clearly define the parameters of marital status.

False reporting is a crime.  It would be very easy to track deceit by following income tax declaration of marital status and address of residence over several years.  Deceit of married/coupled persons would incrementally increase the monetary value they would receive from the deceit as it costs them less to live as a couple than it does single persons.

It seems married/coupled persons want it all even if they have to lie about it.  So what will they do when their spouse goes to a nursing home or is deceased?  In order to collect the benefits they are entitled to as one spouse living at home and the the other in a nursing home and widowers, they will need to lie again and change their marital status from single to married/coupled or widowed when filing their income taxes.

‘Ever’ singles (never married, no kids) throughout their entire working lives pay same amount of taxes as each individual (with equal income to the single person) reporting income tax in a married/coupled relationship and have supported/subsidized families who use mom/baby hospital care, EI benefits for maternal/paternal leaves, etc.  They are never recognized for their tax support and for using less resources than families.  Since singles have paid supportive taxes throughout their entire working lives, they deserve to live with the same financial dignity and respect as seniors and as married/coupled persons.  As seniors, ‘ever’ singles deserve to have their own space and their own bathroom and not be forced to cohabitate with other persons.

The real financial lives of singles is revealed when a simple math calculation is used for the targeted tax relief where a single senior can now earn $20,360 and a senior couple $40,720 before paying federal income tax.  This so called tax relief for seniors allows federal tax relief for singles equal to $1,697 per month and for senior couples $3,393 per month.  The tax relief for senior singles hardly covers a rent or mortgage payment of $1,200 and $250 for food per month (Maslow’s Hierarchy of Need), but amply covers this amount for a senior couple.  For a couple $1200 for rent or mortgage and $500 for food leaves $1693 (or 50% of $40,000) for other necessities and maybe even a nice little vacation all tax free.

CONCLUSION

It is incredible how in just a few paragraphs a think-tank can undo the hard work that singles have been trying to achieve in seeking financial equality.  Think-tanks and financial gurus continue to practice financial illiteracy on what it truly costs singles to live.   (false-assumptions-four-ways-seniors-singles-lose outand (financial-gurus-financially-illiterate-about-singles-finances)

Even though the final statement of the report states:  The GIS is the most effective federal mechanism in the short term for reducing the poverty rate and the impact of poverty on seniors, and it can be targeted at senior singles who need it the most”, there are many shortcomings to this report.

This report is encouraging irresponsible financial behavior.  It is morally, ethically and socially reprehensible in a First world country to say that one cannot save with an income over $100,000 and to promote financial inequality and discrimination of singles.

The Broadbent Institute is supposed to be about ‘a more equal society’, so where is the financial equality?

SOLUTIONS

In order to ensure financial equality between singles (including widowers) and married/coupled persons the following measures need to be taken:

    • change financial formulas so that senior singles receive 70 per cent of whatever is given to married/coupled senior persons as it costs more for singles to live than it does married/coupled persons because of economies of scale
    • financial formulas should be revised to include all senior persons regardless of marital status in one financial formula.  To eliminate financial silos that benefit married/coupled persons most, delete benefits already given to married/coupled persons such as pension splitting (benefits the rich most) so that there is a level financial playing field for all regardless of marital status. (It is understood that it is expensive to raise children and  benefits given for children should last for first twenty years of the life of the child.  However, beyond the twenty years of the children, any other benefits given to married/coupled persons should be deleted or should also be given equally to singles at rate of 70 per cent)
    • create a side-by-side list of all possible benefits under categories of married/coupled, widowed and single and analyze the total value of benefits in each category (see table above).  Financial formulas should be created equally for all categories, not just the married/coupled and widowed.
    • delete allowance benefit that has been ruled to be discriminatory by the courts
    • education, education and more education on financial literacy for singles.  Think tanks, financial gurus and married/coupled people need to educate themselves on what it really costs singles to live.

(These thoughts are purely the blunt, no nonsense personal opinions of the author and are not intended to provide personal or financial advice.)


CONTINUED FINANCIAL ILLITERACY OF FINANCIAL GURUS EQUALS FINANCIAL DISCRIMINATION OF SENIOR SINGLES (Part 1 of 2)

CONTINUED FINANCIAL ILLITERACY OF FINANCIAL GURUS EQUALS FINANCIAL DISCRIMINATION OF SENIOR SINGLES (Part 1 of 2)

(This blog is of a general nature about financial discrimination of individuals/singles.  It is not intended to provide personal or financial advice.)

In February, 2016 the Broadbent Institute and Richard Shillington of Tristat Resources in Canada has published the report:  “An Analysis of the Economic Circumstances of Canadian Seniors” http://goo.gl/HNP2Ee

The report information is mainly directed towards poverty of seniors without an employer pension plan (roughly 47 per cent) and therefore, many of these seniors have wholly inadequate retirement savings.

Using LIM (low-income measure) senior poverty has increased from a low of 3.9 per cent in 1995 to 11.1 per, or one in nine, in 2013.  The poverty rates for single seniors, particularly women (at nearly 30 per cent), are very high and need to be addressed, (Page 2).   (LICO, or Low Income Cut Off, is not used here because it is not a true income poverty indicator as it was set in 1992 where families spend 20 per cent more of their income on necessities than was typical and has not been reset since.)

(It should be noted in the report that single seniors does not refer to marital status, but the fact that they live alone.  Therefore, single seniors includes ‘ever’ singles, divorced/separated, and widowed seniors living alone.)

In Canada, the income-tested OAS (Old Age Security) and GIS (Guaranteed Income Supplement) benefits together provide a regular minimum economic guarantee and are used to supplement regular income (from CPP-Canadian Pension Plan, private pensions and private savings) to lift seniors out of poverty.

Some of  the key findings of the report include:

  • The proportion of the population receiving the GIS is higher for senior singles than couples, and higher for single women (between 44 per cent and 48 per cent) than for single men (between 31 percent and 37 per cent), (Page 3).
  • ‘Roughly half of those aged 55-64 with no employer pension  benefits….. have savings that represent less than one year’s worth of the resources they need to supplement OAS/GIS and CPP.  Fewer than 20 per cent have enough savings to support the supplemented resources required for at least five years, (Page 3)…..For those with incomes in $50,000-$100,000 range, the median value is only $21,000…..(Page 3).
  • The overall median value of retirement assets of those aged 55-64 with no accrued pension benefits is just over $3,000.  For those with annual incomes in the range of $25,000-$50,000. the median value is just over $250.  For those with incomes in the $50,000-$100,000 range, the median value is only $21,000, (Page 3).
  • Only a small minority (roughly 15-20 per cent) of middle-income Canadians retiring without an employee pension plan have saved….enough for retirement.  The vast majority of those families with annual incomes of $50,000 and more will be hard pressed to save enough in their remaining period to retirement (less than 10 years)…..(Page 3).
  • The seniors’ poverty gap is $2.5 billion in aggregate annually, due to the 719,000 poor seniors (469,000 singles and 250,000 living in an economic family.)  A 10 per cent benefit increase in the GIS to address this gap would cost $1,628 million, and would reduce the number of poor seniors (married/coupled and singles) by about 149,000, (Page 3).
  • In the recent election, the Federal Liberal Party promised to increase the GIS by 10 per cent for single seniors.  (NOTE:  this does not include coupled seniors).  A simulation using Statistics Canada’s Social Policy Simulation Database and Model (SPSD/M) suggests this would cost $700 million and remove about 85,000 single seniors from the poverty roles, with a reduction in the singles poverty rate of 5.7 percentage points, (Page 3).  (Singles poverty rate of 5.7 percentage points from approximately  28 per cent for senior single females, and 24 per cent for senior single males, that’s all???)

Factors Affecting Seniors Poverty

As of July 2015, the income-tested maximum annual OAS/GIS benefits for seniors aged 65 and over with no other source of income were $15,970 for singles and $25,746 for couples…..The GIS is phased out as income rises and is reduced to zero above an annual income (thus calculated) of $17,136 for single seniors and $22,068 for senior couples, (Page 9).

Reliance on the GIS is greater for single seniors than it is for senior couples across all age ranges…..  For example, 41 per cent of all seniors over 85 receive the GIS, while only 30 per cent of seniors aged 66-69 receive it. (Page 9).

Pension Coverage (Page 12)

The difference in incomes at retirement between those seniors with and without a pension income is stark…..The difference is not all due simply to the presence or absence of an employer pension plan.  Those who have had an employer pension plan are more likely to have had better paying jobs, and jobs with health and other benefits.  As well, it is possible for those who seek out jobs with a pension are more likely to be those motivated to save for retirement.  But certainly, participating in a pension offers advantages that make it easier to have a higher income at retirement, (Page 12).

For couples, those without pension income have significantly lower total incomes ($52,000) to compared to those with pension income ($68,000).  This is despite their higher income from earnings ($19,100 for those without pension income, compared to $7,200 for those with pension income).

For individuals, the story is very different:  They are more likely than couples to be over the age of 70, and much less likely to be employed.  For single women, the median incomes are $18,000 for those without a pension and $30,400 for those with a pension  For men, the medians are $19,000 and $37,300, respectively.  These gaps are significant, (Page 12).

LIM (Low Income Measure) is used in this report and is based on after-tax income to assess poverty of seniors.  This measure shows what proportion of persons have after-tax incomes that are less than half of the median or midpoint to comparable families.

Two criterion to assess adequacy of income at retirement are:  1)  poverty criterion, and 2) replacement rate concept, (Page 13).

Generally,  the median incomes for those without pension income is just over half for those with pension income, (Page 13).

The report goes on “to suggest that a significant proportion of those without an employer pension plan will not have saved adequately for retirement and will suffer a major loss of income”.

Retirement savings without employer pension (Page 14-16)

Report states that from Survey of Financial Security for 2012 about half of families (what is the definition of family here?) aged 55-64 without an employer pension have virtually no savings; indeed 78 per of them have less than $100,000 in retirement savings.  Lower-income families eligible for OAS/GIS along with CPP may still have little or no drop in income, however inadequate that income might be, (Page 14).

….Vast majority of these families with annual incomes of $50,000 and more will be hard pressed to save enough in their remaining period of retirement (less than 10 years) to avoid a significant fall in income.  It appears that at least 25 per cent have very limited retirement assets despite incomes of $50,000-$200,000, (Page 15).

The report does state that ‘analysis presented in tables is somewhat simplistic because it ignores the impact of public benefits (OAS/GIS and CPP) on the amount that future seniors need to save.  It is also accepted that many seniors need less income in retirement in order to maintain the standard of living that they had pre-retirement.  The actual replacement rate required-the ratio of post-retirement to pre-retirement income-varies by how it is measured (pre- or post-tax).  Seventy per cent is commonly used, although it varies by individual circumstances and tastes; higher values are more appropriate for the poor, and lower values are more appropriate for the very wealthy’, (Page 15-16).

Retirement savings compared to income (Page 16-20)

Tables show widespread under-saving using calculations of 70 per cent pre-tax replacement rate…

Some do not need to save for retirement to get 70 per cent replacement because their income is quite low (below $21,429 for singles and $35,714 for couples).  These individuals and couples were deleted from table 5…..,(Page 16).

To illustrate, a family with an income of $100,000 (pre-tax) is assumed to need $70,000 (70 per cent of $100,000), and will get roughly $25,000 in public support.  Thus, they will need to make up $45,000 per year from their private savings, (Page 16).

Even those with an income of more than $100,000 are unlikely to have more than five years worth of the required supplemental income in their retirement savings; only 21 per cent meet this criterion……(Page 17).

In summary, regardless of income, few of these families have enough savings to supplement their income for even one year.  Only 15-20 per cent have enough for five or more years. (Page 17).

…..Many of those who argue that there is no looming pension crisis have included home equity as a liquid asset.  This analysis has not treated home equity as a retirement asset because the replacement rate analysis has as its objective an income that allows one to enjoy a lifestyle comparable to that which existed pre-retirement.  We do not include home equity here because we accept that the pre-retirement lifestyle for many middle- and moderate-income Canadians include continued homeownership, (Page 19).

One Option:  Reducing seniors poverty with GIS

The report then makes suggestions for decreasing poverty rate. One option is reducing seniors poverty with short term changes to GIS.  One of the paragraphs is as follows:

Table 6 presents estimates of the poverty gap using Statistics Canada’s SPSD/M microsimulation model. The poverty gap is the total amount of money that would be needed to raise the incomes of all poor seniors to the LIM poverty line-ignoring any  behavioral impacts of the transfer programs used to achieve that goal…..The poverty gap is $2.5 billion in aggregate, which is due to the 719,000 seniors:  419,000 singles and 250,000 living in an economic family.  The average gap is $2,400 for singles and $5,500 for seniors in a family, (Page 20-21).

Table 7 represents the results of increasing the single and married GIS amounts by the same percentage.  One should keep in mind that there is an incentive for seniors to appear as singles to governments even if they are living as a couple.  This is because the GIS for senior couples is less than twice the amount for singles.  An increase in the GIS for singles only (with no increase for couples) would increase this so-called ‘tax on marriage’ and associated incentives.  This would encourage couples to hide their cohabitation from the authorities for financial reasons, (Page 21).

The notation (# 28) at the bottom of page 21 states:  While legislation treats those cohabiting the same regardless of their marital status, it is easier to deceive the government if you are not married.  (Really???  How is this so when single status needs to reported on income tax returns; lying about marital status is a felony?).

Taking one example (from Table 7) of the tabulated results, a 10.0 increase is estimated to increase the cost of the GIS by $1,628 million to yield a poverty rate of 10.5 per cent and to reduce the number of poor seniors by about 149,000, (Page 22).

The (Federal) Liberal Party’s proposal in the recent election was to increase the GIS by 10 per cent for single seniors.  The SPSD/M simulation suggests that this would cost $700 million and remove about 85,000 single seniors from poverty, with a reduction in the singles poverty rate of 5.7 percentage points.  While a reasonable starting point, clearly much more can be done to reduce the poverty rate, (Page 22).

Conclusions

Poverty rates for seniors have been trending up since 1995.  Rates remain unacceptably high for single seniors-particularly women-and the worsening trends in pension coverage point to further increases in poverty in the future.  The GIS is the most effective federal mechanism in the short term for reducing the poverty rate and the impact of poverty on seniors, and it can be targeted at senior singles who need it the most, (Page 23).

(This blog is of a general nature about financial discrimination of individuals/singles.  It is not intended to provide personal or financial advice.)


PROFILING OF SINGLE MEN-CULTURAL AND MARITAL DISCRIMINATION OF SINGLES

PROFILING OF SINGLE MEN-CULTURAL AND MARITAL DISCRIMINATION OF SINGLES

(These thoughts are purely the blunt, no nonsense personal opinions of the author and are not intended to provide personal or financial advice.)

On January 18, 2016, an opinion letter entitled “Culture Clash” was published in the Calgary Herald by a couple profiling single migrant men.  The letter has been reproduced here in its entirety. The response by the author of this blog published in the Calgary Herald has also been reproduced here.  The name of the opinion letter was changed by the Calgary Herald editors to “Nothing wrong with being single”.

Today on the program “The Social” (a Canadian social commentary program) a statement was made in one of their commentaries that single white men are the cause of many terrorist activities, for example, Timothy McVeigh.

This post is not of a financial nature, but is entered here over deep concern for negative profiling of singles.

CALGARY HERALD EDITORIAL LETTER “CULTURE CLASH”

Re:  Angela Merkel says Germany has lost control of the refugee crisis and public anger over Cologne sex attacks

My wife is from Germany and keeps in contact with family there who live in a small village near Stuttgart, where the German government has housed some 60 single migrant men, all under the age of 40, in an unused grocery store.

These folks have daughters in their early 20s who no longer feel safe going out at night or using the trains due to these men’s constant leering and gesturing.  Recently, a teenage niece was confronted in her grandmother’s backyard by three men who tried to prevent her from getting back into the house, first asking for money and then: ‘ Do you like Hitler?’ Not up on current events, apparently.

So far, our federal government deserves full credit for allowing in only vetted immigrant families, but my concern is with their overly ambitious quotas and deadlines, they may open it to single men as Germany and other European countries did.  In that case, it’s not inconceivable that what happened in Cologne and other cities in Cologne and other cities on New Year’s Eve could one day come to a big public event here, as soon as July perhaps.  (Authored by couple from Calgary).

(Response to above letter) PROFILING OF SINGLE MEN-NOTHING WRONG WITH BEING SINGLE

January 18, 2016 letter “Culture Clash” by the (name not published here) is disturbing. This letter is profiling all migrant single men as disgusting human beings.

How did these single men get this way except to be taught this by men including fathers and a society that has no respect for human dignity?

To change behavior, how about talking to them about respect, first of all, for themselves and then respect for women?

Singles are fed up with being negatively profiled and told they are worth less than married people.  They are told they are spendthrifts, don’t behave properly, but when they marry they suddenly become decent human beings.

Marital status and being male does not define social intelligence.  Rather what you have been taught and your moral values define who you are.  Married people, parents and fathers should look to themselves when they profile single men as being societal failures.

CONCLUSION

So, in just two instances single migrant men and single white men have been negatively profiled as being bad people.  This is a pretty big number of the total single men population. Such profiling also has a negative effect on the psychological well-being of singles.

When are married/coupled persons and families (including race) going to ‘get over themselves’ in thinking that they are the only ones who are able to have cultural and social intelligence?

Marital status does not mean married/coupled persons and families are going to behave any better than singles.  Look to examples where Canadian immigrant parents have killed their daughters because of clashing religious ideals, the atrocities committed by men in India, both single and married, against multiple raping of females, and family members killing each other or committing crimes against each other.

To  stop negative profiling and financial discrimination of singles, marital status needs to be eliminated in the equal treatment of all human beings regardless of race and sex.

This blog is of a general nature about financial discrimination of individuals/singles.  It is not intended to provide personal or financial advice.

FAMILY: INCLUSIONARY OR EXCLUSIONARY TERM AND FINANCIAL DISCRIMINATION

FAMILY:  INCLUSIONARY OR EXCLUSIONARY TERM AND FINANCIAL DISCRIMINATION

(These thoughts are purely the blunt, no nonsense personal opinions of the author and are not intended to provide personal or financial advice.)

Today, February 15, is designated Family Day in Canada and was originally created to give people time to spend with their families, but also provides a day off between New Year’s Day and Good Friday as they are approximately three months apart.

The word ‘family’  can have many different meanings.  One definition is “a fundamental social group in society typically consisting of one or two parents and their children.” While this definition is a traditional definition, there are other family units excluded by this definition, such as couples without children or other variations on the family unit. Another definition is “two or more people who share goals and values, have long-term commitments to one another and reside usually in the same dwelling.”  In addition to a more universal family definition, there are many who consider a group of friends to be family, and adults who consider pets also to be members of the family unit.

The Statistics Canada definition of ‘family’ indicates there must be two persons legally living together to be defined as a family.  When census information is collated, the population is called:  “Census families and persons not in census families”.  Singles are included in the “persons not in census family” category.

For Canada Revenue Agency income tax purposes, singles are persons who have never married or whose marriage has been legally annulled.  (Those who  live with a common-law partner are not included in this category).

The word ‘family’ can be inclusionary or exclusionary depending on the closeness (or distance) of the relationship of the persons in the family unit.

It is interesting to note that present political discussions both in Canada and the USA talk about the financial decline of the ‘middle class family”.  Singles and low income are left out the discussion.  Many benefits have been given to the married/coupled persons and family units with children, but singles are generally left out of the benefits or receive less in benefits.

An example of financial discrimination in Canada is the targeted tax relief for seniors where senior singles pay no tax on $20,000 and married/coupled seniors pay no tax on $40,000.  For single seniors this amounts to only $1,700 per month, but for married/coupled seniors this amounts to approximately $3,400 per month.  Living costs are inadequately covered for singles, but are more adequately covered for married/coupled seniors.  It is a well known fact that singles require approximately 70% of living costs for married/coupled persons living together as a family unit.

The mentality of government, decision makers, businesses and families in this country is to serve only the rich and middle class families while generally ignoring singles, low income and no income individuals and families.   Families will often talk about how important the family unit is for them in regards to maintaining close ties to friends and families.  They talk about about how their ‘hearts are eternally and inexplicably changed’ when bearing their children, but same hearts appear to become ‘hearts of stone’ when these same children become adult singles, low income or no income persons and families.  These disadvantaged persons are tossed out or are less important in financial  formulas and decision-making processes.

CONCLUSION

The definition of family as to whether it is inclusionary or exclusionary is in ‘the eye of the beholder’ and depends on which ‘side of the fence’ is beholder is on.   An exclusionary example is the one given above on targeted tax relief.  The financial ‘family’ by devaluing singles and low income takes on a ‘Dr. Jekyll and Mr. Hyde’ persona, or also could be said to take on an ‘about-face’ persona or doing the exact opposite where the greed of business and personal gain takes on more importance than treasured family values.

Financial fairness of singles, low income and disadvantaged would be better served if they were financially treated as equal family members instead of being financially categorized as ‘worth less’ or ‘worthless’ to the rich and married/coupled persons in financial formulas. This would give more truth to why Family Day is celebrated on this day of February 15.

This blog is of a general nature about financial discrimination of individuals/singles.  It is not intended to provide personal or financial advice.


COMPANY PERKS BENEFIT FAMILIES MORE THAN SINGLES CAUSING FINANCIAL UNFAIRNESS

SOME COMPANY PERKS BENEFIT FAMILIES MORE THAN SINGLES (SINGLES ARE SUBSIDIZING THESE PROGRAMS)

(These thoughts are purely the blunt, no nonsense personal opinions of the author and are not intended to provide personal or financial advice.)

The Province of Alberta has once again released its Top 70 Employers for 2016.

In addition to the usual maternity, paternity leaves, day-care etc., perks that benefit families more than singles include the following:

  • Academic scholarship program for children of employees who are interested in pursuing post-secondary education, up to $1,000 per child. (This is in addition to federal and provincial education benefit programs).
  • Helps newcomers gain Canadian work experience with short-term internships, offered in partnership with Immigrant Services and Centre for Newcomers. (While it is recognized that this is a good thing for immigrants, this program should be offered equally to Canadians.  Immigrant families are favoured over single immigrants in relocation programs to Canada).
  • Compassionate top-up payments for employees who are called upon to care for a loved one. (The problem with this is often the definition of “loved one”.  It is often very inclusive to only close members of the family).
  • Parent employees with college-bound kids have access to an academic scholarship program, as well as summer, co-op and internship employment programs. (This program is again very inclusive to parent employees).
  • Academic scholarship program to encourage children of employees to pursue post-secondary studies (up to $3,000 per child). (While this employer does offer first perk of long-term development of its employees through tuition subsidies for courses taken at outside institutions (up to $5,000), parent employees get second perk for their children on top of  third perk of federal and provincial education benefit programs for their children).
  • Offers parents-to-be a generous subsidy for in-vitro fertilization (IVF) treatments up to $5,000.

Almost all employers offer some form of compassionate/bereavement programs (and this is a good thing).  However, these are often restricted to  close family members and in-laws.  Families often fail to recognize that they have double benefits as these programs compensate both sides of the family.  Singles tend to use less of these benefits, and therefore, it could be said that they are subsidizing families in this regard.  Singles through their taxes also support the mother/baby hospital care, maternal/paternal leaves and EI (employment insurance) programs for parents.

This blog is of a general nature about financial discrimination of individuals/singles.  It is not intended to provide personal or financial advice.

FINANCIAL POWER FOR MARRIED/COUPLED, BUT FINANCIAL DISCRIMINATION FOR SINGLES AND LOW INCOME

FINANCIAL POWER FOR MARRIED/COUPLED, BUT  FINANCIAL DISCRIMINATION FOR SINGLES AND LOW INCOME

These thoughts are purely the blunt, no nonsense personal opinions of the author and are not intended to provide personal or financial advice.

Featured post “Six Reasons why Married/Coupled Persons able to AchIeve More Wealth than Singles” unequivocally shows why married/coupled persons are able to achieve wealth from marital benefits to compound interest, economies of scale and getting two inheritances.

Do governments and decision makers truly understand the financial power that has been given to married/coupled persons?  It seems not.  There is a feeling that benefits continue to be given to married/coupled persons in a silo fashion without analysis of the full impact of these benefits and how much they cost to the coffers of the country.  Many married/coupled persons cannot see past themselves to understand what they have been given.  Many singles also do not understand this power.

Some reasons why singles do not marry are disabilities, history of severe abuse at the hands of parents or other people, not wanting to pass on genetic abnormalities and these are courageous decisions.  For others, some just plain don’t want to get married or it just never happened and for many this does not make them unhappy.  What does make them unhappy is being excluded from financial formulas.

All citizens deserve to be included in financial formulas without discrimination and regardless of marital status.

This blog is of a general nature about financial discrimination of individuals/singles.  It is not intended to provide personal or financial advice.