CANADIAN SINGLES FACE TERRIBLE FINANCIAL FUTURE UNDER CONSERVATIVE AND LIBERAL PERSONAL FINANCIAL SYSTEMS


(These thoughts are purely the blunt, no nonsense personal opinions of the author about financial fairness and discrimination and are not intended to provide personal or financial advice – financialfairnessforsingles.ca).

For this discussion singles include millennials not yet married age 18 to 34, singles never married no children age 35 to 65, and early in life divorced persons with no children.  Early in life divorced persons are unable to accumulate the same wealth as married persons who have two incomes and benefits times two over many years.

First and foremost, governments, society and married people have no concept about how difficult it is for ‘singles’ to live decent respectful financial lives.  Canadian financial system has been setup to give benefits compounded on benefits to the wealthy and the married but leave ‘singles’ out of financial formulas and exclude them from the family definition.

SINGLES DO NOT BENEFIT FROM THEIR INCOMES IN THE SAME WAY AS THE MARRIED AND THE WEALTHY

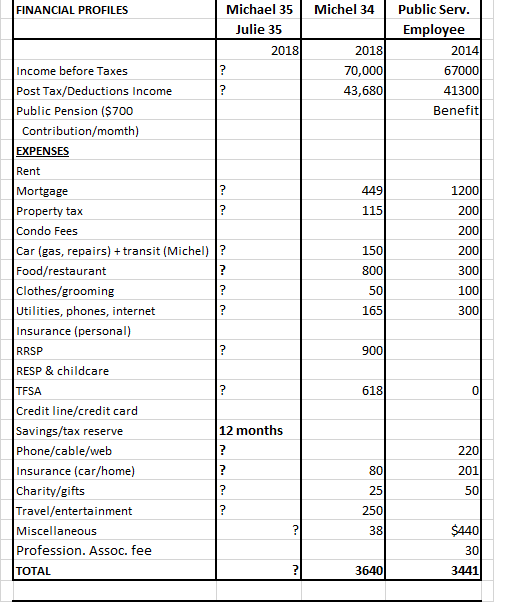
Singles don’t get to income split, pension split, etc. so they are forced to pay more taxes.   It is impossible for singles to save for retirement on a present day $50,000 income plus they are forced to live on a very frugal bare bones living wage income.  A single person with a 2019 $50,000 Alberta gross income ($25/hr. and 2,000 worked hours) and $11,000 tax, CPP and EI deductions results in a net income of $39,000 ($19.50/hr.).  This bare bones living wage that does not allow for savings, vacations or entertainment.   It is impossible to maximize $9,000 RRSP and $6,000 TFSA contributions (35% of $39,000 with tax reductions for RRSP) even though many believe $50,000 is a good income for unattached individuals and single parents.  As seniors these singles will likely be living only on CPP and OAS benefits.   

Singles are only able to achieve full contributions to RRSP and TFSA with $80,000 income but only can do so while living on a bare bones living wage of $39,000, 18% RRSP of $14,400 and $6,000 TFSA contribution with RRSP tax savings of $4,400 or extra income of $366 per month.

This is completely unrealistic since both OECD and Canadian median income statistics show median incomes for unattached individuals is considerably lower than $80,000 and indeed even $50,000.  The OECD calculator (oecd) shows that the median income for Canadian one person households is between $32,621 and $43,495 and income for one person households begins at $86,990 for the top 10%.   Canadian median income by households in 2015 (vanierinstitute) shows the total median household income in Canada was approximately $70,300 before taxes ($61,300 after taxes), and $34,200 before taxes (just under $30,900 after taxes) for individuals.  The Canadian Market Basket Measure (MBM) or OECD equivalence scales (OECDEquivalenceScales) show that it costs more for singles to live than two person households – if singles have a value of 1.0, it is only 1.4 for two person households, not 2.0.

There are many other ways in which singles are forced by government, society and families to contribute to family financial formulas without being able to benefit themselves from these contributions.

SINGLES DO NOT RECEIVE SAME LEVEL OF BENEFITS AS MARRIED/WEALTHY

From the time a married or coupled with children family unit begins at marriage until death of one of the spouses, it is possible they will receive shower, wedding and baby gifts (there is no such thing as ‘singles showers’), maternity/paternity leaves, child benefits, TFSA benefits times two, RRSP benefits times two, RESP grants, reduced taxes, pension-splitting, no OAS clawback, Involuntary Separation payments and possible survivor pension benefits.  There also are probably a great number of years where they never pay full taxes while increasing wealth and many can retire early before the age of 65.  Singles are not able to achieve these same level of benefits and tax relief.

Married people fail to realize that they get two inheritances (it is quite funny watching married people struggle with this fact until you tell them one heritance comes from the wife’s side and the second from the husband’s side)  Singles get one inheritance.

EI CONTRIBUTIONS AND BENEFITS

Government, families and society fail to recognize or even realize that singles often contribute to EI without ever using these benefits in their employment lifetime.  Instead contributions (estimated $35,000 at $800 to $900 EI contributions over forty years – investment potential not included) are forfeited to be used by other persons particularly for maternity/paternity benefits.  Singles are forced to help pay for maternity/paternity benefits for not only one generation, but possibly two generations.  Question:  when do EI maternity/paternity benefit payouts outpace the contributions of two working parents, especially when they retire early at age 55 and not contribute their full share to EI?

CPP CONTRIBUTIONS AND BENEFITS

The CPP death benefit is maxed at $2,500, is not indexed and not increased for many years.  After forty years of employment with average $2,500 annual CPP contributions will total $100,000.  If a single person dies one day after the age of 65 the deceased single person’s estate will only receive $2,500 death benefit which doesn’t even cover funeral costs.  Total of $100,000 contribution is forfeited to be used by the survivors of married or coupled households.

And now Liberal Prime Minister Trudeau wants to increase surviving spousal CPP benefits by 25% while singles will not receive equivalent increase???  Conservative Party’s Motion 110 proposes investigation to ensure parents with early infant deaths do not suffer undue financial or emotional hardship due to government programming design, particularly from Employment Insurance Parental Benefits.  Both Conservatives and Liberals continue to implement financial death formulas that benefit only families and the married.

SINGLES AND EMPLOYERS PENALIZED FOR OVERCONTRIBUTIONS OF EI  AND CPP

When singles attempt to increase their financial worth by working multiple jobs, they will not be able to contribute to EI and CPP beyond the individual maximum limits.  Meanwhile, married persons with both spouses working can contribute to maximum limits time two.  This means singles will never be able to achieve the same EI and CPP benefits afforded to married households but Market Basket Measure shows it costs them more to live than two person households.

The irony of singles having to receive a rebate of EI and CPP contributions is that the rebate is paid to the employee, not the employer.  In other words, the employer will have also  made an overcontribution, but is not able to collect a rebate on the overcontribution.  Their overpayment will be forfeited and added to benefits pot.

(Caveat:  Uncertain how recent changes to CPP contributions will affect overpayment levels).

ENTREPRENEURS WHO HAVE A MARITAL STATUS OF ‘SINGLE’ WILL PROBABLY PAY MORE INCOME TAX SINCE THEY CAN’T “INCOME SPRINKLE”, etc.

Personal responsibility espoused by Conservatives equals gaslighting in its purest form.

Re small business earners, excerpt from a newspaper article states that “Small business owners, including incorporated professionals such as doctors, lawyers, accountants and others, will likely face a higher tax bill in the years ahead as a result of (Liberal) Finance Minister announcement this week targeting several common, and until now, perfectly legal, tax strategies used in conjunction with private corporations.

The strategies under attack can be categorized into three main areas: income sprinkling, earning passive investment income in a corporation and converting a corporation’s ordinary income into tax-preferred capital gains.

Among these changes, it’s the first one — income sprinkling — which is perhaps deemed the most offensive of the three and the one that will likely have the broadest financial impact on small business owners and incorporated professionals”.

What this newspaper article fails to recognize is that information is only talking about families.  It fails to show how entrepreneurs who are single cannot use these benefits since they can only be personally responsible only to themselves since they have no children or spouses.  They, therefore, will likely pay more taxes and will possibly be more likely to have business failures as entrepreneurs.

“Income sprinkling” describes how some families use private corporations to sprinkle income among family members. In a typical example, dividends that would have been received by the primary owner/manager of the private corporation, say, mom or dad, would instead be paid to the spouse, partner or kids of the primary shareholder, who are often in lower tax brackets than the primary owner/manager and thus the family’s total tax bill would be reduced.  When it comes to income sprinkling of salary income, this rule is meant to prevent a parent who owns a corporation from paying his spouse or child an annual salary when he or she doesn’t actually perform any work or provide services to the business.   In the past transferring dividends to children under the age of 18 was eliminated (this blog writer’s opinion – this was the right and fair thing to do as children would benefit from double dipping while using multiple combined medical and educational services and receiving concomitant tax free Canada Child Benefits). 

Conservatives in the recent election promised to reverse some of these entrepreneurship rules changed by the Liberals, however, the election resulted in Liberals winning a minority government (example of Conservatives doing the wrong thing that would increase financial discrimination of single marital status entrepreneurs).

Since singles never married no children, millennials not yet married and early in life divorced persons without children in their financial circles can only be basically financially responsible to themselves, ‘Income sprinkling’, distribute dividends to family members, etc. is of no benefit to these entrepreneurs so they will pay more taxes.  Why would singles and millennials not yet married even try entrepreneurship when they know from the get go that they will not have the same advantage, Alberta or otherwise, to married and wealthy entrepreneurs with spouses and children?  Singles are forced to be more personally responsible since they do not receive equivalent benefits in financial formulas.   Tax fairness needs to be ensured regardless of marital status and how income is earned.

Income, taxes and benefits, etc. define who employees are and how loyal they are to their employers.  Without change to where there is fairness and equality for single employees in pay, pension, taxes, benefits, etc. the trend where young single employees have no sense of loyalty to their employers (revolving door of quitting and applying for job after job after job) will only continue and get worse. This also applies to senior single employees who have tried lobbying and using righteous anger regarding financial discrimination and singlism in the workplace and in society but get nowhere because their employers, politicians and society choose to blatantly not listen.

THE FINANCIAL HYPOCRISY, GREED, SELFISHNESS OF THE MARRIED AND THE WEALTHY AS SHOWN IN FINANCIAL ANALYSTS EVALUATIONS WHERE IMPACT ON NEVER MARRIED SINGLES IS COMPLETELY ABSENT AND INVISIBLE

Financial Post article “Couple with a big age gap forced to contemplate impact of an early death” (alberta-couple-with-big-age-gap-worry)

Article states wife (Lori) could lose $17,000 a year in income if her husband dies first since there is a ten year age difference.  They have financial assets of $1,741,500 including a $650,000 house.  At age 65 couple is estimated to have income of $6,000 per month ($72,000 annual net income after splits of eligible income, no tax on TFSA distributions and reduced income tax to average 15 per cent.  How does single person ever only pay 15%?

 If husband dies early, the financial planner estimates that Lori could lose $17,008 in gross annual income per year and potentially pay a higher tax on her remaining income.  The reduced income could result from 1) loss of husband’s OAS, 2) part of two of his work pensions, 3) most of his CPP benefits and 4) the inability to split income, but 5) still have $650,000 house.  All of these are not available to singles throughout their entire senior lives.

It is distressing to never married singles that this couple should be worried when it appears they are spending over $15,000 annually on travel and entertainment.  If they are so worried that Lori’s standard of living will be reduced, why can’t they take personal responsibility,  work till age 65, reduce some of their excessive spending and save that money to be used if husband dies early?  How about paying fair share of taxes and maintaining lower standard of living that singles never married have to live every day of their lives?

It is also distressing to never married singles that Liberal Prime Minister Trudeau and other politicians are obsessing about benefits for surviving spouses.  He is talking about increasing CPP benefits for surviving spouses by 25%.  Twenty five percent!  Will never married singles get same equivalent amount?  Who is paying for this increase?  Lori retired at age 55 so why should she receive an extra 25% when she hasn’t contributed to the full amount of CPP?

Michael Lewis, author of “The Undoing Project” book, describes how a Nobel Prize-winning theory of the mind altered our perception of reality.   Two Israeli psychologists, Daniel Kahneman and Amos Tversky’s work created the field of behavioral economics which revolutionized thinking of how the human mind works when forced to make judgements in uncertain situations.  An example is outcomes of surgery where there might be a 5% chance of death versus 95% chance of surviving the surgery.  When patients are presented with 95% chance of survival rather than 5% death rate, they are more likely to go through with the surgery.  The same judgement should apply to the hypocrisy of the wealthy.

For upper class and wealthy, please don’t ‘cry me a river’.  Wealthy need to look at what they have left after taxation instead of what is being taken from them in taxation.

EFFECTS OF LOW INCOME ON BRAIN AND MENTAL HEALTH ESPECIALLY THE YOUNG

Government, politicians and society need to educate themselves on the effects that low income has on the brain by reducing connective white matter and increasing worse structural integrity as outlined in first article listed below.  The second article outlines how Alberta university students are facing food insecurity and even homelessness.  One of the reasons in particular for increased university costs is the massive increase in textbook costs   – American data suggest textbook costs increased by more than 800 per cent between 1978 and 2013.

The information from the two articles has been submitted as an attachment.  

1) “UNPREDICTABLE EMPLOYMENT MAY BE BAD FOR BRAIN HEALTH” by Lisa Rapaport, October10, 2019 (unpredictable-income) and 2) “FINANCIAL AND MENTAL HEALTH PRESSURES MOUNT ON STUDENTS” by Joel Schlesinger (unable to attach link).

THE CANADIAN PERSONAL FINANCIAL SYSTEM IS FRAGMENTED AND BROKEN

There is a complete fragmentation of the Canadian personal financial system where politicians through upmanship throw money at certain populations, include the wealthy but exclude certain populations such as singles, the only reason being to get votes.

Conservatives continue to talk ad nauseum about socialism of the left, but are ‘brain dead’ to the selective privileged socialism they practise every day for the wealthy.

The wealthy often aren’t employed for as many years as singles, yet they believe they should be able to get full CPP benefits and even extend these to surviving spouses (Trudeau to increase by 25% for surviving spouses) some of whom haven’t even been employed for 75% of the employment lifetime of singles.

The Canadian financial  system for personal finances is broken.  Continuation of overspending for the wealthy and the married will lad to bankruptcy of the personal financial system.

Solutions:  

Instead of having a Minister for the Middle Class, a non partisan committee with participation by all political parties is needed to annually review financial formulas and  personal benefits based on application of MBM/OECD.  (See oecd for handy calculator by country and the number of persons in households).  More ‘zooming out’ and balance between ‘right and left brain thinking’ (see below for explanation) needs to replace the present narrow focus of only financially privileging the wealthy and the married.

To counterbalance the net income, tax avoidance and tax free selective socialistic privileging for the married and the wealthy, it is crucial that lifetime federal and provincial income tax be immediately and exclusively completely eliminated for singles and single parents with incomes under $50,000 so they also can save for their retirements.  (This change would be the equivalent of about $7,000 and would not exceed the many privileges such as CCB benefits and tax loopholes for the wealthy and the married).

Instead of singles subsidizing the married, the married should have to purchase mandatory term life insurance just like vehicle and house insurance.

The ‘financial pimping’ of singles and millennials not yet married by the married and the wealthy has to stop.   Singles are tired of being financially pimped by their own wealthy parents, wealthy married siblings and wealthy married fellow employees.  When singles are forced further into poverty to the point of homelessness, what will you do then?

The financial imbalance between the rich and the poor, singles and married only leads to populist anger, male millennial suicides (Alberta) and despair.  There already has been created a genocide of indigenous peoples.  We don’t need a financial genocide of singles.

TWO THEORIES ON WHY FINANCIAL SYSTEMS ARE FAILING AND INDEED MAY RESULT IN THE DEMISE OF CIVILIZATION

Governments, politicians, and society continue to manipulate the financial system so that selective socialistic benefits are given unequally to the married and the wealthy.  Some believe continued progression of this inequality will lead to the degradation of civilization and, indeed, may even the demise of civilization.  Indeed, even higher educational institutions of learning have migrated to teaching that is focused more to the narrowness of ‘left brain thinking’ (enormous capacity for denial and capacity to ignore things and keep them shut out – students specialize in narrow fields.  Theories, and categories become important) and ‘zooming in’ (think smaller by focusing on vulnerability of poverty, not the wage of inequality) without ‘zooming out’ (getting people to care about problems first by ‘zooming in’ on a vivid person and then getting them to care by ‘zooming out’ from persons to systems”.  To fight inequality means to change systems as a group of people).

‘Personal responsibility’ smacks of individualism instead of betterment of society as a whole.

Further explanation of the two theories outline why this may be happening.

The first is by Iain McGilchist and “The Divided Brain from the Documentary Channel.  He states that imbalance towards left brain hemisphere thinking gives narrow, sharply focused attention to detail without understanding the larger context resulting in bureaucracy, excessive concentration on money and wealth, bad politics and warped economic systems.  Reduced role of right brain hemisphere thinking results in decreased ability to relate to things and understand them as a whole.  

The second theory by Anand Giriharadas, “Winners Take All” says the same thing but in a different way.  He refers to ‘zooming in’ and ‘zooming out’.  ‘Zooming in’ causes us to think smaller by focusing on vulnerability of poverty, not the wage of inequality.  ‘Zooming out’ causes us to care by ‘zooming out’ from persons to systems”.   To fight inequality means to change systems as a group of people.

Both theories show how higher learning institutions have been affected by a narrowed focus on learning which then translates into a narrowed kind of thinking by politicians and society when these graduates get out into the real world.

Synopsis of Iain McGilchist and “The Divided Brain from the Documentary Channel

The two hemispheres of the brain have styles or takes on the world, they see things differently, have different values, prioritize differently.

The left hemisphere’s goal is to enable us to manipulate things (like a calculator) whereas the role of the right brain is to relate to things and understand them as a whole ( like a tree branches growing out of the ground and sprouting out and upwards).  Two ways of thinking about things are both needed but at the same time are compatible.

McGilchrist claims that the left hemisphere is gradually colonizing our experiences of the world with potentially disastrous implications.  The way of thinking which is too mechanistic has taken over our way of thinking.  We behave like we have right hemisphere damage.  Do we pay a price for being too left brain centered?   It has made us enormously powerful; it has enabled us to become wealthy, but it also means we have lost the means to understand the world.

Could the problems of the modern world be influenced by an imbalance of the human brain?  And what does that imply about our future?  For McGilchrist the problem is not only bad politics or a warped economic system.  The problem is inside our modern brain.

Experiments showed that each hemisphere had a different way of looking at the world.  The left talks and is analytical and the right pulls stuff together.  Each hemisphere engages in everything, so each hemisphere, right and left, is involved in reason and language and emotion but in crucially different ways.  

Why does the brain have two centres of consciousness, each capable of maintaining consciousness on its own but in a different way?  The left brain will recognize parts i.e. (picture of a human cut in pieces) of a body to recognize a human , but the right brain requires the correct position of  the human body to recognize it as a human.  Both hemispheres are doing an excellent job and both hemispheres can contribute and both hemispheres can decide human or non human but both do it with different cognitive strategies.

He observed that the left hemisphere gives narrow, sharply focused attention to detail without understanding the larger context.  It sees objects in relation to their usefulness.  It is in charge of the right hand which has the power to manipulate things such as tools and to technology. As it can’t make human connections it does not not understand relationships, humor and tone of voice.  Things and people are not unique and individual but groups that it can organize, sort and file in a system of rules and linear connections.  On its own it has no sense of the whole.  Even people are seen as body parts.  The world of the left hemisphere is lifeless.  It shatters the world into an assortment of bits without meaning.

The right hemisphere by contrast sees the broad view of the world.  It is the master of the brain.  It perceives an interconnected world.  It understands relationships, body language, facial expressions and implicit meaning.  The right hemisphere engages with life, understands movement, story and metaphor.  It perceives how humanity fits into the whole of creation.  

The divided brain give us two types of attention, two ways of engaging with the world.  It has made us the most powerful species on earth.

But the left hemisphere’s narrow kind of attention reminded McGilchrist of something else.  Our world!  I began thinking how everything in public life has become more regulated, more rule bound, more explicit.  For the last hundred years the way of thinking which is reduct to mechanistic has taken us over.  It has enabled us to manipulate the world, to use resources, to become wealthy, but it has also meant we have lost means to feel satisfaction and fulfillment through our place in the world. We have created outside ourselves a world which looks very much like the interior world of the left hemisphere, rigid lines of things that were rolled out mechanically and were non unique.  Bureaucracy is in its element.  It depends on qualities which the left hemisphere provides:  organizability, animity, standardization, uniformity, abstraction and so on.  Systems designed to maximize utility with loss of cohesion socially because the left hemisphere needs control.  There is a lack of trust and a lot of paranoia with the use of CCTVs and monitoring of all kinds .

The left hemisphere is the quick and dirty one because it has to make action.  It likes things to be black and white.  People think that, well, the left hemisphere surely is the basis for intelligence, it is the one that does all that analysis.  But that is not the case.  There is a lot of evidence that that the really critical one from the point of view of intelligence is the right hemisphere.   Another important difference, a very important difference, is that between fixity and flow.  Things in the left hemisphere are fixed whereas in the right hemisphere flow is what it sees and understands.  Now that is very profound.  That actually changes the whole nature of what life is.  Nothing is just isolated.  It is always part of a flow.  Things can only be understood in context when you take them out.  They change when you grab them and put them in the spotlight of attention and make them explicit.

“One of the primary features of the left hemisphere is that you find this enormous capacity for denial, this capacity to ignore things and keep them shut out. The left hemisphere that wants to slice and dice and execute quickly.  To make quick decisions the left hemisphere relies on abstractions, categories and models of the world.

Economics detached from a robust resourceful picture of human well-being is very dangerous and that is what we are living with in large parts of the globe.  We seem to take it as absolutely self evident that unlimited material growth is the best thing that we could hope for.  The biggest single task is thinking again through that question of growth and why it is so obvious and target why some kinds of growth are privileged over the notion of growth of real human well-being and understanding.

The school curriculum moves away from the right hemisphere resulting in an imbalance between right and left hemisphere learning.  In universities the learning becomes even more left hemisphere dominant.  The student specialize in narrow fields.  Theories, and categories become important. 

McGilchrist: (Consequences- riots, protests) What certainly would not happen is that things would be calm because the left hemisphere is emotional and one emotion that lateralizes particularly clearly is anger and it lateralizes to the left.  Discourse in public will become marked by anger and aggression.  But, according to the right hemisphere everything is connected to everything else.  It is about the relationships.

McGilchrist notes three periods where there was a flourishing of civilization in the west – Athens in the sixth century, the beginning of the empire in Rome, and early Renaissance.  The civilization in these three cases showed a marvellous balance in the right hemisphere and left hemisphere ways of thinking, but in each case it ended up with a movement further and further towards the left hemisphere after which the civilization collapsed.

What McGilchrist’s work can do is point us in the direction toward a solution.  If we can get better at seeing things more holistically, more specifically, more in context, if we can get better at systematically resisting attempts to turn things into algorithms, to always measure, to always quantify, if we can get better and more robust at doing that, the world will begin to steer towards a better place.

We need a better balance between the right and left hemisphere.  We need to look at the world in a different way.

Einstein said the rational mind is the faithful servant, but the intuitive mind is a priceless gift.  We live in a world that honors the servant that has forgotten the gift.  We do need a paradigm shift, it is not about little things here and there.  It is about the whole way we can see what a human being is, what the world is and what our relationship to it is.

Synopsis of “Winners Take All” by Anand Giriharadas (italics are blog author’s comments)

MarketWorld (capitalism) believes social change should be pursued through free market and voluntary actions without public life, law and reform of systems that people share in common.

MarketWorld “thought leader” thinkers (capitalists) promote so called ‘world-changing’ ideas with little risk to themselves.  Their ideas cause us to “zoom in” and think smaller by focusing on vulnerability of poverty, not the wage of inequality.   They don’t like “social justice” and “inequality” words, but rather use “poverty” and “fairness” while speaking of “opportunity”.

“Public intellectual” thinkers (conscious capitalists) counterbalance this thinking and change the trajectory of MarketWorld “by getting people to care about problems first by ‘zooming in’ on a vivid person and then getting them to care by ‘zooming out’ from persons to systems”.   To fight inequality means to change systems as a group of people.

“Thought leaders” have permeated higher learning institutions by purposefully changing the language in which public spheres think and act.  Young people are taught to see social problems in a “zoom in” fashion by confining questioning to what socially minded businesses they can start up like “buy one, give one”, but not inequality.

To counteract and provide balance to MarketWorld “our political institutions–laws, constitutions, regulations, taxes, shared infrastructure:  these million little pieces provide a counterbalance to help hold democratic capitalistic civilizations together.”

Blog author’s thoughts on this theory:  The one-sided financial hegemony of MarketWorlders has created the present day ‘graft and greed’ college financial scandal, FAA allowing Boeing to “self-inspect” and SNC Lavalin corruption.

One word comes to mind–brainwashing, or at the very least gaslighting.  MarketWorlders have done a very good job of gaslighting the political, financial and higher learning powers that be.

(This blog is of a general nature about financial discrimination of individuals/singles.  It is not intended to provide personal or financial advice).


TRUDEAU’S ‘MIDDLE CLASS TAX CUT’ BENEFITS MARRIED AND WEALTHY MOST

(These thoughts are purely the blunt, no nonsense personal opinions of the author about financial fairness and discrimination and are not intended to provide personal or financial advice – financialfairnessforsingles.ca).

Comment from blog author:  We have commented in past blog posts about the controversy surrounding the definition of ‘what is the middle class?’  

(WHO IS THE MIDDLE CLASS? AND FINANCIAL DISCRIMINATION OF SINGLES AND THE POOR)

This blog post shows that the Liberal Party has done nothing to resolve the financial struggles of the middle class.  If the Conservative Party had won the 2019 election their promises also would not have helped the middle class.  It is not difficult to understand why the anger of those in the bottom half contiues to increase when government and politicians continue to gaslight and lie about tax cuts that benefit the wealthy more than the poor and the married more than singles.  As outlined below critics of the proposal have said middle-to-high income earners will receive the highest sums of money from the measure and cutting taxes will put an increasing strain on federal finances already facing annual multi-billion dollar deficits.

The following post is divided into three parts:  1)  how Liberal ‘middle class tax cut’ will benefit married households more than single person households using OECD calculator.  2) excellent article by Andrew Coyne on “why the Liberal middle class tax cut is no tax cut at all” 3) details of the Liberal Middle Class Tax Cut (for additional information only).

1) OECD calculator shows how ‘middle class tax cut’ will benefit married more than single person households

OECD article states “Governments must act to help struggling middle class”

https://www.oecd.org/newsroom/governments-must-act-to-help-struggling-middle-class.htm

Across the OECD area, except for a few countries, middle incomes are barely higher today than they were ten years ago, increasing by just 0.3% per year, a third less than the average income of the richest 10%.

The link for this OECD article has an interesting application of OECD CALCULATOR (See where you belong by entering your details!  Which income class does your family income fit in?) where the reader can enter details of country, number of persons in household and net income amount after taxes and benefits.  (Caveat: Some might disagree with the OECD income ranges which are quite wide and high especially at the upper ranges of stated middle class incomes).

Explanations of the Calculator:

  • Lower-income class refers to households with income below 75% of the median national income
  • Middle-income class refers to households with income between 75% and 200% of the median national income
  • Upper-income class refers to households with income above 200% of the median national income

According to this OECD calculator in Canada 58% of the population is in the middle-income class, 32% are in the lower-income class and 10% are in the upper-income class. On average, across OECD countries, 61% are in the middle-income class, 30% are in the lower-income class and 9% are in the upper-income class.

Between mid-2000s and mid-2010s in Canada:

  • The share of the population in the middle-income class has decreased by -1.5 percentage points.
  • The upper-income class has increased by 0.7 percentage points.
  • The lower-income class has increased by 0.8 percentage points.

Example of single person household with $50,000 Alberta gross income or $39,000 after deductions

In the past we have shown that it is impossible for a single person household with a $50,000 gross income to save anything for retirement.  As stated a single person with a 2019 $50,000 Alberta gross income ($25/hr. and 2,000 worked hours) and $11,000 tax, CPP and EI deductions results in a net income of $39,000 ($19.50/hr.).    This is a bare bones living wage that does not allow for savings, vacations or entertainment. It is impossible to maximize $9,000 RRSP and $6,000 TFSA contributions (35% of $39,000 with tax reductions for RRSP) even though many believe $50,000 is a good income for unattached individuals and single parents.

When $39,000 net income is entered into the OECD calculator, it shows that the lower 32% of single person households have net incomes below $32,621, middle 58% have net income from $32,621 ($16 per hr.) to $86,990 ($43 per hr.) and upper 10% have income over $86,990.  The median income is $43,495.  The calculator further states:   In Canada, a 1-person household would need between $32,621 and $86,990 per year to be in the middle-income class.

Example of two person household with  Alberta gross income of $82,000 or $61,000 after deductions

(For this calculations we have used $61,000 median income for a two person household).

When $61,000 is entered into the OECD calculator, it shows that the lower 32% of a two person household have net incomes below $46,133, middle 58% have net income from $46,133 ($11 per hr. for two incomes dividided equally between two persons) to $123,022 ($31 per hr. for two incomes divided equally between two persons) and upper 10% have income over $123,022.  The median income is $61,511.  The calculator further states:   In Canada, a 2-person household would need between $46,133 and $123,022 per year to be in the middle-income class

ANALYSIS AND CONCLUSIONS

The Liberal plan states that for top income earners the increase in the basic personal amount would be gradually reduced for individuals with net incomes above $150,473 (or approx. $235,00 gross income) in 2020. Meanwhile, those with incomes over net $214,368 would continue to receive the existing basic personal amount, which is tied to inflation.

Liberal Gaslight #1:  The Liberal middle class tax cut goes beyond the middle class.  Review of online information including OECD and CRA shows that the middle class parameters do no come close to $150,473, yet those with net incomes under $150,473 will receive the full tax cut.

Liberal Gaslight #2: How many times can it be said that it costs more for single person households to live than two person households?(According to the OECD the median income for single person household is $43,495 and for two person households $61,511).  It costs more for singles to live than couples without children.  Using OECD equivalence scales or Canadian Market Basket Measure if a single person household has a value of 1.0, lone parent, one child or two adult household has a value of 1.4, one adult, two children 1.7 and two adult, two children 2.0.   The single person household will receive the tax cut benefits only for one basic personal amount, but two person households will receive double the basic personal amount benefits even with less income generated per person in the household.

When benefits are given equally to Canadians on an individual basis, the financial spread between single person households and two person households will become wider and wider with single person households being pushed further into poverty.  Single person households are damned tired of being pushed into financial poverty by their own governments, politicians and their own families who either do not understand or care about the financial ramifications for their single children.

2)“Liberals’ ‘middle class tax cut’ is not a tax cut at all” (EXCELLENT ARTICLE!)

Andrew Coyne, December 10, 2019, Source The Globe and Mail, https://spon.ca/liberals-middle-class-tax-cut-is-not-a-tax-cut-at-all/2019/12/11/

The new Minister of Middle Class Prosperity was unable, in her first week on the job, to define the middle class with much precision or syntax. It’s “where people feel that they can afford their way of life,” Mona Fortier told CBC Radio. “They have a quality of life, and they can have, you know, send their kids to play hockey or even have different activities.”

In fairness, if the minister cannot define the file for which she pretends to have responsibility, neither can the government in which she notionally serves. Four years and two elections after they first started droning on about it, the best guess as to what the Liberals mean by “middle class” is “most people,” or more particularly, “most voters.”

Consider the latest “middle class tax cut,” promised in the platform and announced this week – a tax cut that is not a tax cut, and that applies to people who are not remotely middle class. For that matter, the basic personal exemption, which would be increased from $12,298 today to $15,000 in 2023, is not an exemption, really. It’s a credit – money you get from the government, not money you earn that the government leaves alone.

Have a look at your tax form. It’s not even called an exemption: It’s called the basic personal amount. Nor do you get to deduct it from your income, like an exemption. If you could, your tax owing would be reduced by the amount of the deduction times the top rate of tax you would otherwise have to pay on that income. Instead, policy makers saw fit to turn it into a credit, redeemable only at the 15 per cent bottom rate of tax. Basically everyone, rich or poor, gets a flat $1,884 ($12,298 times 15 per cent).

In other words, it’s a spending program, by another name. And since it applies to nearly everyone, an expensive one. Just to enrich it will cost the government another $6-billion a year, when fully implemented. It might have cost more, had the Liberals not added a wrinkle: The increase in the credit is phased out, starting at $150,473 in income; at $214,368, it disappears altogether, allowing the Liberals to say they have excluded the “richest” – the fabled 1 per cent – from its benefits.

And so they have. They’ve just included everyone short of that: the near-rich, the pretty rich, the rich, even the filthy rich, relatively speaking. Those eligible may not think of themselves that way: Virtually everyone, according to the polls, defines themselves as “middle class,” and why not when there’s money in it? But to actually be middle class, you’d have to be earning somewhere around $35,000 – the median income, according to Statistics Canada. Even if you defined middle class as, improbably, the “middle” 80 per cent of the income distribution, you’d still be earning less than $96,000.

A policy that pays out to people making as much as $214,368 may be many things, but it is not a middle-class tax cut. If the richest are excluded, moreover, so are the poorest. The credit is “non-refundable,” meaning it applies against taxes owing. If you pay no taxes, you get no credit. And if you are below the existing BPA, you gain no benefit from raising it further.

What we are left with is a $6-billion handout to just about everybody except those who need it most. And all of it is borrowed. With the deficit already in excess of $20-billion and headed higher, the government is proposing to borrow another $6-billion annually, and give much of it to people in the top half of the social register.

It’s one thing to borrow for investment – for things that pay returns into the future, enough at least to cover the extra interest costs incurred. But this isn’t for investment: it’s for consumption. You don’t have to do anything productive to benefit from the Liberal “tax cut.” You get it just for being you.

Suppose instead the money had been used to cut marginal tax rates: the rate that applies to the next dollar earned. That really would be an investment – a permanent and much-needed improvement in incentives to work and invest, at a time when labour and especially capital are in short supply, relative to the demands of an aging population.

Of course, to get much bang for your buck, you’d have to cut the top rates, since it’s those in the upper brackets who have most of the wherewithal to invest. And it’s the top rates that have reached confiscatory levels: north of 50 per cent, federal and provincial combined, in much of Canada.

Unthinkable: Tax cuts for the rich! Maybe. But it sure beats handouts to the rich, doesn’t it?

3)Details of Trudeau’s middle tax cut

From:  https://ipolitics.ca/2019/12/09/liberals-move-to-enact-promised-tax-cut-for-middle-class/

Prime Minister Justin Trudeau has stated that the Liberal government will raise the basic personal income tax deduction to $15,000 for those earning under $147,000 — meaning would taxes would only be paid on income over that amount. Currently, the 2019 federal basic personal deduction is $12,069. The increase would be phased in, reaching $15,000 by 2023.  It is estimated this will save an individual just under $300 a year, while families would save $585.

For top income earners the increase in the basic personal amount would be gradually reduced for individuals with net incomes above $150,473 in 2020. Meanwhile, those with incomes over $214,368 would continue to receive the existing basic personal amount, which is tied to inflation.

Trudeau said the tax cut would lift 40,000 people out of poverty and encompass about 700,000 more Canadians.  It would cost $2.9 billion to start, increasing to $5.6 billion by 2023-2024.

Finance Minister Bill Morneau said the changes would mean 20 million Canadians will see a lower tax burden and 1.1 million more Canadians will pay no federal income tax at all and the average Canadian family would save close to $600 every year by the time it fully comes into effect.

Finance Canada projects the tax cut will leave federal coffers short $25 billion between now and 2024-25. By the time the changes are completed in 2023, the measure will cost more than $6 billion annually.

The independent parliamentary budget officer predicted the tax measures would cost nearly $24 billion in that timeframe. The analysis had assumed other Liberal proposals, such as an increase in the Canada Child Benefit, come into effect. It also did not consider changes to spouse or common law and dependent amounts.

Critics of the proposal have said middle-to-high income earners receive the highest sums of money from the measure and cutting taxes put an increasing strain on federal finances already facing annual multi-billion dollar deficits.

(This blog is of a general nature about financial discrimination of individuals/singles.  It is not intended to provide personal or financial advice).

BASIC OR LIVING WAGE INCOMES WITHOUT MBM WON’T SOLVE FINANCIAL DISCRIMINATION OF SINGLES

(These thoughts are purely the blunt, no nonsense personal opinions of the author about financial fairness and discrimination and are not intended to provide personal or financial advice – financialfairnessforsingles.ca).

There are several solutions that have been proposed to solve the issue of poverty and low income.  Increasing the minimum wage is one solution.  With AI and digital revolutions some proposals include living wage or basic wage as a partial solution to the possibility of maintaining level of job numbers as a result of these revolutions.

Living wage research has been helpful in determining what it costs to live in specific urban and rural areas.  However, a living wage is a bare bones wage with no possibility of saving for emergencies or retirement.  The living wage premise is based on adults working full time (one adult in one person adult family, one adult and one child,  two adults and no children or two adults and two children family unit).   However, if living wages are not based on OECD equivalence scales such as Canadian Market Basket Measure or MBM unattached persons and single parents are often the financial losers in these plans.  (If single person household has a value of 1.0, lone parent, one child or two adult household has a value of 1.4, one adult, two children 1.7 and two adult, two children 2.0.  It costs more for singles to live than couples without children).

“Andrew Yang on Universal Basic Income

(https://baseandsuperstructure.com/andrew-yang-ubi) Excerpts from this article describes the UBI plan and provides some rather interesting insights from right and left political perspectives.

‘The plan is relatively simple. The government pays all US citizens between the ages of 18 and 64 a UBI of $1,000 per month, or $12,000 per year. For citizens 65 and up, the existing Social Security system would be left in place.

Yang wants to pay for this system using four sources: a.) eliminating existing social spending (e.g., food stamps, disability, WIC, unemployment insurance, et al.), generating $500-600 billion worth of savings; b.) A value-added tax (VAT) that he estimates will generate $800 billion per year; c.) $500-600 billion in new tax revenue from UBI-generated economic growth; b.) $100-200 billion per year in savings from UBI-generated crime reduction and health savings.’

The article states that problems with the plan include: ‘UBI doesn’t pay people nearly enough, would eliminate social programs, encourage low wage and exploitative labor practices, and put more money into the hands of companies who prey on low income Americans.’  “A Leftist take on Universal Basic Income” (leftist-universal-basic-income-ubi) by same author says ‘Here’s what would happen if a UBI proposal got off the ground in the United States: it would get turned into the right-wing version. It wouldn’t apply to everyone, it wouldn’t pay enough to live, it would gut social programs, or possibly all three of these things.’  The author offers suggestions that better solutions are comprehensive health care, housing and food assistance and indexed minimum wage that is increased every year.

It seems that USA plans for social justice and equality of wages never seem to include equivalence scales like MBM outlined above so singles would benefit the least from the plan because it costs singles more to live than a two person household.

Alberta report on basic income

“An Alberta Guaranteed Income:  Issues and Options” (May 2019) by Wayne Simpson and Harvey Stevens, The School of Public Policy at the University of Calgary (https://journalhosting.ucalgary).  Excerpts from the report include:

(From Summary) – ‘For all the job booms and wealth that have benefitted Alberta over the decades, nothing yet has been able to drastically reduce, let alone eliminate poverty in the province.  The prospect of a guaranteed minimum income could help change that, and Alberta is particularly well positioned to roll one out and with relative ease and at a manageable cost.

An Alberta guaranteed basic income could be straightforwardly developed by revising the  existing provincial tax system to make tax credits that are currently non-refundable into  refundable tax credits, such that people earning below the minimum income-tax threshold will still be able to claim them as subsidies.  This can be done while avoiding significant new funding and relying solely on budgetary measures to improve the fairness of the tax system.

Converting just a few non-refundable tax credits into refundable ones can produce a  guaranteed annual income of over $6,000 for a single-adult family and over $9,000 for a  two-adult family, with no significant new funding required. This would improve supports for 37  per cent of Alberta families, with the largest gains properly concentrated among the poorest households, and would reduce the rate and depth of poverty by 25 per cent.

An even more powerful approach would be if Alberta were able to persuade the federal government to combine a similar program federally with the provincial guaranteed basic income, converting non-refundable credits into refundable ones and eliminating the federal GST credit.  A combined federal-provincial guaranteed annual income would increase dramatically to over $13,600 a year for a single-adult family and to over $19,000 a year for a two-adult family.  The disposal income of the poorest 20 per cent of Albertans would increase by more than 50 per cent under the combined plan, while the rate of poverty across all Albertans would be cut by a substantial 44 perr cent.  Among single parents and non-elderly and elderly couples, poverty would be eliminated completely.  And while two-parent families and non-elderly singles would continue to be in poverty, its rate declines significantly and its depth would be reduced by more than half.’

The report ‘offers two models:  one that includes selected non-refundable tax credits but excludes current Alberta refundable tax credits; and one that includes both selected non-refundable tax credits and the refundable credits’ (including Alberta Child Benefit and the Canada Child Benefit in the second model).

The report does talk about Low Income Cut-offs (LICO) and Market Basket Measure (MBM).  They state that LICO has been replaced as Canada’s official poverty measure by the MBM.  However, (page 3) certain versions of statistical reports did not allow them to calculate the MBM measure, so they adopted the traditional LICO measure of the incidence and depth of poverty in the report.

Opinion Letter on above report

In an opinion letter “A basic income that reduces poverty is doable” (alberta-could-afford-a-basic-income-that-reduces-poverty) by Franco Savoia and Jeff Loomis, Executive Directors of Vibrant Communities Calgary and Momentum, respectively, they state:

‘Alberta is a prosperous province, but our poverty rate has hovered around 10 per cent for decades, costing the government more than $2 billion each year….

In recent years, the guaranteed income supplement for seniors and Canada and Alberta child benefits have been credited with reducing poverty rates. Some have gone as far as to call these programs a basic income for seniors and children.

For many in the social services sector, a similar program for adults aged 18-65 is a logical next step…..

Despite this, basic income critics point to the prohibitive costs associated with implementing such a program, noting that governments just don’t have the money. However, new research from the University of Calgary’s School of Public Policy shows that Alberta could actually afford to do it. Supported by a research partnership with Calgary’s Social Policy Collaborative, economists Wayne Simpson and Harvey Stevens have come up with an Alberta basic income program that wouldn’t require the province to spend any extra money or increase taxes…..

….the Simpson and Stevens program is financed entirely through modest changes to tax policy. By turning five existing non-refundable tax credits into a single refundable credit, the authors suggest that the province could achieve a basic income that would increase the incomes of roughly 40 per cent of Albertans, reduce poverty by almost one-quarter and eliminate poverty for single parents.

But, as always, the devil is in the details.

A notable element of the proposal is the decision to keep in place the current income support system — a choice that some basic income advocates may not support. Many envision a basic income as a better — and simpler — alternative to existing income supports, which are complex and often needlessly bureaucratic.

Also concerning is the redistributive impact of the tax reform required to create the program, which would result in increased tax pressures for middle-income earners.

These shortcomings aside, the Simpson and Stevens proposal is proof that basic income is more than a pipe dream in Alberta. And though the proposal wouldn’t eliminate poverty completely — it would leave many non-elderly single Albertans below the poverty line — it would be a significant step forward in our efforts to make poverty a thing of the past. As the basic income conversation evolves, both in Alberta and across the country, the School of Public Policy report has contributed valuable insight. We’re excited to see where the discussion goes.’

CONCLUSION

Shocking statistics show that in one of the richest provinces (Alberta) there were in January 2014, 33,000 Alberta Income Support program (excluding AISH) recipients of all ages.  Alberta Income Support program in January, 2017, had 54,374 recipients and in January, 2018, 57,003 recipients.  Makeup of claimants in 2017 and 2018 include individuals 69%, lone-parent families 24%, couples with children 5%, and couples alone 3%.  Totals do not say how many are turned away and do not include those who on verge of poverty.

It is a sad fact that regardless of what financial manipulations are applied to minimum wage and living wage or basic wage models, singles or unattached persons always appear to come out as the financial losers.  Until Market Basket Measures, etc. are applied so that one person households benefit equally to other households, social injustice and income inequality will remain for single persons.  But then who gives a damn?

(This blog is of a general nature about financial discrimination of individuals/singles.  It is not intended to provide personal or financial advice).

POLITICAL PARTIES HAVE ‘CHICKENSHIT CLUB’ MEMBERSHIPS BECAUSE THEY TAKE THE EASY WAY OUT ON SOCIAL INJUSTICE AND INEQUALITY

POLITICAL PARTIES HAVE ‘CHICKENSHIT CLUB’ MEMBERSHIPS BECAUSE THEY TAKE THE EASY WAY OUT ON SOCIAL INJUSTICE AND INEQUALITY

(These thoughts are purely the blunt, no nonsense personal opinions of the author about financial fairness and discrimination and are not intended to provide personal or financial advice.)

(Blog author’s comment:  The topic of financial discrimination of singles and low income families has been addressed from many different angles in this blog.  This particular blog post shows how compounding of benefits on benefits such as Registered Retirement Savings Account (RRSP) combined with a tax free Canada Child Benefit (CCB) allows wealthy families with children who can afford to max out RRSPs to benefit the most from reduced taxes, increased income, and increased wealth.  It also shows how governments and politicians fail to right the biggest social injustices and financial inequalities by going after the easiest targets.

WHAT IS THE ‘CHICKENSHIT CLUB’

Jesse Eisinger in his book ‘The Chickenshit Club’  gives a blistering account of corporate greed and impunity, and the reckless, often anemic response from the Department of Justice.  He describes how James Comey, the 58th US Republican Attorney (appointed by Republican George W. Bush and fired by so called Republican Donald J. Trump) was giving a speech to lawyers of the criminal division.  These lawyers were some the nation’s elite. During his speech, Comey asked the question: “Who here has never had an acquittal or a hung jury? Please raise your hand.” This group thought of themselves as the best trial lawyers in the country.  Hands shot up. “I have a name for you guys,” Comey said. “You are members of what we like to call the Chickenshit Club.”

Comey had laid out how prosecutors should approach their jobs.  They are required to bring justice. They need to be righteous, not careerists.  They should seek to right the biggest injustices, not go after the easiest targets.

This ‘chickenshit club’ has continued to grow.  No top bankers from the top financial firms went to prison for the malfeasance that led to the 2008 financial crisis. And the problem extends far beyond finance–to pharmaceutical companies, tech giants, auto manufacturers, and more.

DPAs (deferred prosecution and nonprosecution agreements) have become the norm in the USA (and now is being legislated in Canada) where high crime perpetrators are being given the easiest way out by ensuring prosecution is carried out by paying a nominal fine and agreeing to minor policy changes, but without serving any jail time.

Political parties have joined the ‘Chickenshit Club’ by taking the easiest way out and failing to promote social justice and equality for all therefore ensuring that wealthy households and corporate elites continue to increase their wealth over single person and low income households.

The ‘Chickenshit Club’ of low income and food insecurity and minimum wage

Living Wage and Minimum Wage

It is a known fact that the Canadian minimum wage in all provinces is not sufficient to bring households up to middle class status.

A major failure of Living Wage research is that it usually only identifies three household profiles, a single person, single parent with children and a family comprised of two adults and children.  The failure to include a household of two adults no children provides only a partial picture of inequality because it costs a single person household more to live than a two adult persons household.

Review of Living Wage profiles shows that even though living wages are higher than minimum wage, living wages are “no walk in the park”.  A living wage which only covers basic needs still leaves low income households, especially those with rent or mortgages, suffering a ‘no frills’ lifestyle with an inability to save for retirement or emergencies or replacement of vehicles.

By excluding the two adults no children household profile from Living Wage profiles the single person household is an incomplete profile since it costs more for unattached person to live than the two adults household as shown in cost of living scales like Market Basket Measure (MBM).  Example:  if single person household has a value of 1.0, lone parent, one child or two adults household have a value of 1.4, one adult, two children 1.7 and two adults, two children 2.0.  It costs more for singles to live than couples without children.

Many politicians, married and financially illiterate believe that a living wage is a good income but it only provides the bare necessities of life. The living wage in Calgary is about $18 per hour and in Metro Vancouver is about $19 per hour.  There is no saving for retirement or maxing out of RRSP and TFSA accounts on a living wage (see example below for single person household with $50,000 income).

In a recent Conservative meeting, a Canadian Conservative Member of Parliament for Alberta stated he did not think the recent increase in minimum wage helped anybody, not even the poor.  When challenged that ‘this was quite the statement’ and ‘what was the answer to low wages?’, he said ‘he didn’t know’. As outlined below, the upside financial chickenshit mess that has been created by government and politicians for single person households and low income families is because more benefits with less taxes and no declaration of assets has been given to the wealthy and the married.  To create more financial social justice and equality, a drastic plan along the the lines of “Elizabeth Warren” and “Bernie Sanders” is needed so that the wealthy, married, and corporations pay their fair share.

The ‘Chickenshit Club’ of Single Person Household Poverty

Present day political parties and married/two person households with no children belong to the ‘Chickenshit Club’ when they fail to recognize, through financial illiteracy and financial discrimination, that single person no children households will likely face more income insecurity in their lifetimes.

From The Affordability of Healthy Eating in Alberta 2015 by Alberta Health Services (affordability-of-healthy-eating):

(Page 3) “In Alberta, more than 1 in 10 households experience food insecurity and more than 1 in 6 children live in a home where at least one member is food insecure. Nearly 80% of Albertan households who rely on social assistance cannot afford to purchase adequate amounts of nutritious food or regularly endure significant worry about access to food. Furthermore, more than 75% of all food insecure Albertans are actively employed yet still are unable to secure enough money to support both their nutrition needs and other indispensable life necessities, such as housing and clothing.”

(Page 9) The above report provides a more complete picture of income inequality because it identifies four household types – 1) a family with two parents and two children because this composition is used most frequently by other social, income and poverty reports across Canada, 2) a female lone parent due to the high prevalence of food insecurity among this household type, 3) a single adult under age 65 since this demographic experiences the highest rate of food insecurity and the least financial support through social policy, and 4) a single senior to highlight the ability of current social policy to effectively reduce the risk of household food insecurity in this population.  Unfortunately, the two adults person household is still not represented in these profiles.

Quote from the report (page 18): “Although Alberta remains the most prosperous region in Canada, it also maintains the largest gap in income inequality since the wealthiest 1% earns 18 times more than the average income in the province. Thus, the relative economic power of low income households in Alberta is weaker than low income households in all other regions across the country.  Despite a strong economy, the poverty rate in Alberta has remained around 12%, which is only slightly below the national average of 12.5%. Boom and bust cycles, increasing household debt and the high number of temporary, precarious and low-wage jobs put many Albertans at risk of falling into poverty. The Alberta populations at highest risk to experience poverty include:  single persons, families with children under 18 years old, families with more than one child, female lone parent families, women (not an inclusive list).

(Page 24 and 27) These statistical data sources also validated several important characteristics of Canadian and Albertan households that are at highest risk for household food insecurity:  low income households, individuals who rent their home (rather than own their home), women, lone parents, Indigenous Peoples, individuals who receive social assistance, individuals who work for low wages, unattached (single) people, households with children younger than 18 years of age, recent immigrants and refugees (e.g. in Canada for less than five years), people who have a disability.

(Page 28) Single adult – In Alberta, 40.7% of people aged 15 and older are neither married nor living with a common‑law partner and 24.7% of all households are home to only one person.  Unattached persons in Canada experience three times the rate of food insecurity compared to couple households without children.  In Alberta, single people represent five times more food bank users than couples without children.  The rate of poverty among single adults across Alberta is 28% whereas this value drops to only 6% for all couple families.

(Page 29) Single female – Unattached Canadian women are four times more likely than women in families to live in a low income household.  Sixty two per cent of minimum wage earners in Alberta are female.  Across Canada, 3 out of every 4 minimum wage earners older than 24 years of age are women.

(Page 30) Single adult 25–30 years old – Of all Canadian age groups, young adults between 20 and 34 years of age have the highest rates of moderate and severe food insecurity.  Both males and females between the ages of 20 and 29 have the highest nutrition needs of all adult groups and would therefore need to spend a greater proportion of their income on food to support their health and well-being.  By the time Albertans reach age 25, more than 83% are no longer living with their parents, so this age range would best reflect the reality of a young, single person at higher risk for food insecurity in Alberta.

(Page 31) Minimum wage – The percentage of 25–29 year olds who work for minimum wage in Alberta doubled between 2012 and 2014, and this is the largest jump for any working age group across the province.  More than 1 in 4 female minimum-wage earners and nearly 1 in 5 male minimum-wage earners are 25 years or older.  In Alberta, inflation has quickly eroded the contribution of every small increase to hourly minimum wage rates since the early 1980s.

(Page 39) Unattached persons in Canada experience three times the rate of overall food insecurity and seven times the rate of severe food insecurity when compared to couple households without children or with adult children. Single people represent the largest proportion in Canada, at 27.8% of all households, and they also constitute the largest share of food insecure homes at 38.2%. Single people without children also receive the least amount of government social support, as they are not eligible for the financial support of programs like family‑based tax credits and health benefits.

(Page 40) Single-person household based on the after-tax, low-income cutoff measure (LICO), the rate of low income in unattached male and female households has risen over the past decade while all other household categories have experienced a stabilized or decreased rate of low income.  Nearly 1 in 3 unattached people between ages 18 and 64 lives below the LICO in Canada, compared to only 1 in 20 of the same cohort living as part of an economic family.  An economic family refers to a group of two or more people who live in the same household and are related to each other by blood, marriage, common-law or adoption. The rate of poverty among single adults in Alberta is 28% but this value drops to only 6% for all couple families.  More than 40% of Albertans aged 15 and older are neither married nor living with a common‑law partner and nearly one quarter of all homes in the province are inhabited by only one person. Between 1961 and 2011, the proportion of one-person households in Alberta has more than doubled and now nearly matches the number of homes with families or couples without children.  Across the province, single people represent one third of all food bank users, and they outweigh couples without children by three and a half times.

(Page 40) Minimum wage is an important social policy because it intends to help lift low-paid workers above the poverty line so they have adequate income to meet basic needs for overall well-being.  However, unlike Canada Pension Plan (CPP) and Old Age Security (OAS), minimum wage is not regularly indexed to inflation through adjustments to match the increase in the Consumer Price Index.  This can lead to a hidden erosion in the value of this social policy since the general public tends to be unaware of how governments calculate changes to minimum wage rates over time.  In 1965, Alberta’s minimum wage equalled 48.5% of the average provincial income, but by 2010 this proportion had declined to only 35.5%. Alberta’s hourly minimum wage rate had been the lowest of all provinces and territories for several years, but recent increases have raised low-paid workers’ earnings to a minimum of $11.20 per hour as of October 2015.

(Page 41) There is a widespread misconception that most Canadians who earn minimum wage are teenagers who live with their parents, but more than 1 in 4 female minimum wage earners and nearly 1 in 5 male minimum wage earners are actually 25 years old or older. In addition, individuals who are older than 24 years of age are the most likely to live alone while they earn minimum wage.

(Page 42) …. In fact, unattached Canadian men and women between the ages of 18 and 64 are five times more likely to live on a low income compared to their counterparts who live in economic families.  Although the probability of living in a food insecure household is higher for females than males across all age groups and household compositions, income-related food insecurity affects unattached men at the same rate as unattached women.

(Page 44) Among all unattached Canadians, there are twice as many single adults younger than 65 years of age living below the after‑tax LICO compared to single seniors who live below this income.  In addition, the prevalence of household food insecurity is two and a half times lower for the elderly who live alone than for unattached adults who are younger than 65 years old.  However, the likelihood that a single senior will live on a low income is 10 times the rate for seniors who live as part of an economic family. This is significant since 25% of Albertans aged 65 years old and older live alone and unattached individuals are the most likely to rely on OAS and GIS.

“Social assistance soaring in Alberta, even as economy improves”, 2017 – Number of claimants on provincial income assistance programs has climbed to 54,374 in January of 2017, about 20,000 higher than at the start of the recession in 2015.  Makeup of claimants include individuals 69%, lone-parent families 24%, couples with children 5%, and couples alone 3%.  (Note:  Couples with children and couples alone only equal 8% of the total).  The Calgary Food Bank served a record 171,000 clients in 2016.

The real truth about the financial lives of unattached (one person) household

A single person household has to make an extraordinarily high income to achieve the same level of wealth as married with and without children households. A minimum wage means they will be living in poverty and with a living wage barely able to meet the financial necessities of life with no ability to max out RRSP and TFSA contributions.

Example of approximate average cost of living for a single person household (easily obtained from Living Wage Research):  Rent for bachelor apartment (including water, electricity, tenant insurance) $1,000, food $400, vehicle (gas, repair and insurance) $200, phone/internet $300, clothing/footwear $100, dental/eyecare $100, house tax and insurance if a homeowner $250, contingency saving for emergencies and replacement of vehicle (10%) $300.  Total equals $2,650 or $31,800 per year ($16 per hour based on 2,000 work hours). Totals do not include other expenses like bank fees, personal care expenses, household operation and maintenance, pets, vacations, entertainment, computer purchases and expenses, gifts, condo fees and professional association and union fees, etc.  Note: this does not include saving for retirement beyond Canada Pension Plan (CPP) contributions. The living wage for Alberta is about $18 per hour based on 35 hour work week or 1,820 hrs per annum. Single person households receive very little income from government transfers (municipal, provincial and federal).

The following three examples, although simplistic, are real life examples for single persons:

  1. Single person private sector employee with $50,000 income ($25 per hour based on 2,000 worked hours) will pay about $11,000 for taxes, CPP and EI deductions.  This results in a only a barely survivable net or take home living wage income of $39,000 ($19.50 per hour based on 2,000 hrs. or $3,250 per month). Using average cost of living of $32,000 from above paragraph, this person only has a reserve of about $600 per month.  It is impossible for this person to maximize RRSP ($9,000) and TFSA ($6,000) contributions (about $1,200 per month) even though many financially illiterate believe $50,000 is a good income for unattached individuals.  Moreover, as seniors their standard of living will likely be frugal and less equal to that of married/common-law households.
  2. Single person private sector employee with $60,000 income ($30 per hour and 2,000 work hours) will pay about $14,500 in taxes, CPP and EI contributions.  This results in a net income of $45,500 ($22.75 per hour or $3,800 per month). This person will not be able to max out RRSP ($10,800) and TFSA ($6,000) contributions (about $1,400 per month).  This still equals a frugal lifestyle (note expenses like vacations and eating out are not included in the average cost of living).
  3. Single person public sector employee with $75,000 income ($37.50 per hour and 2,000 work hours) will pay about $17,000 in taxes, CPP and EI benefits plus pension plan contribution of $7,500 (10 per cent).  Union dues are not included here. This results in a net income of approx. $51,000 ($25.50 per hour or $4,200 per month). This person may be barely able to max out RRSP ($13,500) and TFSA ($6,000) accounts (about $1,541 per month) at the expense of no vacation and eating out expenses and will have a public pension on retirement, but still will not have a standard of living equal to that of married/coupled households since they pay more taxes than married households and will not receive benefits of married persons (spousal RRSP, pension splitting, etc.)  Market Basket Measure shows it costs single person household more to live than married households.

Lessons learned:  A minimum wage of $15 means single person households will live in poverty and a living wage equals a very frugal lifestyle with no frills.

‘Chickenshit Club of women being paid less for equal work

From the above Alberta Report and Canadian statistics it is evident that a major problem still  exists of women being paid less for equal  work.

From Global News, report finds that women in Canada earn just 84 cents for every $1 earned by men, a gap similar to the one reported in official statistics. In 2017, Statistics Canada said Canadian women were making 87 cents for every $1 earned by men.  [T]he Glassdoor study went one step further, finding a four per cent pay differential between men and women even when factors like education, years on the job, occupation and professional title are taken into account. In other words, Canadian women are making just 96 cents for every $1 earned by men with the same qualifications, job and experience, something Glassdoor is calling the “adjusted pay gap.”

How many years is it going to take before women receive equal social justice on pay equity?  Instead of being ‘chickenshit political parties’ which political party is going to take this issue on?

‘Chickenshit Club’ of Canada Child Benefit

The present day ‘chickenshit club’ Canada Child Benefit does help to bring low income households with children out of poverty and food insecurity (this is a good thing), but only during the first eighteen years of the household’s entire lifecycle.  When children are grown, low income single parent households are back to ‘square one’ of the adult probability of living in poverty.

The Canada Child Benefit was implemented by Stephen Harper, previous Conservative Prime Minister, and was taxed.  Liberal Prime Minister Justin Trudeau made it non taxable.

All political parties have been complicit in perpetuating financial policies that increase middle class wealth to upper middle class status while forcing poor families and single unmarried individuals further into poverty.

Financial Post “Couple needs to cash in rental condo gains to make retirement work” (ditch-rental-condo-to-get-ahead) details a couple age 42 and 43 already having a net worth of $1.8 million, take home pay of $10,936 per month and receiving $286 in Canada Child Benefits for three children.

In 2018, Ontario couple with a child under six years of age would stop receiving CCB payments with a net income reaching $188,437.50 without other deductions such as RRSP (canada-child-benefit-is-a-win-for-most-families).  $188,000??? This is not an income of poverty.

The inequality of family benefits for the upper middle class and wealthy families is perpetuated even further by the compounding of benefits on top of benefits.  The article “Supercharge your Canada Child Benefit by making an RRSP contribution” (supercharge-by-making-an-rrsp-contribution) outlines how RRSP contributions are considered to be a tax deduction; therefore, they lower taxable income and can increase the amount of CCB payments.  The example of Ontario family with 3 kids under age 6 years of age and a family net income of $75,000 with full $13,500 RRSP contribution for the year (18% X $75,000) can expect a CCB payment of $13,215 and will pay approx. $11,814 in taxes.  Because of RRSP contributions in the previous year, their CCB payments increased by $1,465 for the present year. Additionally, they will save $1,401 in taxes and at a marginal rate of 29.65%, their RRSP contribution will also result in a tax refund of about $4,000.  The compounding effects of benefits means they will pay less taxes, get larger CCB payment and increase their RRSP wealth. The total family income with CCB is $88,215 (combined after tax and tax free) and they have increased their wealth by $13,500 RRSP for the year of contribution).

Using turbotax calculator for Alberta family with $250,000 gross income or approx. $160,000 net income ($13,300 per month) they should be able to max out maximum allowable 2019 $45,000 for couple to their RRSPs and $12,000 TFSA for the year.  Through compounding effect of benefits, including marital, they will pay approx.$21,000 less taxes, get larger CCB payment, increase their RRSP and TFSA wealth, own their home, and have approx. $181,000 minus TFSA $12,000 contribution or $169,000 ($84.5/hr.) spending capability annually.

It should be noted that there may be other credits and deductions that can be used which will further increase income available for spending.

What would anyone think that unattached individuals with no children don’t deserve to be angry because they know their hard earned money is used to increase the wealth of upper middle class and wealthy families since these families never pay their fair share in taxes because they can avoid taxes through multiple compounded benefits ???

“Ontario woman’s problem is too much debt and too little income” (forced-to-retire) is a very good example of what singles might face (i.e. on $3,750 income per month) when they are forced to retire early due to illness (doesn’t say if she is divorced or widowed).

Solution:  As per above example of $50,000 income it is impossible for single person household to have a meaningful financial life equivalent to that of married no children households.

Politicians need to get off their chickenshit politics, stop taking the easy way out, and do the hard thing by including assets and Market Basket Measure calculations in financial formulas so that singles and low income households get financial social justice and equality equal to that of wealthy and married households.

How about implementing legislation where never married no children persons should not have to pay any income tax on incomes below $50,000 so that get a benefit equivalent to that CCB and multiple benefits to families with and without children?

Chickenship Club of Climate Change

The Green Party keeps talking about a climate change plan, but like other plans and environmentalists/protesters it is all talk with very little information.  When is the Green Party (they are after all the Green Party) going to come up with a plan, for example, a line graph that shows what will happen in year one, year two, etc.  What is going to happen to all the gas combustion vehicles, gas furnaces and water tank heaters. Where are you going to dump them?  Apparently some gas combustion vehicles can be converted to electric. What are you doing about that? Are you going to shut very expensive oil refineries down that are still able to be used for another fifty years?

Many green earth technologies use rare earth minerals some of which are very toxic.  At the present time China produces 80 per cent of the rare earth minerals.  Just how do some extreme environmentalists and politicians think rare earth minerals get to Canada from China to be used in production of wind turbines?  The answer is probably by tanker.

The hypocrisy of the tanker ban is that it is only one way?  Does the  ban on tanker traffic address the tankers coming into Canada?

Elizabeth May was so impressed with India’s climate change plan.  However, India has just voted in again an authoritarian government with the help of far right Hindu religious voters.  India at present time has no middle class and the highest rate of unemployment in forty five years.

Any plan that is implemented by any country has to provide 100% climate change funds to the poor to convert from gas to electricity instead of excessive compensation of the wealthy who are the highest emitters of energy and the biggest consumers of natural resources.

Elizabeth May since her marriage has upped her membership in the ranks of the wealthy high super emitters of energy and super users of natural resources. Those with multiple properties (examples: second property hop farm owned by Elizabeth’s husband, Arizona and other vacation properties that sit empty for six months of the year and excess travel between these properties, huge motorhomes, etc.) should pay more for this privilege afforded to them by their wealth.

Green Party Reform of spousal pensions for those who have married after the age of 60 or retirement

The Green Party and particularly Elizabeth May belong to the chickenshit club of married/coupled financially privileged households.

From the ‘Surviving Spouses Pension Fairness Coalition’ May states she has lobbied to repeal legislation that denies pension benefits to spouses who have married after the age of 60 or retirement.  In one of her letters she states:  …The Green Party supports deleting these restrictive clauses in the Federal Superannuation Acts which penalize pensioners who have remarried or married for the first time after age 60 after retiring….these clauses serve to unfairly deny hard earned pension benefits to deserving partners.  These….clauses are causing great hardship to the survivor whose spouse gave a life in service to our country.”

Liberal Prime Minister Trudeau in his letter also supports this –  “I and the entire Liberal Caucus, believe that Canadian seniors are entitled to a dignified, secure, and healthy retirement. Retirees deserve financial security; they deserve a strong Canadian Pension Plan, and a government who is not only committed to protecting the CPP, but is dedicated to improving its benefits.  A secure and comfortable retirement is essential to achieving middle-class success, and Liberals believe that the federal government must do more to fulfill this promise. While the Conservative Government has left Canadians and the provinces to fend for themselves, Liberals support working with the provinces to create legislation that will make retirement security easier, not harder for all Canadians to achieve.”  (Shouldn’t the same apply to never married no children senior households?)

Tom Mulcair, NDP letter states – “New Democrats want to acknowledge the debt we owe our seniors and reward the years of hard work and dedication to our country.  That’s why we are committed to ending these archaic restrictions on benefits for pensions and their spouses.”

This is not the only pension plan where marriage for only a few years privileges the surviving spouse who hasn’t made any contributions to the pension.

Why, why, why do married persons believe they are entitled to benefits they haven’t earned?  These newly married persons never worked for and never made contributions to the pension of their spouses.  The reform of all spouses pensions similar to the above promotes the financial discrimination of never married, no children persons.  Why do these married persons who never worked for these pensions deserve to have a better lifestyle than never married, no children persons?  Never married, no children persons can never access another person’s pensions. As stated above, it has been shown that it costs more for never married, no children persons to live.  Why can’t a new widow because of death of the spouse live with the same financial realities as a never married, no children person? Afterall, the widow is now ‘single’.

Solution:  A proper financial justice solution would be to pay whatever is left in deceased spouse’s pension to the surviving spouse in the same way that whatever is left in the never married, no children person’s pension is paid to the listed benefactor.  If benefit after benefit is given to widows, equal financial remuneration equivalent to these benefits should also be given to never married, no children seniors.

Chickenshit Club of Conservatives Jason Kenney (Alberta) and Doug Ford (Ontario)

Jason Kenney is already showing his true Trumpian values by targeting most vulnerable residents at the lower end of the financial scale.  He is doing this by lowering corporate taxes and reducing teen minimum wage instead of making the wealthy pay their fair share of taxes. Just waiting for him to reduce progressive taxes back to a flat tax!  Doug Ford continues to do his damage by breaking election promises, attacking healthcare and public sectors and employees of these sectors, and implementing retroactive financial policies on budgets that have already been planned.

Where are the ‘Elizabeth Warren’ and ‘Bernie Sanders’ of Canadian politics that will promote social justice and financial equality by ensuring corporations and upper middle class families and the wealthy pay their fair share of taxes without the compounding of benefits that make them wealthier than single person and low income households?

Chickenshit Club of Liberal Party

The Liberals also belong to the Chickenshit Club of politics as they have done very little to promote social justice and equality where wealthy and corporations pay their fair share.  They are promoting ideas for the elderly to receive benefits if they have to work over the age of 65. How nice – make the senior poor work longer while giving benefits to the wealthy and married who have multiple compounding of benefits which allow them to retire at age 55.

Liberals keep talking about helping the middle class – the real truth is they are pushing the middle class up to the upper middle class while keeping unattached persons and low income families at the lower end of the financial scale.  With their plans there will be no middle class.

The Liberals have done nothing to mitigate the financial injustice and inequality of Conservative Tax Free Savings Account (TFSA) which benefit wealthy the most.

The following  was published in the Calgary Herald as this blog author’s opinion letter on TFSAs – ( Ted Rechtshaffen and Fraser Institute are telling half truths since only child rearing years are discussed on who is paying more taxes.  Wealthy Canadians with TFSA accounts pay no tax on investments earned; therefore, someone else is indeed picking up the bill, i.e. those who can’t afford TFSA accounts. Singles pay more taxes throughout entire lifetime).

“TAX LOOPHOLES NEED TO BE CLOSED”

Re: “Trudeau is right, 40 per cent of Canadians pay no income tax, Opinion, Feb. 8, 2019 (someone-else-is-picking-up-the-bill) ”

Ted Rechtshaffen and the Fraser Institute once again tell half-truths about who pays the most income tax.  Conservatives have created a TFSA monster at home (not offshore) tax loophole.

“They Want To Spend $50,000 In Retirement, Did They Save Enough?”(did-they-save-enough) outlines how an Ontario couple with large TFSA, RRSP accounts and a $600,000 house can retire at 55 and evade income taxes for 15 years while using benefits intended for low-income persons.

Canada, one of the few countries with TFSAs, has the most generous plan with the only limit being annual contribution amounts. Others (example Roth IRA) impose age, income and lifetime limits on contributions.

Without further addition of TFSA limits, the wealthy will pay less income tax than those who cannot afford TFSAs.

Chickenshit Club of Drug Cost and Advertising

All political parties are lobbying to cut drug costs.  Has anyone thought of limiting the amount of advertising drug companies can do?  Advertising is very expensive. Surely, this money could be used to decrease drug costs and to promote research for new drugs.  Why does one have to listen to advertisements on Peyronie’s disease, hemorrhoids, female and male sexual drive dysfunction, etc. over and over again.  Information on benefits of drugs should occur from discussion between the doctor and patient, not from advertisements. One solution would be to limit the amount of times each drug company can advertise in a given time period.

Chickenshit Club of Issues like Tanker Traffic Ban, Money Laundering, etc.

It doesn’t matter which political party it is – Liberal, Conservative, Green Party, BC NDP party, etc., all political parties with their chickenshit politics are trying as hard as they can to harm certain provinces and low income citizens in any way they can.  Governments at all levels have failed in controlling ‘dirty money’ and indeed have been complicit in promoting it. Some have hypocritically implemented legislation that negatively impacts only certain parts of the country.

Tanker Traffic Ban – on west coast, but not the east coast while increasing other revenue generating traffic such as cruise ships, ferry traffic and sightseeing boat traffic on the west coast.

Money Laundering in BC and Canada – The money laundering problem is prevalent across Canada but the egregious case of the ‘Vancouver Model’ of money laundering in BC shows how greed of chickenshit government overtakes the moral and ethical logic of doing the right thing.  BC governments failed to address the problem because of the huge amounts of money generated for the BC Lottery Corporation to be used for government programs. Since this also apparently involved real estate, housing prices rose to an exponential level.  Who is affected most of all? – low income persons who can’t afford housing, be it rental or ownership.

CONCLUSION:

Unless there is a major change to the upside down financial situation of politics and government where the wealthy, married and corporations stand to financially benefit the most (selective socialism for the rich), there is little hope that single person households and low income families will ever reach the middle class status so hypocritically touted by governments, politicians, families, and the elite. They should seek to right the biggest social injustices and financial inequalities, not go after the easiest solutions.

(Updated June 8, 2019)

(This blog is of a general nature about financial discrimination of individuals/singles.  It is not intended to provide personal or financial advice.)

TFSA (CANADA) – RAMIFICATIONS OF FINANCIAL DISCRIMINATION AND ABUSE OF THE PLAN

TFSA (CANADA) – RAMIFICATIONS OF FINANCIAL DISCRIMINATION AND ABUSE OF THE PLAN

(These thoughts are purely the blunt, no nonsense personal opinions of the author about financial fairness and discrimination and are not intended to provide personal or financial advice.)

This case study outlines how a financial advisor has shown it is possible for Canadian TFSA holders with large accounts to evade paying income tax for a number of years (15) and use benefits intended for low income persons by circumventing the low income assistance programs.

HISTORY OF TAX FREE SAVINGS ACCOUNT (TFSA)

The TFSA was introduced in 2009 by Stephen Harper, Prime Minister and Leader of the Conservative Party, and Jim Flaherty, Minister of Finance.

The maximum annual contribution room at present is $6,000 per year and is indexed to the Consumer Price Index in $500 increments to account for inflation.  The 2015 Progressive Conservatives raised the contribution limit to $10,000 and eliminated indexation for inflation.  However, the newly elected Liberal government re-implemented the pre-2015 contribution limit of $5,500 for 2016 which will be indexed for inflation after that.  As of January 1, 2019, the total cumulative contribution room for a TFSA is $63,500 per person and $127,000 for couples and for those who have been 18 years or older and residents of Canada for all eligible years. Any unused contribution room under the cap can be carried forward to subsequent years, without any upward limit.  There are no limits on withdrawals from TFSA accounts. TFSAs are not declared as income and, therefore, are not taxed.

CASE STUDIES FOR COUPLE MICHAEL AND JULIE,  UNATTACHED PERSON MICHEL AND UNATTACHED PERSON PUBLIC SERVICE EMPLOYEE

(1) THEY WANT TO SPEND $50,000 PER YEAR IN RETIREMENT.  DID THEY SAVE ENOUGH? By Mark Seed, My Own Advisor and Owen Winkelmolen, PlanEasy) LINKS

Michael and Julie (they-want-to-spend-50000-per-year-in-retirement-did-they-save-enough)  $600,000 paid for home and a million dollars in retirement savings.

Sources of Income chart for Michael and Julie (Sources-of-Income-50000-per-year-.png) – they want to retire on $50,000 per year at age 55 – shows how they can avoid paying taxes for 15 years while using benefits intended for low income persons.

Net Worth chart for Michael and Julie (Net-Worth-50000-per-year-post-September-5-2018.png) at age 100 they will still have an enormous amount of wealth, especially in TFSA accounts.

(2) ALL THE FRUGALITY IN THE WORLD WON’T LET THIS 34 YEAR OLD RETIRE AT 45 by Allen Allentuck LINK                                                                                Michel (all-the-frugality-in-the-world-wont-let-this-34-year-old-retire-at-45)

(3) PUBLIC SERVICE EMPLOYEE BASED ON THE REAL LIFE EXPERIENCE (SINGLE)

Financial Profile Page 1 revised Jan. 2019 post

Financial profile TFSA holder2 page 2 revised Jan. 2019

CAVEATS – Financial information for couple in this report is limited.  It is difficult to determine if this is a real life case scenario or an example made up to illustrate what is possible for $50,000 retirement income.  As stated in the report the investment returns for TFSA remains constant for each year which is not the case in real life. It also is not possible to assess if real estate value will go up or down. It appears the couple have no children.

Financial profile for unattached individuals –  Michel’s food cost seems high (unless he requires a special diet and males require more calories). It appears he has no condo fees so he probably has expenses like condo maintenance.  Public service employee profile is based on snapshots of real life experiences of unattached persons. For the most part it closely matches the financial profile of Michel.  Food costs are replaced by mortgage costs.

Financial profiles are incomplete.  For example, expenses like medical eye and dental care and saving for vehicle replacement are not listed.

DETAILS OF CASE STUDIES FOR MARRIED COUPLE MICHAEL AND JULIE (Ontario), AGE 35 AND UNATTACHED INDIVIDUAL MICHEL, AGE 34 (Quebec)

Retirement age – Michael and Julie want to retire at age 55.  Michel wants to know if he can retire at age 45 and travel the world.  Many married couples have the ability to retire at age 55. Some would say Michel’s desire to retire at age 45 is unrealistic.  His financial advisor states that regardless of how frugal Michel is he will not be able to retire before the age of 60. Why is that unattached persons always have to be frugal and work longer?

Retirement income – Michael and Julie want a retirement after tax income of $50,000 at age 55.  Michel’s financial advisor states he unequivocally has to work to age 60 to achieve a retirement after tax income of $40,000.  There is that frugality once again!

Investment Amounts at present time – Michael and Julie’s account at present time totals $570,623 in TFSA and $423,706 in RRSP.  They have continually maxed out their TFSA accounts. Overall their portfolio has a 70/30 mix of stocks and fixed income.  A 6% rate of return on stocks and a 2.5% rate of return on fixed income is assumed for the article. They already have at age 35 a total close to a million dollars so it is difficult to figure why the amount wouldn’t be in excess of well over a million dollars in twenty years time at age 55.

Michel has $24,329 in TFSA and $90,701 in RRSP.  Calculations for retirement income are based on a 3% rate of return.

Investment Amounts at time of retirement – Estimate for Michael and Julie is stated in 2018 dollar value, not value at time of retirement, so value at retirement should be well over $1 million.  Total capital estimates for Michel at age 60 are $895,000.

Housing – Michael and Julie own a $600,000 house which they expect to own outright at time of retirement at age 55.  They plan on selling their home around age 80 and moving into an apartment or condo to rent. That might add $30,000/year to their expenses but they will have freed up almost $600,000 in real estate assets (minus 5% transaction fees).

Michel has a $165,000 condo.  He has a $97,000 mortgage with 24 years remaining amortization. At present rates, the mortgage will be paid when Michel is 58.

Income – Michael and Julie’s income is not stated, but it must be quite high to achieve the investments and $600,000  house they have at the present time. Michel has an income of $70,000 which is well above the median and average incomes for unattached individuals.

Vehicle –   Value of vehicle for couple is not stated.  The value of Michel’s vehicle is $2,500 which must be pretty much a “junker”.

How Michael and Julie will achieve their goal of retirement income of $50,000 as outlined in article

Because all their retirement savings are inside registered accounts such as their TFSAs and RRSPs, Michael and Julie have a lot of control over withdrawals and allows them to reduce taxes and optimize government benefits like CPP, OAS, and GIS.

To start, Michael and Julie will withdraw just enough from their RRSP to maximize the basic tax exemption, the rest of their income will come from their TFSA. This mix of RRSP and TFSA withdrawals (with no other income sources) will help them pay virtually zero taxes for the first 15 years of their retirement.  This will take them from ages 55 to ~ age 70.  (In the process they will have gained  almost $135,000 in benefits from paying no taxes for 15 years and reduced the income taxes on their estate to nearly zero.  At time of death their investment portfolio will consists mainly of TFSA.)

There are two other ways they can optimize their taxes and benefits during retirement.

The first is to reduce their taxable income between ages 64 and 71 by drawing primarily from TFSA. By starting OAS at age 65, but delaying CPP to age 70, their TFSA withdrawals will allow them to be eligible for GIS, GAINS, GST and Trillium benefits which are supposed to be only for low income persons (definitions provided below). Between ages 65 and 72 these benefits meant for low income persons will add $108,305 to their retirement income.

The second way they can optimize their taxes and benefits is to slowly shift their RRSPs into their TFSA each year. By taking advantage of the lowest tax bracket, they can slowly draw down their RRSPs at a low tax rate and shift these investments into their TFSA. Moving money into their TFSA makes these funds easily available in the future and reduces the taxes on their final estate.

Once they reach age 65 their withdrawal rate on investment will drop dramatically as Old Age Security (OAS) and other government benefits kick in. Then it drops again at age 70 when their Canada Pension Plan benefits begin.  By delaying withdrawal of CPP at 65 years to 70 years the rate of return on CPP will increase by 8.4% per year. By delaying CPP to age 70, they will receive 42% more than if taken at 65.

How Michel will achieve his goal of retirement income of $40,000 at age 60

From the article:  “The problem of early retirement is twofold: Not only must one build up savings faster, but those savings have to last a longer time than they would with later retirement.

In Quebec, a man we’ll call Michel, 34, works in financial services. He earns $70,000 a year and takes home $3,640 per month after many deductions for taxes and benefits. Frugal in his spending, cautious in his investing, he wants to retire at age 45 with $40,000 income per year after tax. Assuming a 3 per cent return rate after inflation, that implies he will be able to add $1 million to present savings in 11 years. On present income, it’s unlikely.

Michel’s goals will be hard to achieve even by 50, the planner says. The earliest he can retire with a $40,000 income after tax is 60. Assuming that he can achieve and maintain a 3 per cent annual return after inflation, then in 26 years his RRSP with a present value of $90,701 and $10,800 annual contributions will have risen to a value of $612,000. With the same assumptions, his TFSA with a present value of $24,329 and $6,000 annual contributions including catch-up additions to fill space will have risen to a value of $283,800. His total capital available for retirement income will total $895,800.

Assuming a 3 per cent return before tax, his RRSP and TFSA capital at 60 would generate $40,475 per year based on an annuitized payout that would exhaust all capital and income in the following 35 years to his age 95.

If he waits until age 65 and were to draw QPP (Quebec Pension Plan) of 64 per cent of a theoretical maximum benefit of $13,600 in 2019 dollars per year at age 65, $8,704, his total income would be $49,179. Retiring early makes attaining this maximum unlikely even with scheduled increases in CPP/QPP contributions and benefits, a planned 52 per cent boost to be phased in starting Jan. 1, 2019. After 20 per cent average tax, he would have $39,343 per year or $3,280 per month. At age 65, he could add Old Age Security benefits, currently $7,210 per year for total income of $56,389 before tax. Still using the 20 per cent rate, he would have post-tax income of $3,760 per month.

Calculations show that even if Michel retires at age 60, 26 years from now, he would have to live very modestly. Retiring at 60 and starting QPP benefits with a 36 per cent discount would have a drastic cost on his total lifetime benefit from CPP. The amount he will give up each month compared to the full age 65 benefit, about $5,000 per year, will have cost him $171,500 with no compounding for the following 35 years. It is a very high price to pay for what amounts to a five year bridge to full benefits at 65.”

ANALYSIS OF FINANCIAL PROFILES

Housing – Couple has $600,000 house and Michel has $165,000 condo.  Depending on what part of Ontario couple is from this is probably par for housing.  For Michel it is possible that in parts of Quebec housing can be purchased for lower prices. However, Michael and Julie will probably have much higher investment possibilities when they sell their house versus when Michael sells his condo.  One can bet that couple has a better lifestyle in their house than Michel in his condo. In many parts of Canada it would extremely difficult for an unattached individual to purchase housing under $200,000.

Accumulation of wealth – It is unmistakable that couple is able to achieve so much more in wealth than unattached individual even when unattached individual has a relatively high income and is frugal in his spending.  At age 35 they are already millionaires. The net worth information in the article is not clear on how much net worth is expected to increase between present date and retirement at age 55. The Net Worth table appears to use the same net worth at present and at age 55 – about $1 million in real estate and RRSP and $600,000 in TFSA.  At age 75, after paying no income tax for 15 years and using benefits that are supposed to be for low income persons, values appear to be about the same. However, what is shocking is how even though RRSP and non registered accounts have virtually been depleted at age 100 the TFSA has increased in value to over $2 million. The reader is encouraged to view the tables at the links provided above.  They provide a striking picture of how income tax collection is flatlined at $0 and how net worth increases over time to age 100 instead of being depleted.

It is impossible for unattached persons, no matter how wealthy they are, to ever achieve the wealth that is possible for couples because it costs more for singles to live and they must save a greater retirement amount for one person as opposed to two persons.

Taxes – Many of the financial profiles of unattached individuals with Michel’s income show he would probably pay a rate of 20%.  Couples who are able to use tax avoidance vehicles like pension splitting are often shown to pay income tax at rates as low as 10%.  For Michael and Julie they are able to not pay income tax for 15 years. It is an understatement to say that couples, even wealthy ones, seem to pay less income tax because of manipulation of marital benefits, pension splitting, etc.  Unattached individuals are bearing the brunt of the Canadian tax system which purposely favors married persons over unattached persons.

LESSONS LEARNED

Financial advantages of couples over unattached individualsJust how many times can it be said that according to Market Basket Measure it costs more for unattached individuals to live than couples without children (if single has value of 1.0, the value for a couple without children is 1.4, not 2.0).  Couples without children are able to maximize their net worth over unattached individuals because of marital benefits, ability to multiply wealth times two (TFSA) and compounding of investments times two. All things being equal it is virtually impossible for unattached individuals to achieve the same financial wealth as couples even though it costs more for singles to live.

TFSA revised 2019 copy 1

TFSA outrageously is a goldmine for the wealthy and the married – TFSA has been in place for ten years.  Maxed out TFSA now total $127,000 for couples and $63,500 for unattached individuals.

It is astonishing how Michael and Julie and Michel have been able to reach their TFSA amounts at present time with maxed out contributions.

It stands to reason that the wealthy are more likely to exponentially increase the value of their TFSAs especially if they are more risk tolerant in investment plans than low income persons.

Vetting of Income for GIS and other low income applications – Interest and investment income does have to be declared on low income applications.  However, TFSA investments are not declared as income ever. This is what allows the wealthy to circumvent the financial restrictions on who can receive assistance the low income assistance programs.

Hypocrisy of TFSA declaration of non income –  This may be harsh but TFSA not needing to be declared as income creates anger and despair for those who do not have the means to contribute to TFSA.  TFSA holders who purposefully use benefits not intended for the wealthy could be called TFSA grifters or chiselers – grifters or chiselers are con artists; in this case they swindle people and governments out of money but all within legal limits of the law.

Hypocrisy of those who demonize public pensions – Many, including far right Conservatives and proponents of private enterprise versus government jobs, berate those who receive public pensions, especially defined benefit plans .  Many of these persons are financially illiterate by stating the taxpayers pay for these systems. The real truth is that defined benefit plans are made up of employee, employer contributions and well managed investments.

Persons who are members of public pension plans must contribute a substantial amount (10%) of their income to the plan, pay taxes as contributors and pay taxes when benefits are received.  Many who do not have a choice or choose to contribute to public pension plans cannot contribute fully to TFSAs because their incomes do not allow them to contribute to both pension plans and TFSAs.

Public pensions are not a given.  They can fail if investment managers make bad decisions and if companies decide to abandon public pensions in bankruptcy.

The Canadian Pension Plan (CPP) is a defined benefit plan, so do these same beraters want to abolish CPP?

Those who are able to maximize their TFSA should also pay taxes on their TFSA investments before they demonize public pensions.

Future consequences and collateral damage if TFSA remains the same – Ability to contribute to TFSAs have now been in place for eleven years.  If the plan is not changed so TFSA is declared as income and taxed then the wealth spread between the rich and poor will increase exponentially.  Only the need to help the middle class is being discussed by some political parties. The middle class is already being transformed into the upper middle class and wealthy while singles and the poor (boondoggle-for-singles-and-low-income) are being pushed further into poverty by the actions of these same political parties.  There will be no middle class.

Every year that goes by with no revisions to the TFSA will ensure elimination of the middle class and singles and poor families getting poorer.  Every year that goes by with the upper middle class and wealthy not paying any tax on TFSA investments and these accounts growing to incredible wealth will ensure bankruptcy of the Canadian economy.  How are schools, hospitals, roads going to be built if there is an insufficient tax base to support the building of these projects?

COMPARISON OF TFSA TO OTHER PLANS (how-does-the-tfsa-stack-up)

All TFSA plans are designed to supplement and manage income from other forms of savings.  It appears only the USA, UK, South Africa and Canada have tax free savings plans.  It also appears Canada has the most generous plan with the only limit being annual contribution limit.

The USA Roth IRA has similar contribution limits ($6,000 for those under 50 and $7,000 age 50 and over) but Americans can only make the maximum contribution if their gross income is below a specific threshold – in 2019 the threshold for unattached person modified adjusted gross income limit is $122,000 or less.  Contributions limit is reduced for income between $122,000 to $136,999 and is completely eliminated for income over $137,000. For joint filers (couples) the income limit is $193,000. Contribution limit is reduced for incomes $193,000 to $202,999 or less and is completely reduced for incomes $203,000 or more. US residents have to wait a ‘seasoning’ period of five years, and be at least 59-½ years of age, before they can withdraw tax-free from a Roth IRA.  TFSAs are primarily multi-purpose vehicles while Roth IRAs are primarily meant for retirement savings.

The fine print on Roth IRA contributions limits (roth-ira-contribution-limits) is that contributions cannot be more than individual’s taxable compensation for the year. That means that if taxable income is $3,000, the cap on Roth IRA contributions is also $3,000 for that year. If there aren’t any taxable earnings during the year, there can’t be any contributions.  The one exception is the spousal IRA which allows a nonworking spouse to contribute to an IRA based on the taxable income of the working spouse.  Roth IRA distributions aren’t included in income in retirement so are not taxable. Monies earned from investment are tax-free.

Persons age  59½ or over may withdraw as much as wanted as long as Roth IRA has been open for at least 5 years.  Persons under 59½ years of age may withdraw the exact amount of Roth IRA contributions with no penalties.  However, the earnings from the principal cannot normally be withdrawn prior to age 59½ without paying the 10% early withdrawal penalty.

It should be noted that the Roth IRA has an equivalence scale method built in similar to the Market Basket Measure.  The couple limit of $193,000 to $202,999 is not twice that of the unattached person limit of $122,000 to $136,999.

SOLUTIONS

If Canada as a country does not want to go bankrupt as a result of tax not being collected on TFSAs it is incumbent upon government and politicians to change policies so that TFSA cannot grow to unabated levels.  Also, Market Basket Measure (MBM) must be applied to TFSA formulas so that income does not benefit married persons over single unattached persons. The US Roth IRA does this. Why can’t the same be done for the Canadian plan?  The US Roth IRA does not allow the wealthy over specified limits to have a Roth IRA at all. Also, change the plan so that only contributions can be withdrawn early without penalty like the Roth IRA. Lastly, the nonsensical ability to withdraw contributions from the plan and then at a later top them up again benefits only the wealthy.  Once a contribution is made it should be not able to be topped up again when withdrawn.

Donald Trump’s ignorance on MBM and similar equivalence scale measures is demonstrated by his income tax amount reductions to double for couples to that of unattached persons instead of applying equivalence scale values of 1.0 for singles and 1.4 for couples.

It is unfathomable that Stephen Harper, an economist and Leader of the Progressive Conservatives and the PC Party, would not have taken into account the future ramifications and collateral damage that this plan would cause in creating every widening separation of the rich from the poor as the years go by.

How do governments and politicians change discriminatory financial plans that have been in place for many years without backlash from the privileged and those who feel entitled even with the discrimination?  Which political party will take this on?

For God’s sake, politicians, political parties and those who demonize social programs need to educate themselves on costs of living for unattached persons and poor families versus wealthy couples and consider full ramifications of how to avoid financial discrimination now and into the future.  If heed is not taken to the above then be prepared for the anger as has already been displayed by the poor throughout the world. You have been forewarned!

DEFINITIONS

GAINS – Ontario Guaranteed Annual  Income System may provide a monthly, non-taxable benefit to low-income seniors to between $2.50 and $83 in 2018.

GIS benefit – Guaranteed Income Supplement provides a monthly non-taxable benefit to Old Age Security (OAS) pension recipients who have a low income and are living in Canada.

GST credit – The goods and services tax/harmonized sales tax (GST/HST) credit is a tax-free quarterly payment that helps individuals and families with low and modest incomes offset all or part of the GST or HST that they pay. It may also include payments from provincial programs.

Trillium benefits – Ontario Trillium Benefit combines three credits to help pay for energy costs as well as sales and property tax: Northern Ontario Energy Credit, Ontario Energy and Property Tax Credit, Ontario Sales Tax Credit.  Beneficiaries need to be eligible for at least one of the three credits to receive the benefit.

(This blog is of a general nature about financial discrimination of individuals/singles.  It is not intended to provide personal or financial advice.)

CONSERVATIVE REGRESSIVE PENSION INCOME SPLITTING GOLDMINE FOR WEALTHY MARRIED PERSONS

CONSERVATIVE REGRESSIVE PENSION INCOME SPLITTING GOLDMINE FOR WEALTHY MARRIED PERSONS

(These thoughts are purely the blunt, no nonsense personal opinions of the author about financial fairness and discrimination and are not intended to provide personal or financial advice.)

Regressive tax expenditures cannot be blamed on just one political party, however, some implemented by Conservatives are the most egregious of all.

The Canadian Centre for Policy Alternatives (CCPA) “Out of the shadows” (policyalternatives)is a must read for all taxpayers.  It examines benefits distribution from 64 of Canada’s personal (business not included) income tax expenditures and provides egregious and shocking facts on how wealthy minority benefit the most.  Only five were considered to be progressive. Remaining 59 regressive expenditures cost $100.5 billion in 2011 while providing more benefit to those above the median individual income level (based on CCPA individual income, not combined couple income, of $30,000 or $15/hr. wage based on 2000 worked hours) and in some cases benefit top decile of wealthy the most.  The monies doled out in these expenditures equals same amount of all monies collected in taxes.

Stephen Harper, former Canadian Conservative Prime Minister, introduced the hastily and poorly planned regressive pension income splitting (P.I.S.) partly as appeasement for the controversial crackdown on income trusts (another regressive tax expenditure).

Fact Check:  First, married seniors, who have never had children, using P.I.S. pay less taxes just because they are married even though it costs singles more to live (Market Basket Measure – MBM).  Second, married seniors with equal incomes cannot use P.I.S. and, therefore, pay more taxes.  Third, poor married seniors benefit less as they have less income to split.  Fourth, senior singles and lone parents cannot use P.I.S., ever.  So, the wealthy married benefit most (?including Stephen Harper worth $7million when he becomes a senior). Exactly how many Canadian taxpayer households are completely left out of this formula?  – Certainly more than 50% or the majority. Just speak the truth, it is impossible for singles and low income seniors to achieve financial equality with this regressive tax expenditure.

Compounding effect of regressive expenditures ensures wealthy become even wealthier. Tax savings from P.I.S.means full contributions can be dumped into Tax Free Savings Accounts (TFSA) (another regressive tax expenditure implemented by Stephen Harper where maximum contributions now total $11,000 per year for married households).  Wealth ripple becomes ever wider because investments earned from TFSA contributions without capping of individual limits are never taxed.

CCPA states P.I.S. is the most regressive tax expenditure costing government $975 million annually – that is almost $1 billion a year.  Eighty-three per cent (83%) of benefit goes to top 10% and maxes out at $11,700 (equivalent to $6/hr. wage) when $128,800 (equivalent to $64/hr. wage) of pension income is transferred from higher earner to spouse with no income (10 times the maximum benefit to Canada’s poorest from only five progressive tax expenditures).

Over ten years the P.I.S. amount to wealthy married people could total almost $120,000.  It is not possible to calculate the wealth achieved from TFSA investments. And, it is apparent that there is no shame on the part of the wealthy that they are robbing from the poor to pay themselves.  Singles and poor seniors deserve to feel righteously angered at the gross financial discrimination of this formula.

CCPA states that from an aggregate perspective $103 billion lost annually to 64 tax expenditures is an embarrassing failure of Canadian tax policy.  Many of those in poorest deciles are singles and lone parents.

When critical thinking brings sunlight to financial discrimination and selective socialistic (Conservative) financial privileging for the wealthy, it also demands financial discrimination be changed or eliminated.  Taxpayers need to educate themselves on how they are impacted by these expenditures and contact their government officials demanding change. Although Federal Liberals have successfully eliminated some regressive tax expenditures, so far, they have refused to eliminate P.I.S. Transferral of P.I.S. tax expenditures to increased OAS and GIS based on MBM and net worth and assets would ensure greater financial fairness for all Canadian seniors.

P.I.S. has been submitted to the Canadian Human Rights Commission for adjudication of financial discrimination based on marital status and income levels and once again to the Liberals for elimination.

CONCLUSION

Canada is supposed a democratic country where fairness prevails at all levels including financial.  Why aren’t regressive tax expenditures such as stock option reduction, dividend gross-up and tax credit, and partial inclusion of capital gains for the wealthy enough that we have to introduce further regressive tax expenditures such as pension income splitting, income splitting, and Tax Free Savings Accounts which again benefit wealthy the most?

Plutocratic capitalism, as discussed by many authors including Thomas Piketty, is no different than other egregious philosophies such as communism, dictatorships, far right and far left idealism which all eventually rob the poor to pay the wealthy.  Balanced social justice is the answer to plutocratic capitalism and far right and left ideologies.

Thomas Piketty quotes (quotes):

  • When the rate of return on capital exceeds the rate of growth of output and income, as it did in the nineteenth century and seems quite likely to do again in the twenty-first, capitalism automatically generates arbitrary and unsustainable inequalities that radically undermine the meritocratic values on which democratic societies are based.
  • It’s important to realize that innovation and growth in itself are not sufficient to moderate inequality of wealth.
  • We want capitalism and market forces to be the slave of democracy rather than the opposite.
  • When inequality gets to an extreme, it is completely useless for growth.
  • No hypocrisy is too great when economic and financial elites are obliged to defend their interest.
  • I don’t think there is any serious evidence that we need to be paying people more than 100 times the average wage in order to get high-performing managers.
  • What was the good of industrial development, what was the good of all the technological innovations, toil, and population movements if, after half a century of industrial growth, the condition of the masses was still just as miserable as before, and all lawmakers could do was prohibit factory labor by children under the age of eight?

(Addendum:  A study of Stephen Harper profile, former Canadian Prime Minister, shows that he claims to be an economist with only a Master’s Degree, a Christian whose right wing financial philosophy appears to be to increase the wealth of the rich, and a family man styled after the 1950’s “Leave It To Beaver”, but never includes singles in the family definition.  It seems one of his goals is to increase capital returns over wages by implementing formulas that benefit wealthy the most since they are the population who have the most capital.

After implementing Pension Income Splitting, he also introduced income splitting for families, another regressive tax expenditure benefiting the wealthy, but this was rejected by the Liberal Party who came into power shortly after.

During his tenure as Prime Minister he often introduced huge omnibus bills to hide controversial bills. His actions over time negatively affected environmental laws, cut health care funding, reduced number of food inspectors jobs, made it harder to qualify for EI benefits, and disallowed scientists to speak freely about their research, this is by no means an inclusive list.  It should be stated that omnibus bills have also been submitted by other political parties. Harper also prorogued Parliament four times for a total of 181 days when he feared he would lose a confidence vote or didn’t want to deal with controversial issues.)

(This blog is of a general nature about financial discrimination of individuals/singles.  It is not intended to provide personal or financial advice.)

REGRESSIVE TAX EXPENDITURE MISCONCEPTIONS INCLUDING GOVERNMENT DIVIDEND CHEQUES

REGRESSIVE TAX EXPENDITURE MISCONCEPTIONS INCLUDING GOVERNMENT DIVIDEND CHEQUES

(These thoughts are purely the blunt, no nonsense personal opinions of the author about financial fairness and discrimination and are not intended to provide personal or financial advice.)

This opinion letter was originally submitted in abbreviated format to a local newspaper in response to a reader opinion letter.  It emphasizes the bizarreness of Conservatives who don’t see Alaskan natural resources dividends as being equivalent to a basic income program, view dividend cheques to be a right, not a privilege (while touting individual responsibility), and have no problem with receiving these monies even for children who haven’t worked for it or paid taxes.

The blog post ‘Money Benefit Programs Financially Benefit Married/coupled Persons and Families More Than Singles’ highlighting Alaska Permanent Fund Dividends was originally published several years ago and has been reproduced in its entirety at the end of this post.

RE:  READER OPINION LETTER ON ALASKA PERMANENT FUND DIVIDEND (PFD)

(Alaskan dividend program was established by the Republican (conservative) party in 1976.  From 1996 to 2015, the benefits have ranged from a low of $846 to a high of $2,072 annually.  For a family of four the twenty year total amounts to $113,156, and for a single person household the amount is $28,289.  A lot more can be done with $113,000 than $28,000. And, all is not as rosy as it seems. Alaska also has concerns about excessive government spending (pfd-effect).  For the third straight year, dividends would be more than $1,000 less than they would be under the previous formula written into state law).

The reader opinion letter, while stating Klein and related Conservative ilk took money out of voter pockets, also implies that it is better that every Alaskan man, woman, and child has received $43,000 in annual dividend cheques since 1982 – 2017 amount was $1,100. Single person household would have received $1,100, lone parent with child or married with no children $2,200, two adults, one child $3,300 and two adults, two children $4,400. You figure out what each household would have received over twenty years during lifecycle of rearing children.

The same truth applies to Klein $400 bucks. A family with eight children received $4,000 while single person received $400 (this is a true story).

Why is it that Conservative families are always in the business of making more money for themselves, but tout individual responsibility?  Why should children, like a one day old infant receive dividends when they haven’t paid any taxes or contributed to getting those resources out of the ground?  Instead, they are consuming resources such as education without contributing to them by paying taxes.

It doesn’t matter whether it is dividend cheques, Klein ‘bucks’ or natural disaster relief funds (fire-disaster-assistance).  When children are treated financially equal to adults, single adults will always be the losers even when they have worked more than forty years, not used EI or maternity/paternity benefits, paid education taxes when they have no children, etc. Families with children are receiving government transfers that singles don’t receive.

Financial fairness for all Canadians, regardless of marital or child status, will only be achieved when Market Basket Measure and net worth and assets are included in financial formulas.  The Canada Child Benefit is financially fairer than natural resource dividends (good thing for lone parents and poor families).  The Market Basket Measure cost of living scale counts an unattached individual as 1.0, and adds 0.4 for the second person (regardless of age), 0.4 for additional adults, and 0.3 for additional children.  The addition of an adult or child to household does not double or triple the cost of living, but adds smaller percentage to it.

It is time for politicians, married persons and families to stop the financial cherry picking and gaslighting.  Instead of spreading half truths it is time to develop fair financial formulas based on MBM and net worth irrespective of what political party person belongs to.

ANALYSIS OF REGRESSIVE TAX EXPENDITURES SUCH AS DIVIDEND CHEQUES

Critical common sense thinking highlights the fallacies of Conservative thinking which they, themselves, cannot see.

  • Conservatives don’t see Alaskan dividends as equivalent to basic income programs and they don’t see this as equivalent to socialist programs.  Doug Ford, since coming into power as Ontario Conservative Premier, has broken his promise by deleting the basic income pilot program authored by the outgoing Liberal Party. Alaskan dividends are as socialiastic as any basic income program.

Karl Widerquist and Michael W. Howard on Alaskan dividends (see blog article below) state:  ‘It provides a model of cash transfers to individuals without any stigma of dependence, fraud, waste, or failure—attributes often attached recipients of other government cash transfers.  The PFD funding source in natural resources rather than in taxes on individual income or wealth seems to exempt its recipients from any need to justify their use of the dividend, and to exempt the transfer as a whole from the ‘socialist’ label….’

  • Alaskan dividends are paid irrespective of any income from other sources and does not require the performance of work or the willingness to accept a job if offered. Unlike social assistance programs, it is not means-tested. Surely, this should rile up Conservatives who continually talk about personal responsibility and denigrate the poor as being lazy.  Conservatives never want to raise the minimum wage.
  • Conservatives just don’t get that Alaskan dividends are a regressive tax expenditure. Karl Widerquist and Michael W. Howard state:   ‘the PFD together with the elimination of the state individual income tax that was part of its founding has an overall regressive effect on income distribution.  To have a significant redistributive effect, the PFD would have to be recouped from wealthy individuals; in the absence of a progressive state income, consumption, or wealth tax, the PFD would have to be distributed on a sliding scale with larger dividends given to those with less income from other sources, rather than as a uniform flat payment….’
  • Alaskan dividends are paid out to individuals rather than households.  Payouts based on Market Basket Measure (MBM) or OECD Equivalence scales (equivalence-scales) would be financially fairer and would spread monies over a longer period of time.
  • What about those states or provinces that do not have natural resources? How do they handle progressive versus regressive tax expenditure?  The answer is through taxes and social justice programs.
  • It has been argued that it is preferable to have dividends from natural resources be distributed broadly rather than end up in the pockets of only a few corporate executives, wealthy shareholders, and political cronies. However, dividends distributed without marital status, number of children, income and net worth and assets consideration still means there will be an uneven distribution of dividends benefiting wealthy the most.

REPRODUCTION OF PREVIOUS BLOG POST

http://www.financialfairnessforsingles.ca/singles/2016/03/07/money-benefit-programs-financially-benefit-marriedcoupled-persons-and-families-more-than-singles/

MONEY BENEFIT PROGRAMS FINANCIALLY  BENEFIT MARRIED/COUPLED PERSONS AND FAMILIES MORE THAN SINGLES

Married/coupled persons and families often receive ‘free money’ benefits that financially benefit them much more than singles.

Two very good examples of these benefits are the Alaska Permanent Fund Dividend and the ‘Ralph Klein $400 Bucks’ Program.

Alaska Permanent Fund Dividends

The Alaska Permanent Fund Dividend (PFD) program implemented in 1982 is an annual payment paid to individuals (children as well as adults) rather than households.  It is paid irrespective of any income from other sources and does not require the performance of work or the willingness to accept a job if offered. Unlike social assistance programs, it is not means-tested.

The book “Alaska’s Permanent Fund Dividend:  Examining Its Suitability as a Model”, edited by Karl Widerquist and Michael W. Howard states the following:

‘…..In 2008, when the PFD reached its highest level at $2,069, the individual  poverty threshold in the United States was approximately $11,000; for a family of four it was approximately $22,000.  Thus, at its highest level, the PFD would have provided less than 20 percent of the income necessary for an to individual to reach the poverty threshold, but almost 40 percent of the income necessary for a family of four to reach the poverty threshold……Thus, on basis of its level alone, the PFD is at best a partial basic income…

Finally, because of its flat and universal nature, the PFD on its own makes a very modest contribution to the reduction of inequality.  But the PFD together with the elimination of the state individual income tax that was part of its founding has an overall regressive effect on income distribution.  To have a significant redistributive effect, the PFD would have to be recouped from wealthy individuals; in the absence of a progressive state income, consumption, or wealth tax, the PFD would have to be distributed on a sliding scale with larger dividends given to those with less income from other sources, rather than as a uniform flat payment….

The PFD does serve as an excellent model for the conceptualization of natural resources as commonly owned—an important step along the path to acceptance of the idea of a basic income.  It provides a model of cash transfers to individuals without any stigma of dependence, fraud, waste, or failure—attributes often attached recipients of other government cash transfers. The PFD’s funding source in natural resources rather than in taxes on individual income or wealth seems to exempt it recipients from any need to justify their use of the dividend, and to exempt the transfer as a whole from the ‘socialist’ label….’

It has been argued that it is preferable to have oil profits distributed broadly rather than end up in the pockets of only a few corporate executives, wealthy shareholders, and political cronies.

Alaska is the only state that does not collect sales tax or levy an individual income tax on any type of of personal income, either earned or unearned.  Every Alaskan, children as well as adults, receives a payment each year from the Alaska Permanent Fund Corporation. The USA does not have child benefits, although there is a child tax credit system for parents or guardians of children under 17 who meet certain requirements.  (The PFD is taxable by the Federal government).

Further review of information shows that in 2002, the poorest 20% of Alaskans relied on their dividend for 25% of their total income….some Alaskans depend on their dividend for up to a quarter of their yearly income, especially Native Alaskans, who make up 15% of the population. Those in poverty brackets and many of those living a subsistence lifestyle cannot afford to lose the dividend as a source of income.

However, review of articles on this program also states that the sense of entitlement has been established where it is very difficult to reduce state spending in this particular benefit at the expense of politicians losing their jobs, because state residents view these dividends as ‘rights’, not ‘privileges’.

One could argue that monies are being given to children who have not earned that privilege.  They have earned no money and have not paid any taxes.

If one looks at the PFD contributions over a twenty year period (lifetime of a family with children) in comparison to singles /individuals, the financial unfairness becomes apparent very quickly.  From 1996 to 2015,the benefits have ranged from a low of $846 to a high of $2,072 annually. For a family of four the twenty year total amounts to $113,156 and for a single person household the amount is $28,289.  A lot more can be done with $113,000 than $28,000.

Prosperity Bonus (‘Ralph Klein $400 Bucks’) Program

The Prosperity Bonus, also nicknamed Ralph (Premier of Alberta at that time) bucks, announced in September 2005, was the name given to a program designed to pay money back to residents of the province of Alberta as a result of a massive oil-fuelled provincial budget surplus.  This program gave $400 to every citizen of Albertan in the year 2005.

For a family of four, the benefit was $1,600, while a single/individual received $400.

ANALYSIS

‘Free Money’ Benefits allow families to achieve greater wealth than singles/individuals even though the children of these families have not earned any income or paid any taxes. Married/coupled persons without children also achieve greater financial benefits because of accumulated assets times two.

SOLUTIONS

To achieve greater financial equality between singles/individuals and married/coupled persons and families, the following suggestions are submitted:

  • Eliminate children from these programs until they reach the age majority since they have not made any contributions to the coffers in the form of salaries or taxes; rather, they are using resources such as education instead of contributing to them.
  • Top up benefits to singles at rate of 1.4 Market Basket Measure to that of married/coupled persons as it costs more for singles to live than married/coupled persons living as a single unit.

(This blog is of a general nature about financial discrimination of individuals/singles.  It is not intended to provide personal or financial advice.)

REGRESSIVE TAX EXPENDITURES FINANCIALLY DISCRIMINATE AGAINST SINGLES AND POOR FAMILIES

REGRESSIVE TAX EXPENDITURES FINANCIALLY DISCRIMINATE AGAINST SINGLES AND POOR FAMILIES

(These thoughts are purely the blunt, no nonsense personal opinions of the author about financial fairness and discrimination and are not intended to provide personal or financial advice.)

This purpose of this blog has been to highlight the gross financial discrimination singles and poor families face in this country.  However, many including governments, families and married persons fail to understand or choose to ignore the real financial truth. The discovery of information on regressive tax expenditures has provided an “OMG moment” because it supports what we have been saying since the beginning of this blog.  It provides solid information that poverty is not a figment of the imagination and is not created by the poor. Instead, wealth has been purposefully created for the top 50% of Canadians by government policies, especially regressive tax expenditures.

Blog article discussion on “Out of the Shadows” appears at beginning of article. Reproduction of “Will federal tax review lay the groundwork for real tax reform in the next budget?” appears at the end of this article.

PRELUDE

The Canadian Centre for Policy Alternatives (CCPA) “Out of the shadows” (loopholes) report published December, 2016 ‘examines the distribution of benefits from Canada’s 64 personal income tax expenditures where data is available, ranking them from least to most progressive.  A tax measure can be said to be relatively progressive if more than half its benefits go to the lower half of income earners. Likewise, a tax measure is regressive if most benefits go to Canada’s higher-income earners’.  (It should be noted that the 64 expenditures by no means covers all of the possible expenditures as evidenced by those not reviewed that are listed in Appendix II Excluded Tax Expenditures).

EXECUTIVE SUMMARY -Excerpts from CCPA report pages 5 – 7

ONLY 5 OF THE 64 EXPENDITURES ARE PROGRESSIVE

Only five –  the working income tax benefit (only one—the Working Income Tax Benefit—exclusively supports Canada’s working poor), non-taxation of the guaranteed income supplement, non-taxation of social assistance, the refundable medical expense deduction, and the disability tax credit can be described as relatively progressive, with a maximum benefit of $1,100 or less.

THE REMAINING 59 EXPENDITURES ARE REGRESSIVE AND COST $100.5B IN 2011

The remaining 59 regressive tax expenditures cost the federal government $100.5 billion in 2011 while providing more benefit to those above the median individual income level.

FIVE MOST REGRESSIVE TAX EXPENDITURES PROVIDE 99% BENEFITS TO TOP HALF

The five most regressive tax expenditures provide 99% or more of their benefit to the upper half of income earners. These tax expenditures pension income splitting, dividend gross-up, stock option deduction, credit for partial inclusion of capital gains, and foreign tax credit cost the government between $740 million and $4.1 billion each per year, totalling $10.4 billion in 2011. Four of these five tax expenditures have no maximum individual value, while pension income splitting where 83% of the benefit goes to the top income decile maxes out at $11,700 per person. That is 10 times the maximum benefit to Canada’s poorest from the five progressive tax expenditures.   If those loopholes were closed, the federal government could use that money to eliminate university tuition and create an affordable national child care program.

IN 2011 TAX EXPENDITURES COST ROUGHLY AS MUCH AS ALL INCOME TAXES COLLECTED

In total, personal income tax expenditures cost $103 billion in 2011, which is roughly as much as all income taxes collected that year ($121 billion). It is also not much less than what the federal government spends annually to pay for the Canada Pension Plan, employment insurance, the GST credit, the universal child care benefit, the Canada child tax benefit and the national child benefit supplement combined ($113 billion).

TWO TAX SYSTEMS, SHADOW SYSTEM FOR THE RICH, THE OTHER FOR POOR AND MIDDLE CLASS

Existing tax expenditures, on the other hand, provide on average a $15,000-per-person benefit to the richest Canadians. By comparison Canada’s poorest Canadians receive only $130 from tax expenditures and $1,130 from all federal income transfers.  In essence there are two federal transfers systems in Canada: one for the poor and middle class, and another shadow transfer system for the rich. Each system transfers roughly the same amount of money.

RECOMMENDATIONS RE MODEST STEPS TO ELIMINATING MOST REGRESSIVE AND EXPENSIVE TAX EXPENDITURES

  1. The annual tax expenditures report from Finance Canada should include the distribution of tax expenditures across the income spectrum.
  2. Tax expenditures should be included explicitly as costs in federal government financial reporting, including the main estimates, federal budget and fiscal updates.
  3. The federal government should target annual savings in tax expenditures of 5% (worth $5.1 billion a year) through the closure, capping or phasing-out of the most regressive loopholes.  This would take 20 years for total elimination.
  4. Policy-makers should continue to examine tax expenditures through a broad income inequality or vertical equity lens, and to consider the totality of these expenditures as a grossly unfair shadow transfer system for Canada’s richest tax filers.

REPORTING OF EXPENDITURES AND TRANSFERS OCCUR UNEQUALLY

(Page 9) Reporting of expenditures versus transfers – …. Moreover, while the cost of tax expenditures are individually estimated, they are not evaluated in the aggregate or compared to other large federal expenditures like federal income transfers. The latter are updated regularly and incorporated into public documents like the federal budget, main estimates and fiscal updates. Tax expenditures, on the other hand, are relegated to federal tax expenditure and evaluation reports that are published separately and frequently overlooked.

ASSESSING PROGRESSIVITY VERSUS REGRESSIVITY

(Page 10)  Progressivity versus regressivity-…..While it may be tempting to think of one set as progressive and the other regressive based on the types of activities they target, this is not how tax systems are generally judged. Assessing Canada’s tax expenditures through a vertical equity lens allows us to precisely determine what income groups benefit the most.

NET WORTH AND ASSETS LEFT OUT OF ANALYSIS

(Page 11) Report readily admits that ranking scheme focuses exclusively on current annual income and ignores other potential measures of progressivity that one might consider, such as measures based on wealth or lifetime earnings.

Blog author’s comment:

In this blog we have commented many times on how tax expenditures are handed out to the wealthy when they don’t need it because their net worth and assets have not been taken into consideration in financial formulas.

TAX EXPENDITURES PERCENTAGE OF BENEFITS TO BOTTOM HALF

(Page 12) Table 1  shows 2011 Tax Expenditures Cost, Distribution and Progressivity and % of the 64 benefits to bottom half.  (The percentage of each individual expenditure is generally below 30% to the bottom half.)

FIVE MOST PROGRESSIVE (VERTICALLY EQUITABLE) TAX EXPENDITURES

(Page 15-17) Only five of Canada’s 64 expenditures are more beneficial for lower-income earners and therefore more positive in terms of correcting income inequalities. These are the working tax credit, non-taxation of the GIS and spousal allowance, refundable medical expenses, non-taxation of social assistance benefits and disability tax credit…..These five most progressive tax expenditures have a few things in common. First, there is either an explicit maximum individual benefit or the value is based on another program that itself is capped…..Second, the maximum benefit is paid out in the lower half of the income spectrum and tapers out afterwards…..Finally, three of the five tax expenditures are related to seniors, including the non-taxation of GIS benefits, the disability tax credit and the refundable medical expenses supplement…..

Blog author’s comment:

This is the way assistance for low income Canadians should work, thus promoting financial fairness for all  Canadians.

FIVE MOST REGRESSIVE (VERTICALLY INEQUITABLE) TAX EXPENDITURES

(Page 18) ….The vast majority provide more benefit to the richest half of Canadians. To narrow it down to five (dividend gross-up and tax credit, partial inclusion of capital gains, foreign tax credit for individuals, employee stock option deduction, and pension income splitting), those tax expenditures providing 99% of their benefit to the highest-earning Canadians are isolated (14 of 64 expenditures) then sorted by cost.  The first thing that stands out in Figure 2 is the marked difference in distributional impact of Canada’s regressive and progressive tax expenditures. The benefits of the former (regressive) are clearly concentrated in the richest decile, with little or no benefit leaking down even to Canada’s middle-income earners and absolutely nothing for the poorest Canadians. In the latter (progressive) category, benefits generally peaked in the third or fourth deciles, but they also spread beyond this zone, frequently also into the upper deciles.

PENSION SPLITTING MOST REGRESSIVE TAX EXPENDITURE

(Page 18-19) The most regressive tax expenditure, which comes with a cost to government of $975 million annually, is pension income splitting. This tax measure allows a couple to shift up to half the pension income of the higher-earning spouse to the lower earner at tax time. The lower-earning spouse would still pay tax on the amount transferred, but at a lower marginal rate.  (Figure 4) This transfer effect is why the distribution shows negative bars in deciles four through seven: lower earners will pay higher taxes as pension income is transferred, but presumably net family taxes will be lower.

Benefits from pension income splitting are concentrated at the very top, with 83% of the value of the expenditure going to the richest decile. In contrast with the other most regressive tax expenditures, there is maximum benefit to this tax expenditure of $11,675 when $128,800 of pension income is transferred from a higher earner to a spouse with no income. While capped, this maximum benefit is 10 times more generous than any of the five most progressive tax expenditures.

Blog author’s comment:

Re pension splitting zero per cent (0%) of senior single person households and equal income married or coupled partners receive any monies from this expenditure.  Poor families (bottom half) receive virtually no benefit because they have less income to split than the wealthy.

DIVIDEND GROSS-UP, STOCK OPTION DEDUCTIONS AND PARTIAL INCLUSION OF CAPITAL GAINS

(Page 19-21) There are commonalities among these regressive loopholes whose benefit is most concentrated among the richest half of Canadians. For one thing, three of the five regressive expenditures are related to capital ownership; that is to say, to the ownership, purchase and sale of stocks, real estate, businesses and the like. This is not an activity most Canadians take part in, let alone have to worry about at tax time. Second, four of the five tax expenditures have no maximum value and the fifth has a very high maximum. This also has the effect of concentrating benefits among those with more money to spend.

Blog author’s comment:

These three tax loopholes are available only to the wealthiest Canadians because they are the the only ones with the means to partake of these loopholes.  When the wealthiest Canadians have these three tax loopholes why do they need even more loopholes? Article “Will federal tax review lay the groundwork for real tax reform in the next budget?” at the end of this blog post provides a very good comment on what could be done to reduce these tax loopholes.

Dividend gross-up and tax credit

(Page 24) The fifth most expensive tax expenditure is the dividend gross-up and tax credit, which cost $4.1 billion in 2011. As discussed above, the credit is also among the top five most regressive expenditures, with 92% of the benefits going to the richest decile.

(Page 25) In another comparison, recovering three-quarters of what is lost to the dividend gross-up each year could eliminate tuition for undergraduate university students, or it could halve the cost of long-term care for aging Canadians.  Tax expenditures are the same as any other real government spending: they are a fiscal choice governments make and can unmake if they want to. The money that today goes to padding the incomes of Canada’s rich could tomorrow go to eliminating poverty and reducing income inequality.

(Page 20) This tax expenditure gives shareholders of Canadian firms receiving a dividend a credit for what the corporation already paid on its profits, so that those profits are not “double taxed.”…..Seen in this light, Canada’s tax expenditure for corporate dividends looks very much like special treatment for the already very wealthy.  The dividend gross-up has no maximum value, as it is related to the amount of Canadian eligible dividends paid to any individual.

Blog author’s comment:

Re:    Good discussion on “Big 3” regressive tax expenditures (dividend gross-up, stock option deduction and credit for partial inclusion of capital gains) that overwhelmingly benefit rich Canadians is given in article “Will federal tax review lay the groundwork for real tax reform in the next budget?” shown at the end of this blog post.  (These expenditures alone cost a combined $12 billion annually – more than enough to pay for, say, a national pharmacare program).

FIVE COSTLIEST TAX EXPENDITURES

(Page 22-25) Though they may not be the most regressive, based on the criteria established above, it is worth commenting on how all five of the most costly personal tax expenditures (Credit for the Basic Personal Amount, net Registered Pension Plan or RRP expenditure, net Registered Retirement Savings Plan or RRSP expenditure, non-taxation of Capital Gains on Principal Residences, and Dividend Gross-up and Tax Credit) still provide far higher benefits to those in the upper income deciles than those in the lower half of Canadian income earners (see Figure 3).

At the top of this list is the basic personal amount all Canadians can claim as tax-free income on their tax forms ($10,527 in 2011). This tax expenditure costs an incredible $29 billion a year. To put that number in perspective, roughly a quarter of every tax dollar collected in 2011 was returned through the basic personal amount.  This tax expenditure is roughly equivalent to having an additional tax bracket under $10,527 at 0%, despite the fact that the other tax brackets are not considered tax expenditures. That being said, changing the basic personal exemption would have major implications. Besides being the most expensive, this tax expenditure is the most evenly distributed, at least in this category, with a third of the benefit going to the bottom half of Canadians. The maximum benefit in 2011 was $1,579, accessible to everyone who paid income tax, and received by virtually everyone in the fifth decile and above. The universal application of this tax expenditure to all taxpayers, particularly in the top half of the income distribution, is the reason it is so expensive.

The second and third most expensive tax expenditures are the registered pension plans (RPP) and the registered retirement savings plans (RRSP), which cost the government $16 billion and $9 billion a year respectively. The benefits of these tax expenditures are slightly more concentrated among Canada’s highest-income earners, who receive 57% of the benefit from RPPs and 63% of the benefit from RRSPs, and in both cases there is little benefit outside of the top three deciles.

(The complete discussion of RPP and RRSPs in the report has not been included here).….It is often difficult to contextualize the opportunity costs of spending billions of dollars on a tax expenditure. For comparison’s sake, the combined net loss from the RRSP and RPP tax preferences is $26 billion a year. This is three times the $9 billion spent on the GIS and spousal allowance, which are dedicated to reducing poverty among low-income seniors.  By spending only a third of the government revenues lost to RRSP and RPPs every year we could eliminate seniors’ poverty in Canada.

To evaluate the effectiveness of this tax-shifting strategy, Figure 4 shows the distribution of benefits for contributors compared to the distribution of RRSP withdrawals. Assuming that contribution and withdrawal trends continue in terms of percentage benefit, and not in terms of aggregate amounts, it is clear the richest decile will benefit the most. The richest decile sees 57% of the benefits from contributions, but only pays back 31% of the tax on withdrawals. RPPs have a slightly worse distribution, with the top two deciles seeing a net lifetime benefit. Even on a lifetime basis, instead of a cash-flow basis, the top decile sees the most benefit given current trends.

The fourth most expensive tax expenditure, non-taxation of capital gains on a principle residence, cost the government $4.7 billion in 2011. This tax expenditure is of very little use to the bottom half of the population, which sees 10% of the benefits.

The fifth most expensive tax expenditure is the dividend gross-up and tax credit, which cost $4.1 billion in 2011. As discussed above, the credit is also among the top five most regressive expenditures, with 92% of the benefits going to the richest decile.

…..Tax expenditures are the same as any other real government spending: they are a fiscal choice governments make and can unmake if they want to. The money that today goes to padding the incomes of Canada’s rich could tomorrow go to eliminating poverty and reducing income inequality.

TAX EXPENDITURES SHOULD BE TREATED AS A SYSTEM

(Page 26 – 28) 26 Beyond ComparIng Canada’s individual tax expenditures for their progressivity or regressivity, we should be treating these tax expenditures as a system, as we might federal income transfers. In that case, we can apply the same equity lens to the tax expenditure system in the aggregate to determine if the totality of these measures increase or decrease income inequality in Canada.

Based on the analysis above, the answer should be clear: if 59 of Canada’s 64 tax expenditures are regressive (i.e., they benefit the upper half of income earners more than the lower half), we should expect the system as a whole to fail the equity test. In fact, the total cost of these regressive measures is astonishing….As such, only broad conclusions are drawn from the aggregation of tax expenditures. From a policy perspective, if raising money from closing tax expenditures is the goal, a piecemeal approach is unlikely to provide as much benefit as a more comprehensive tax policy reassessment…..

The standout conclusion we come to from aggregating all personal tax expenditures is that that system is very expensive, costing the government $103 billion a year. As shown in

Table 2, this is only slightly less than the $121 billion collected in federal personal income taxes in 2011. Think about that: almost every dollar collected in personal income taxes is immediately given back through tax expenditures. Put another way, if revenues currently forgone through personal income tax expenditures were collected, the federal government would roughly double the amount of money at its disposal for other priorities.

…..While both tax expenditures and traditional income transfers result in effective transfers and are of roughly the same aggregate cost, their distribution differs dramatically, as shown in Figure 5. Federal transfers peak in the fourth decile for those with incomes between $17,000 and $22,000. The average combined federal transfer is $8,400 a person, which is mostly made up of transfers from CPP and GIS/OAS.

Blog author’s comment:

This author has talked about tax loopholes being addressed only in a vertical fashion by governments and policy makers.  This has created financial silos (continued-financial-illiteracy) where impact of one loophole is not assessed in totality with other loopholes. However, loopholes are compounded on top of loopholes.  For, example wealthy get full OAS who then put this money into their Tax Free Savings Accounts (TFSA) and then don’t have to report investment income from TFSA as income.  Financial formulas should be assessed both on a vertical and a horizontal level. Add link on financial silos.

FEDERAL TAX TRANSFERS ARE SMALL FOR LARGEST COMPONENT OF SINGLES AND LONE PARENTS

(Page 28 – 29)  FEDERAL TRANSFERS are surprisingly small for the poorest deciles when you consider that most programs target the poorest and clawback transfer payments as incomes rise. There are two reasons for this. The first is that the distribution is based on individual and not family incomes (see Appendix I for more on this). So someone earning no income would fit in the poorest decile even if their spouse made a million dollars a year.

The second, more worrying reason is that many of those in the poorest deciles are either single parents or single adults. Almost all of the federal transfer money paid to the poorest two deciles is for child-related benefits and goes mostly to single-parent families where the parent is almost always a woman. For single adults, or adult couples without children who are not seniors, the only available federal transfer is the GST credit, which maxed out at $253 per person in 2011.

FEDERAL TRANSFERS peak in the fourth decile, but they are slightly skewed to richer Canadians as they provide benefits all the way to the top of the income spectrum.  In fact, those in the richest decile, with incomes over $84,000 a year, receive slightly more on average from federal transfers ($1,300) than the average person in the poorest decile ($1,200). This is entirely due to higher CPP payments to the top deciles. Those in the ninth decile, where incomes sit between $61,000 and $84,000 a year, receive on average $2,500 a person twice as much as those in the poorest decile.

TAX EXPENDITURES, on the other hand, have a dramatically different distribution, with benefits highly concentrated (39%) in the richest decile, where the average transfer is $15,000 a year. That amount is double the $8,400 those in the fourth decile receive in government transfers (largely to support low-income seniors). Put another way, tax expenditures provide 11 times more benefit to the richest people in Canada than government transfers do for the poorest (those making under $4,000 a year).

From an aggregate perspective, therefore, the $103 billion lost annually to tax expenditures is an embarrassing failure of Canadian tax policy. With the same amount of money the government could send an annual cheque of at least $21,800 to all Canadians, completely eliminating poverty.  The money spent on tax expenditures also has an opportunity cost: it means funds are not available for physical infrastructure or to improve social program, both of which have a much higher economic multiplier in driving economic growth.

Blog author’s comment:

This blog is based on highlighting the financial discrimination of singles (ever singles and divorced early in life persons).  The above segment is refreshing in that it supports what we have been saying over the past few years.

TWO EQUAL SYSTEMS OF EQUAL VALUE-TAX INCOME TRANSFERS SYSTEM FOR POOR AND MIDDLE CLASS AND TAX EXPENDITURE SYSTEM FOR THE RICH

(Page 30) In essence, we have in Canada two federal support programs of roughly equal value: income transfers for the poor and middle class, and tax expenditures for the rich. The first (federal transfers) benefits the lower-middle class the most, but spreads widely from the very poorest to the very richest. The second (tax expenditures) benefits mainly those at the top, a shadow transfer system for Canada’s rich.

CONCLUSION (Page 31)

The unequal dIstributIon of tax expenditures remains a critically under-examined problem in Canada, particularly given their enormous cost on par with both personal income taxes collected and total federal government transfers and contribution to income inequality. Given the sheer size of these tax expenditures, it is amazing they are not listed as government spending in federal budgets and fiscal updates.

For every dollar moved into one of Canada’s individual tax expenditures, an equivalent amount is foregone in federal revenues. Since there is no cap on many of the most expensive and most regressive tax expenditures, this arrangement skews benefits toward Canada’s richest, who are more likely to have extra money to put aside (for retirement, investments, etc.). Lifetime caps, as exist for the small business capital gains exemption, would help smooth out the distributional inequities in these expenditures and lower costs for government.

Tax expenditures individually are not purposeless. Sometimes they are meant to encourage behaviour, such as saving for retirement. Sometimes, as with the dividend gross-up, they are driven by concerns about equity (the “double taxation” of dividend income in this case), though almost always in the horizontal sense of treating similar people equally under the tax code.  The vertical inequity of this measure, 91% of whose benefits go to the richest 10% of Canadians, is totally ignored.

APPENDIX I – METHODOLOGY (Page 33-36)

(Reading this section in its entirety is worthwhile to understand how statistics were used to develop the report – the following is a brief excerpt from the report).

All values in this report are in 2011 dollars. All tax rates, tax expenditure values, transfers and any other values are as they were in 2011 unless otherwise stated….

All distributional analyses in this paper are conducted for individuals 18 and over based on total income before taxes but after transfers, not families. Examining individual distribution may overstate the concentration of people in the bottom deciles, as it will split up families where one spouse earns an income and the other does not. In a situation where the former takes home, say, $1 million annually, they would end up in the top decile while the latter is in the lowest decile in this distribution. This may tend to overstate the destitution of those in the lowest income deciles on an individual basis. However, taxes are evaluated on an individual basis and Canada Revenue Agency data, in particular, is only available on an individual basis. Future research could better examine the distribution of tax expenditures across the family income distribution in Canada…..

Third, economists are particularly concerned about richer tax filers attempting to avoid any tax changes, whether from marginal bracket rate increases or changes in tax expenditures. There is particular concern that wealthy Canadians will migrate, for instance to the U.S., in a “brain drain” response to higher Canadians tax rates. Natural experiments have shown a surprising lack of migration in response to higher top marginal tax rates…..

A more likely reaction to the closure of certain tax expenditures might be an increased use of related alternatives. For instance, if RRSP contributions were no longer tax deductible, wealthy Canadians might switch those contributions to TFSAs, where a tax preference still exists. This switching of moneys between tax expenditures may mean the total cost would not be recovered even if that tax expenditure were completely closed. The more tax expenditures that exist, the more choice there is as any one tax expenditure is closed. However, as fewer tax expenditures exist, the more likely it is that the closure of any additional tax expenditure will lead to the full cost of the tax expenditure being recovered. Behavioural reaction will tend to decrease the overall cost of tax expenditures. Neither the Finance Canada reporting on tax expenditures nor this report attempts to estimate the behavioural reaction to the closure of tax expenditures.

The final possibility for avoiding taxes, besides moving and switching tax expenditures, is simply to avoid them illegally. The solution here is more straightforward: hire more tax auditors to provide better enforcement of the rules that already exist. More disclosure and international co-operation of tax agencies is also critical in closing the potential for abuse in tax havens.

APPENDIX II EXCLUDED TAX EXPENDITURES (Page 41)

Table 4 details tax expenditures that are not analyzed in this report (approximately another 64). In general, these were excluded either because distributional data or else the estimated value of the expenditure were not available. A few expenditures were excluded for other reasons……Finally, as this report only focuses on expenditures related to personal income taxes, expenditures involving businesses were also excluded from the analysis (see the details in Table 4).

HIGHLIGHTING PROBLEMS OF MAXIMUM INDIVIDUAL VALUE RE TRANSFERS VERSUS EXPENDITURES

While income transfers are tightly controlled as to the maximum value a person can receive and who in the income spectrum receives them, many of the most regressive and expensive tax expenditures do not have a maximum individual value. (Page 15-17) There is either an explicit maximum individual benefit or the value is based on another program that itself is capped…..Second, the maximum benefit is paid out in the lower half of the income spectrum and tapers out afterwards.

(Page 18) The first thing that stands out in Figure 2 is the marked difference in distributional impact of Canada’s regressive and progressive tax expenditures. The benefits of the former (regressive) are clearly concentrated in the richest decile, with little or no benefit leaking down even to Canada’s middle-income earners and absolutely nothing for the poorest Canadians. In the latter (progressive) category, benefits generally peaked in the third or fourth deciles, but they also spread beyond this zone, frequently also into the upper deciles.

HOW INCOME IS REPORTED IN THE REPORT – (BLOG AUTHOR’S COMMENT)

A major shortfall of this report is using income deciles based only on individuals.

Information from page 33 states ‘All distributional analyses in this paper are conducted for individuals 18 and over based on total income before taxes but after transfers….. However, taxes are evaluated on an individual basis and Canada Revenue Agency data, in particular, is only available on an individual basis. Future research could better examine the distribution of tax expenditures across the family income distribution in Canada…..”

(Example: Figure 2, Page 19) For the CCPA report it appears income deciles are divided into nine deciles for income from $0 to $84,000 and tenth decile for incomes over $84,000.  The sixth decile shows values of $30-$38K, seventh percentile $38-$48K, eighth decile $48-$61K, ninth decile $61-$84K and tenth decile $84K+.

It is possible to obtain some information on income levels for single person and two or more person households from Statistics Canada – Upper income limit, income share and average income by economic family type and income decile (statcan).

In 2016, income single person household reported in constant dollars were total decile income $35,400, sixth decile $31,000, seventh decile $37,700, eighth decile $45,400, ninth decile $57,800 and highest decile $96,800.

In 2016. incomes for two or more person households reported in constant dollars were total deciles $89,600, sixth decile $84,300, seventh decile $97,400, eighth decile $113,600, ninth decile $137,400, and highest decile $211,600.

(Constant dollars refers to dollars of several years expressed in terms of their value (“purchasing power”) in a single year, called the base year income).

The CCPA report uses $84K+ as the dollar value for the tenth decile, whereas, Statistics Canada shows it not possible for single person households to achieve incomes of $84K+ for any of the deciles below and including the ninth decile.  Incomes of $84K+ for two or more person households can be achieved in the sixth decile.

Stated another way Statistics Canada (statcan.gc.ca/n1/daily-quotidien) states couples with children had a median after-tax income of $94,500 in 2016, up 5.6% from 2012. Lone-parent families had a median income of $44,600, while couples without children had a median after-tax income of $76,400. Unattached non-seniors had a median after-tax income of $30,400.

Vanier Institute, Modern Family finances published Jan., 2018 states individuals in Canada whose incomes were in the top 10% had a total median before ­tax income of approximately $93,700 in 2015 ($75,200 after taxes). This represented approximately  3.1 million Canadians in 2015.

The CCPA report states more work needs to done on separating incomes of single person households from two or more person households.  From page 28, a more worrying reason is that many of those in the poorest deciles are either single parents or single adults. Almost all of the federal transfer money paid to the poorest two deciles is for child-related benefits and goes mostly to single-parent families where the parent is almost always a woman. For single adults, or adult couples without children who are not seniors, the only available federal transfer is the GST credit, which maxed out at $253 per person in 2011.

Based on the above information on income deciles, more work needs to be done analyzing singles versus family incomes to achieve financial fairness for singles and lone parents.

FINAL COMMENTS BY BLOG AUTHOR

In 2011, 39% of the benefit of all tax loopholes went to the richest 10% while the bottom half of income earners only saw 16% of the benefit.

As stated on page 30, federal transfers benefit the lower-middle class the most, but spreads widely from the very poorest to the very richest. Tax expenditures benefit mainly those at the top, a shadow transfer system for Canada’s rich.

As stated on page 25 of the above report tax expenditures are the same as any other real government spending: they are a fiscal choice governments make and can unmake if they want to. The money that today goes to padding the incomes of Canada’s rich could tomorrow go to eliminating poverty and reducing income inequality.

Also, transfers are tightly controlled since there is a maximum value a person can receive and who receives them.  Many of the most regressive and expensive tax expenditures do not have a maximum individual value.

Examining tax expenditures by income inequality alone will not totally solve the inequality problem.  Net worth and assets as well as income needs to be included in financial formulas.

The financial inequality that exists between single person households and two or more person households and between poor and wealthy families needs to be addressed through inclusion of net worth and assets, Market Basket Measure and maximum individual value limits in financial formulas.  These should be included in an aggregate format, not on an individual basis to reduce distributional inequities.

Wealthy persons should not be receiving tax expenditure monies when they don’t need it.  Net worth and Assets added to financial formulas would help to ensure monies are distributed in a graduated format and gradually diminishing to zero for the wealthy.

Market Basket Measure (MBM) (gov.br) should also be used in financial formulas to ensure financial equality based on number of person in households so that marital status bias with and without children is excluded. It costs more for singles to live than two person households without children.  This scale counts an unattached individual as 1.0, and adds 0.4 for the second person (regardless of age), 0.4 for additional adults, and 0.3 for additional children.

Pension income splitting, a blatantly financial discriminatory program against single person households, was implemented in 2006 by the Conservatives, specifically Stephen Harper.  Market Basket Measure shows it costs singles more to live, so why was pension splitting given to married or coupled households and to be used by primarily wealthy couples?

Maximum individual value limits on tax expenditures gradually reduced to zero for the wealthy would ensure financial equality and fairness.  Tax Free Savings Accounts (TFSA) were introduced in 2008, again by Conservatives, namely Stephen Harper.  This has to be one of the most egregiously discriminatory programs against singles and the poor.  It is possible for the wealthy to have huge net worth and assets and low incomes excluding huge TFSA investment amounts which do not need to be declared as income.  They can then claim poverty and receive OSA without clawbacks, and even possibly the Guaranteed Income Supplement (GIS) which is supposed to be a poverty reduction program for the very poor.  Lifetime caps, as exist for some small business formulas, would help smooth out financial inequities between the poor and the wealthy and lower costs for government.

Many regressive tax expenditures have been implemented by Conservatives (some also by the Liberals).  The Conservatives always talk about cutting taxes, but never talk about balancing tax cuts with reduction of tax expenditures and benefits for the wealthy.

The Liberal Party to their credit has reduced or eliminated Tax Expenditures for both business and personal financial systems.  On the personal tax side they refused to implement Conservative proposal for personal income splitting and increasing TFSA contributions from $5,500 to $10,000 per person.  They have also eliminated Child Arts and Child Fitness Tax Credits. On the business tax side (businesses were not addressed in the CCPA report), the Liberals have addressed financial inequalities in income splitting (“sprinkling”) and passive income.

Business income splitting (“sprinkling”) allows some families to use private corporations to sprinkle income among family members to spouse and/or children who are often in lower tax brackets than the primary owner/manager and thus the family’s total tax bill would be reduced.

For example, one of the changes means beneficiaries of business income splitting have to be actively engaged in the business and work in the business at least an average of 20 hours per week.  Since singles in their financial circle are basically financially responsible to themselves (no spouse, no children), “income sprinkling’” is of no benefit to single marital status entrepreneurs so they will pay more tax.  Tax fairness needs to be ensured regardless of marital status and how income is earned.

In short, the new rules for passive income mean that once a private corporation builds up multi-million dollar passive investment assets, its business income will no longer qualify for the federal small business tax rate (which is being lowered to 9 per cent), and instead be taxed at the regular corporate tax rate (which is 15 per cent).   The amount of business income that qualifies for the small business tax rate would be reduced depending on how much annual passive income is declared above $50,000 — and eliminated completely once passive income rises above $150,000. 

Political parties concerned about social justice (Liberals and NDP) need to be more vocal about regressive tax expenditures and why changes are needed to promote income and tax equity.


https://canadafactcheck.ca/tax-fairness/ Excerpts from article “Will federal tax review lay the groundwork for real tax reform in the next budget?”.  Links have been removed, links may be reviewed in article online.

While little known to the general public, the review is of enormous importance. Every year, Ottawa spends about $110 billion on programs such as health transfers to the provinces, the Canada Pension Plan, Employment Insurance, and other line item programs that comprise the federal budget. These expenditures, as with all direct spending, are put before Parliament for examination. Through this “Estimates” process, information on the costs and impact of these programs is available to the public.

Far less visible and transparent is the roughly $100 billion the federal government forgoes annually in so-called “tax expenditures”. These exemptions, deductions, credits, rebates and surtaxes are not subjected to the same kinds of parliamentary accountability mechanisms that are applied to more direct government spending. Moreover, many of these expenditures (including all exemptions and deductions), while legally embodied in the federal tax code, have huge implications for the fiscal situation of the provinces in that they also define the tax “base” against which all personal and corporate income taxes are levied at the provincial level.

Given the sheer scale of these tax expenditures, there is a strong argument for subjecting this hidden tax spending to the same oversight and public debate as any other spending. This is especially true given just how regressive (i.e. favouring the affluent) many of these expenditures are. If the government wants to provide billions of dollars in tax breaks to the richest Canadians, it should have an obligation to justify these gifts to the vast majority of Canadians who don’t benefit from such largesse.

The last comprehensive evaluation of the federal tax system was the Carter Commission of 1966. It’s clearly time to take a top to bottom look at our tax system to see if it is the truly progressive system the public deserves.

Exactly who benefits from these tax expenditures?

While the true magnitude of federal tax expenditures remains somewhat murky, what we do know is cause for concern. For example, a recent report from the Canadian Centre for Policy Alternatives (CCPA) shows that, while some of these measures benefit the general population, many others benefit most those who need help the least. In fact, of the 64 tax breaks on which solid data are available, all but five provide more benefit to the top half of earners than to the bottom.

In particular, the three most regressive loopholes (the stock option deduction, the dividend gross-up, and the partial inclusion of capital gains), give enormous breaks to the very rich without doing much for the majority. According to the Department of Finance, these expenditures alone cost a combined $12 billion annually – more than enough to pay for, say, a national pharmacare program.

Here’s a brief look at the “Big 3” regressive tax expenditures that overwhelmingly benefit rich Canadians.

The stock option deduction is an offshoot of the 50% capital gains inclusion rate (see below) and cost the federal treasury $840 million in 2016. It is for employees who, as part of their compensation, are given the option to buy company stock at a set price (e.g., today’s price). If the stock rises in the future, an employee can still buy the stock at their set price, but sell it at the going price and generate a capital gain equal to the difference between the two prices. As with capital gains, only 50% of the price differ­ence from a stock option transaction of this sort is taxable, and there is no threshold above which the government taxes 100% of the capital gain.

Another regressive tax expenditure is the dividend gross-up and tax credit. With an annual cost to government of $4.64 billion in 2016, it is also one of the most expensive. This tax expenditure is extremely concen­trated, with 91% of the benefit going to income earners in the richest decile. But, again, the decile analysis actually understates the concentration. A paper by Brian Murphy, Mike Veall, and Michael Wolfson estimate half of all benefits actually go to the top 1%. Corpor­ations pay corporate income tax on their profits, which can be paid out as a dividend to shareholders.

A third extremely regressive tax expenditure is the partial inclusion of cap­ital gains which cost the government $6.68 billion in 2016. The tax expenditure for partial inclusion of capital gains applies to an in­dividual who buys a stock or other asset at one price and subsequently sells it for more, realizing a “capital gain” in the amount of the difference between the two prices. It is only the capital gain, and not the entire sale price, that is eligible for taxation. And thanks to this tax expenditure, only 50% of the value of that capital gain is considered taxable income.

With 92% of the benefits going to the top 10% — and very little for anyone earn­ing less than $84,000 — the concentration of benefits related to the partial inclusion of capital gains is similar to that for the dividend gross-up. However, additional analysis by Murphy et al. shows the concentration of this tax expenditure is much worse than a decile analysis suggests. In fact, the very richest 1% of tax filers reap 87% of the benefits.

Is there the political will to scale back capital gains related tax expenditures?

There is also a question as to whether the Trudeau government has the political will to really crack down on the most regressive expenditures given that there are powerful employer and financial interests supporting them.

For example, upon being installed as finance minister, Finance Minister Bill Morneau declared tax fairness his top priority. Yet his record on the issue is mixed. He at first vowed to close the loophole on executive stock options (a Liberal Platform item), perhaps the most objectionable such tax break, but then changed his mind under heavy industry pressure.

The challenge for Morneau is that the government has also promised to make Canada more innovative and attractive to investors. Some supporters of an innovation agenda argue that capital gains taxes hurt innovation by limiting the amount of money in the economy that is free to be re-invested in new projects. There are also numerous voices warning federal Liberals to rein in any proposed tax-the-rich agenda in light of plans by the Trump Administration and the Republican controlled Congress to dramatically reduce personal and business taxes.

On the other hand, policy experts who are concerned with income inequality see tightening up investment-related tax expenditures as a key target given that it is primarily higher-income Canadians who have the means to generate significant additional revenue from investments.

Do we really need regressive tax expenditures to spur innovation and growth?

The argument that tax related investment incentives are required to spur innovation and growth has many doubters – and not just amongst those concerned with inequality. These “pro-growth” critics of the exemptions argue that it is strategic government leadership and public investments that are most critical to building innovative economies. These critics also argue that what is needed it to build on the work being done by publicly funded bodies such as the National Research Council.

In support of this view, the influential UK economist Mariana Mazzucato has shown that publicly funded research as well as direct support for strategic corporate investments through agencies like Defense Advanced Research Projects Agency (DARPA), have been central to the growth of innovative capacity in the United States. Corporate research and development and venture capital often follow in the wake of ground-breaking public sector entrepreneurship.

Mazzucato’s book, The Entrepreneurial State: Debunking Public vs. Private Sector Myths, cites impressive evidence in support of this thesis. For example, the parts of the smartphone that make it smart—GPS, touch screens, the Internet—were advanced by the U. S. Defense Department. Tesla’s battery technologies and solar panels came out of a grant from the U.S. Department of Energy. Google’s search engine algorithm was boosted by a National Science Foundation innovation. Many innovative new drugs have come out of the U.S.’s National Institute for Health (NIH) research.

Many innovation experts agree that there is plenty of room to expand direct public investments to compensate for any scaling back of private capital gains incentives. These experts suggest that strategic long-term public investments need to be made across- a much broader range of sectors than is currently the case……

Where does pension fund investment fit in? See article for details.

What are the options for real tax reform?

It goes without saying that there are many options on a continuum somewhere between getting rid of the Big 3 exemptions entirely (an extremely unlikely scenario regardless of which party forms the government) and maintaining a status quo in which the rich get almost all the benefits.

…..focus on practical measures that could scale back the stock option and partial capital gains exemption.  With regard to the stock option deduction, the Department of Finance estimates that 8,000 high-income Canadians deduct an average of $400,000 from their taxable incomes via stock options. This accounts for 75% of the deduction’s fiscal impact, which was $840-million in 2016. Most of these 8,000 high-income earners have stock options built into their compensation packages and take advantage of these stock option provisions on a reoccurring basis. Needless to say, only a minority of those who exercise stock options in this manner are employed by a start-up – the ostensible reason for allowing stock options in the first place.  There are a number of approaches to stock option deductions that would let the federal government reduce the extreme regressiveness of the deduction, while not penalizing Canada’s startup community.

One approach would be for the federal government to provide a one-time only $750,000 exemption on stock options. This would treat stock options in the same way as one-time capital gains for shares held in a Canadian-controlled private corporation (CCPC) for at least two years.

The $750,000 exemption gives stock option holders significant financial benefits and, at the same time, eliminates a policy that allows well-compensated executives (such as those at Canada’s large banks and insurance companies) to exercise options on a regular basis without any limits.

For startups, a $750,000 exemption is attractive because it is large enough to use as a recruitment tool in a market where there is intense competition for talent…..

There is also plenty of room to gradually phase in an increased capital gains inclusion rate. Such a phased-in increase would be entirely consistent with the history of the exemption. From 1972 to 1988, Canadians had to pay tax on 50 per cent of their capital gains. The inclusion rate was increased to 66 2/3 per cent in 1988, rose to 75 per cent in 1990, before dropping back down to 66 2/3 per cent on Feb. 28, 2000 and then further reduced on Oct. 18, 2000 to 50 per cent, where it has remained to this day.

In other words, a five-year phase-in of an increase in the inclusion rate to 75% (i.e. a 5%/yr. increase) would be just another “up” phase in the ongoing ups and downs in the inclusion rate since the introduction of a capital gains tax in 1972. Certainly no reason for investors to panic!

And keep in mind that, under these proposals, some capital gains would remain entirely tax-free, such as the gain on the principal residence or the gain where appreciated publicly-traded securities are donated to a registered charity.

Conclusion

In the coming budget, the federal government has a historic opportunity to undertake truly progressive tax reform that will finally bring a measure of fairness to Canada’s convoluted tax code. If done properly, the tax expenditure review currently being undertaken will present strong evidence that in the name of fairness, the extraordinarily regressive capital gains related tax expenditures can be scaled back somewhat and that public and pension fund investment can make a growing contribution to Canada’s growth and innovation performance.

The opportunity is there – but will the Trudeau government seize the moment? (End of reproduced article)

(This blog is of a general nature about financial discrimination of individuals/singles.  It is not intended to provide personal or financial advice.)


FINANCIAL DISCRIMINATION OF SINGLES AND LONE PARENT POVERTY MASKED BY GASLIGHTING

FINANCIAL DISCRIMINATION OF SINGLES AND LONE PARENT POVERTY MASKED BY GASLIGHTING

(These thoughts are purely the blunt, no nonsense personal opinions of the author about financial fairness and discrimination and are not intended to provide personal or financial advice.)

This blog post is in response to a local newspaper opinion letter submitted by a reader who believes “singles only need small spaces and one tank of gas per month”.  This post was published in a local newspaper in shortened format as only so many words can be submitted for newspaper publication.

SHOCKING STATISTICS FOR PROVINCIAL INCOME SUPPORT PROGRAM RE INDIVIDUALS AND LONE PARENTS

Shocking statistics show that in one of the richest provinces (Alberta) there were in early 2014, 33,000 Alberta Income Support program (excluding AISH) recipients of all ages.  Alberta Income Support program in January, 2017, had 54,374 recipients and in January, 2018, 57,003 recipients.  Makeup of claimants in 2017 and 2018 include individuals 69%, lone-parent families 24%, couples with children 5%, and couples alone 3% (social-assistance-rates-continue-to-soar-despite-albertas-recovering-economy).  Totals do not say how many are turned away and do not include those who on verge of poverty.

GASLIGHTING MASKS INDIVIDUALS (SINGLES) AND LONE PARENT POVERTY

Reader comments on Alberta support program statistics gaslight by blaming NDP government and immigrants.  Local newspaper opinion letter submitted by a family gaslights as part of the family majority by using bias and financial illiteracy re singles finances to tell singles they only need small spaces and one tank of gas per month.   The letter implies families have to pay so much more than single retirees.  Sorry, singles and lone parents retirees are forced by married majority to pay more taxes because they can’t pension split and don’t have marital benefits privileging married and coupled persons with and without children.

So, apparently, while your children have their own bedrooms, it is okay for singles to live in spaces as small as 150 sq. ft. with only a microwave, bar fridge, bar sink, and no stove, bathtub, laundry or storage space.  And, apparently, as evidenced in Whistler, BC housing crisis it is okay for singles to earn a decent living, but have no place to live.  One person earning $2,800 after taxes has lived in a camper van for four years.  Styrofoam cutouts are wedged into the windows to keep out the cold. Or, in shared house a single bedroom was advertised for two female tenants at $780 per person.  Illegal short term rental greed has replaced housing designated for staff.

Singles have become invisible in DIY, real estate and housing TV programs.  Probably this is because singles are increasingly being charged more and more per square foot for their small spaces and are less able to afford home purchases.

One tank of gas per month doesn’t even deserve a response.

J-u-s-t  s-p-e-a-k  t-h-e  d-a-m-n  t-r-u-t-h!  Over 90% of Alberta Income Support recipients as minorities are singles and poor lone parent families!  Families gaslight by saying it is expensive to raise children covering only twenty to twenty five years.  Housing covering sixty to eighty years, especially rental, is biggest lifetime expense regardless of marital status or children.  House ownership is separating Canadians into ‘haves’ versus ‘have nots’.

MARKET BASKET MEASURE SHOWS IT COSTS INDIVIDUALS MORE TO LIVE THAN MARRIED OR COUPLED PERSONS WITHOUT CHILDREN

Conservatives, financially illiterate, gaslighters and married never talk about low income, equivalence-scales-in-relation-to-cost-of-living or cost of living scales like Market Basket Measure (MBM) (statcan).  Example:  if single person household has value of 1.0, lone parent, one child or two adult household has value of 1.4, one adult, two children 1.7 and two adult, two children 2.0.  It costs more for singles to live than couples without children.

Just one example of MBM not applied was the 2015 Federal Conservatives proposed targeted federal tax relief benefit for single senior to $20,360 ($1,697 per month) and senior couple $40,720 ($3,393 per month).  Using simple math, $1,000 rent and $400 food and white goods per month is barely covered for singles, but $1,000 rent and $800 food and white goods is amply covered for senior couples.   Application of MBM of 1.4 for couples would equal $28,504 ($2,375 per month), not $40,720.  Cost of living for couples is not twice that of singles. Trump has also given double tax relief for couples.

For 2018, net income limit is $75,910 for singles and $151,820 for couples. Applying MBM of 1.4 or $106,274 net income limit for couples ensures tax fairness.

Singles are told by married persons that they can always reduce costs by moving in with someone else.  However, this does not solve the problem of financial discrimination of singles being forced to pay more taxes.

MULTIPLE GOVERNMENT BENEFITS ARE GIVEN TO MARRIED OR COUPLED PERSONS WITH AND WITHOUT CHILDREN

Conservatives, who tout individual responsibility,  have implemented tax avoidance programs privileging upper middle class and wealthy married or coupled households with and without children (add link) like pension splitting, Tax Free Savings Accounts (TFSA) with no limits, Old Age Security (OAS) clawback targeting only top two percent, and tax loophole programs. They financially and socially discriminate against minority singles and poor households who generally do not have the income to take full advantage of these programs.  Wealthy never pay their fair share of taxes. The Canada Child Benefit does not take into account net worth and assets, so it privileges wealthy parents who have low incomes, paid for houses, and high net worth and assets who then retire early. These same benefits have been perpetuated by the Liberal Party because of fear of losing votes if tax fairness changes are made.

Married and coupled persons do not realize the financial power and privileging that has been given to them when they are able to apply benefits on top of benefits times two persons (family-tax-credits).  For example, it is shameful when married and coupled persons can get OAS, which is supposed to be part of the Canadian poverty reduction pillar, then take that money and max out their TFSAs while paying less taxes because they can pension split and not pay taxes on TFSA proceeds (TFSAs do not need to be included in income).

The local newspaper opinion letter on same day as above opinion letter thankfully recognizes widowed person, now homeless ‘single’ (doesn’t say she is age 65), who is begging for money because she can’t get on small town local social support 600 person waiting list.

Singles, including poor lone parent households, are not stupid and deserve to feel righteously angered.  (After all, they also have math skills since they went to same schools as their married/coupled counterparts).  Singles know as minority populations they are not respected in financial formulas to the same level as married or coupled households with and without children.

CONCLUSION

Personal responsibility with social justice imbalance can lead to selfishness and greed.  Personal responsibility with balanced social justice and financial formulas changes “me” to “we”. Less gaslighting and more financial and public policy formulas based on MBM, and including net worth and assets, on all benefits and taxation without political bias would ensure financial fairness for all Canadians.

(This blog is of a general nature about financial discrimination of individuals/singles.  It is not intended to provide personal or financial advice.) This is a WordPress blog designed by a hired individual.