AFFORDABLE HOUSING DISCRIMINATION FOR SINGLES PERPETUATED BY MISINFORMATION AND LACK OF KNOWLEDGE

AFFORDABLE HOUSING DISCRIMINATION FOR SINGLES PERPETUATED BY MISINFORMATION AND LACK OF KNOWLEDGE

(These thoughts are purely the blunt, no nonsense personal opinions of the author about financial fairness and discrimination and are not intended to provide personal or financial advice.)

This blog has posted several articles about affordable housing for singles and poor families.  It is disconcerting how family and social agencies, community services continue to get the facts wrong even when presented with logical arguments about affordable housing discrimination for singles and  poor families.

Recently, a local family and community services organization seeking input on housing arranged focus groups to discuss this subject.

Attendance at one of these focus groups by the author highlighted several areas of concern.

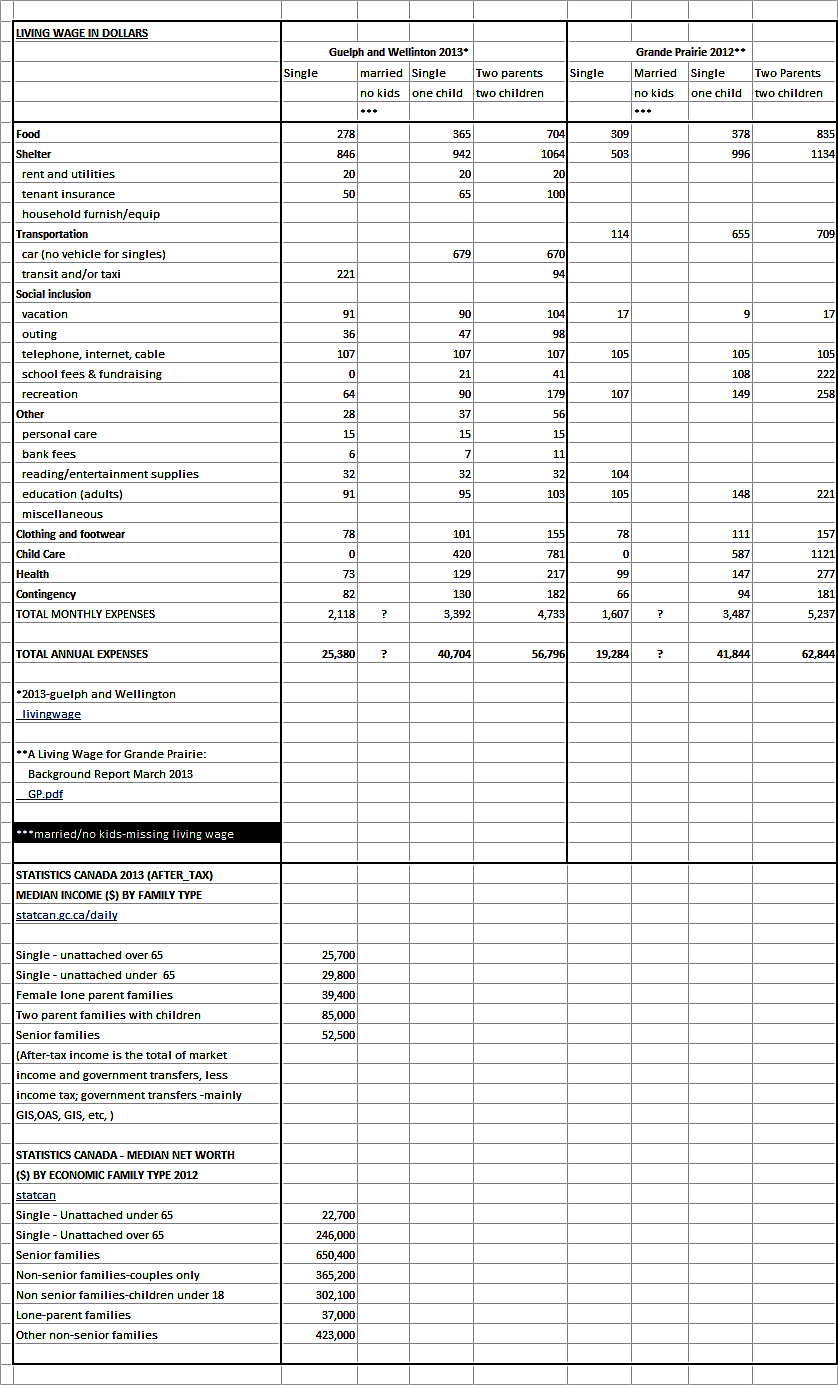
First, discussions started with presentation of a chart showing family unit description. One chart showed five stages of family unit life cycle being childhood, early adulthood, married and rearing of children, empty nest and senior stages.  It was disconcerting to note that this chart did not include ever singles (never married, no kids) in the family unit.  After the childhood and early adult stages, singles were not included and were, in fact, invisible in the family unit chart.

Second, regarding affordable housing and renting, discussions revealed there is an intense lack of knowledge regarding the discrimination of singles and housing issues (housing).  As outlined in previous blog articles, it has been shown that singles are generally being pushed by builders, planners and government into smaller spaces while paying more for micro-condos on less space and less income.

(Examples:  In same complex-1 bed, 1 bath, 1 patio micro-condos of 552 sq. ft. with starting price of $299,900.  Two patio, 2 bed, 2 full bath, 2 story 1232 sq. ft. condos were already sold out so price not available.  Then there were 2 patio, 3 bed, 2.5 bath, 2 and 3 story 1830 sq. ft. condos priced from $649,900 to $749,900.   When price per square foot is calculated, micro-condo is selling for $543 per sq. ft. while three bed condos are selling from $355 to $409 per sq. ft.

Another example, Luxury Condos presently for sale in downtown Calgary (built in 2007)

  • Sixth floor condo 1 bed, one bath 645 sq. ft. on podium level with direct access to large terraced area (no private balcony), $359,000 for $556 per sq. ft.
  • Nineteenth floor 2 bed, 2 bath with den and balcony 946 sq. ft., $449,900 for $475 per sq. ft.
  • Twenty-fifth floor 2 bed, 2 bath plus den, 2,119 sq. ft. (2 balconies 23 ft. X 8 ft. and 23 ft. X 16 ft.-this is Trumpian huge!), $998,000 for $470 per sq. ft.)

Ripple effects are owners (more likely to be singles or a single parent with one child) of micro-condos have to proportionately pay more house taxes, education taxes, mortgage interest and real estate fees on less house and possibly less take home pay for biggest lifetime expense.  When it is sold, will seller recoup buying price?

Builders will argue that it is more expensive to develop (5 to 10 percent more per square foot)  and operate (i.e., increased trash pickup because of higher occupancy, $5 more per square foot) micro-condos than conventional units because of the planning, etc. required to fit everything into the small spaces.  However, this reasoning flies in the face of logic when it is known that bathrooms and large gourmet kitchens plus expensive outside amenities are some of the most expensive parts of housing.  Two or two and half baths and large gourmet kitchens in a house or condo surely should balance out some of the expense of developing micro-units.  Also, many more micro-units can be developed in same space occupied by average sized or large housing units.

When question was asked in focus groups why senior singles have to pay more their spaces on one income than senior married or coupled persons, the answer was that singles pay more because they are using more space.

Does anyone understand the juxtaposition and absurdity of these two scenarios? First, singles are told they only need smaller spaces while paying more for them and then as seniors, they are told they are using too much space and, therefore, have to pay more for them.   Singles will never achieve financial fairness for housing throughout their entire life cycle of adulthood and as seniors until criteria for housing remains the same throughout the cycle.

Same premise for pricing of housing can be applied to renting (deserve).  Singles (persons more likely to rent small spaces) have to pay more for these spaces because that is what present business and societal principles dictate.  The smaller the rental unit, the larger the applied dollar rental per square foot of the rental unit.

It is absurd that singles and poor families (for example, single parent with one child) have to pay more and get less for housing rentals.  Even renting a room in a detached house usually is based on absurd rents ($500) charged by the owner.  An outside the box, very fair solution could be to, for example, charge a set rate of $100 per 100 square feet plus utilities in proportion to amount of square footage being rented.  A 250 square foot dwelling would rent for $250, and a 1000 square foot dwelling would rent for $1,000 plus utilities.  Renter would pay price related to price per square foot and not the whims of the market and the greed of developers and owners.  Renters of smaller units would pay a price that is much more fair in relation to renters of larger square foot units.  The set price per square foot could be adjusted as required as housing prices increase or decrease.

“City Research shows gaps in housing supply” from CREB Now, March 10 to 16, 2017 issue states from the ‘Housing in Calgary:  An Inventory of Housing Supply 2015/2016” report that just half of households in the city have sufficient income to buy a starter home in the condominium market.  The report also showed Calgary has the highest rents in the lowest tiers of rentals, contributing to the fact that 21 per cent of households do not have enough income to rent an average apartment.  Additionally, rent in senior’s housing complexes are also higher than average.

CONCLUSION

There are many more examples of financial unfairness, but just the above few show how housing world for low-income families and individuals/singles has been completely flipped upside down and topsy-turvy.  Young individuals/singles not yet married are facing huge financial hurdles because of low incomes, less full time jobs, enormous education debt, and out of control housing costs.  Families (parents), governments, society, corporations, businesses to date have failed to provide support and responsibility that is needed to ensure all Canadian citizens are able to financially take care of themselves without financial parental aid, inheritances of parents and without bias of gender, race, marital status or income level.

Low income families, individuals/singles and young adults not yet married who can apply simple math and critical thinking skills are in financial despair and angst knowing that they, as the most vulnerable citizens of this country, have been targeted and pawned to pay more for housing than middle class families and the wealthy.  It is the duty of politicians elected by the people, for the people to represent all Canadian citizens, not just vote getting middle class families.

ADDITIONAL INFORMATION FROM MEDIA SOURCES

AFFORDABLE HOUSING WAS NOT A PART OF CONSERVATIVE PARTY DEFINITION OVER FORTY YEAR REIGN

“Calgary Herald”, June 29, 2016 “City takes aim at failing affordable housing plan” states ‘just 1,048 new affordable housing units created in Calgary over the past 14 years, the need for affordable housing was great in 2002 and it remains so today.  Calgary has half the amount of  affordable housing as the national average, and a total of zero affordable housing units have opened in the city in the past three years….the city wants to see 1,500 affordable housing units built in the next two years – more than the number built in the past fourteen years – and staff believe it’s a goal that’s possible given money pledged from the provincial and federal governments, both of which have recently signalled a renewed commitment to affordable housing.  Housing a homeless person has been shown to save taxpayers $34,000  annually….Currently 88,000 Calgary households earning less than $60,000 are in need of affordable housing.’

Alberta Conservatives and Federal Liberals appear to be more focused on selective social democracy that is surreptitiously and purposefully eliminating the middle class and creating a class system consisting mainly of the poor, upper-middle class and wealthy with affordable housing out of reach for the poor.  The housing market has been set so wealthy pay much less for their housing than do singles and poor families. Wealthy usually pay less while getting much more.

“Discerning Functional and Absolute Zero” study by Alina Turner states that there has to be a political willingness to devote more resources to affordable housing and social services that address homelessness.

Myke Thomas, “Rising costs keeping millennials out of ownership” Calgary Sun, Homes Section, March 11, 2017 states that the boomers generation are very much into home ownership, sometimes owning two or three homes, while millennials are not shying away from homeownership, so much as financial barriers are making it difficult for them to own homes. (“Beyond the Bricks:  The meaning of home” study)…..The barriers facing millennials should be huge red flags flying in the faces of every level of government.  Housing is a major component of the Canadian Economy and a reduction in homeownership will have an adverse effect across other sectors of the economy.  It’s time governments stopped thinking of homeowners as ATM machines, as well as reassess excessive land development restrictions, punitive mortgage rules and regulations, land transfer taxes and other taxes which are contributing to a disturbing rise in the cost of homes.

(This blog is of a general nature about financial discrimination of individuals/singles.  It is not intended to provide personal or financial advice.)

OAS CLAWBACK OUTRAGEOUSLY BENEFICIAL TO UPPER MIDDLE-CLASS MARRIED OR COUPLED SENIORS, BUT FINANCIALLY DISCRIMINATORY TO SINGLES AND POOR – ADDENDUM

OAS CLAWBACK OUTRAGEOUSLY BENEFICIAL TO UPPER MIDDLE-CLASS MARRIED OR COUPLED SENIORS, BUT FINANCIALLY DISCRIMINATORY TO SINGLES AND POOR – ADDENDUM

(These thoughts are purely the blunt, no nonsense personal opinions of the author about financial fairness and discrimination and are not intended to provide personal or financial advice.)

One of our past blog posts (oason subject of the OAS Clawback (proper name is OAS Recovery tax as per Canada Revenue Agency) and the financial discriminatory properties behind the program was discussed.

This blog post further emphasizes the financial atrocities and discrimination that senior singles face with the OAS Recovery program.  The Old Age Security (OAS) is a federal social program designed to provide a very modest pension to low- and middle-income retirees.  It is part of the Universal government benefits for seniors (pillar 1) to ensure income security for senior Canadians (so stated in government and Canada Revenue Agency information sites).

As previously shown the clawback of OAS benefits in 2016 starts with a net income per person of $72,809 (couple $145,618)  and completely eliminates OAS with income of $118,055 (couple $236,110).  The repayment calculation is based on the difference between personal income and the threshold amount for the year. The  repayment of OAS is 15 percent of that amount.  All OAS is clawed back if personal income is over $118,055 per person.   In 2016 the OAS benefit is $6,680 for single person and $13,760 for a couple.

One should note that OAS recovery for a couple begins with each spouse earning maximum net income of $72,809 each (total $145,618) the OAS is only partially recovered for a couple with net income over $145,618 and a single over $72,809  The couple, therefore, continues to get to keep a portion of the OAS benefit for each person with the full financial benefits of additional up to $72,809 ($145,618 minus $72,809) net income than for a single person.

The complete clawback of the OAS benefit only occurs at $236,110 for a married or coupled family unit, but for a single person it is $118,055.  The couple, therefore, only has complete clawback of the OAS benefit with the full financial benefits of additional up to $118,055 ($236,110 minus $118,055) net income than for a single person.

Another point is that partial OAS recovery only begins at $145,618 for a married or coupled family unit while complete recovery (elimination of OAS) has already occurred for a single at $118,055.  In other words, married or coupled family units have been given the financial privilege of up to an additional net income of $27,563 to manipulate at their will ($145,618 minus $118,055); this has already been completed eliminated for a single senior.

CONCLUSION

If one carefully looks at the above, can a conclusion of double-dipping (triple-dipping, etc.) of finances for married or coupled family units be reached? (reasons) In majority of cases, upper-middle class married or coupled family units get to keep partial OAS benefits plus have benefits of additional net income plus pension splitting plus double TFSA limits, etc. The double-dipping, triple-dipping, etc. is even more pronounced as it has been clearly shown that it costs more for single persons to live than married or coupled family units.

The irony of the statement  ‘OAS program is designed to provide a very modest pension to low- and middle-income retirees’ at the beginning of this post should not be lost to the reader.  The very program that is supposed to provide a ‘very modest pension to low and middle-income seniors’ has been designed to ‘line the financial pockets’ of upper-middle class married and coupled family units who have more than a modest pension.

This once again shows how politicians and the government surreptitiously and purposefully implement benefit programs that increase the wealth of upper-middle class married or coupled seniors over single person seniors.  Politicians and governments are surreptitiously and purposefully creating a middle-class system where the upper-middle class are replacing the middle class.  What is advertently or inadvertenly being created is a class system comprised mainly of the poor, upper-middle class and the wealthy and favouring married or coupled family units.

(This blog is of a general nature about financial discrimination of individuals/singles.  It is not intended to provide personal or financial advice.)

CANADA PENSION PLAN ENHANCEMENTS WILL DO NOTHING TO ELIMINATE FINANCIAL DISCRIMINATION OF SINGLES AND THE POOR

CANADA PENSION PLAN ENHANCEMENTS WILL DO NOTHING TO ELIMINATE FINANCIAL DISCRIMINATION OF SINGLES AND THE POOR

(These thoughts are purely the blunt, no nonsense personal opinions of the author about financial fairness and discrimination and are not intended to provide personal or financial advice).

The last post discussed how the CPP plan in its present format financially discriminates against singles and the poor.  CPP is part of the Pillar 2 plan of Canada’s retirement income system for seniors.  The last post (program) showed how Canadian seniors will not receive full CPP benefit if they have not made full work contributions for forty years and if they do not have full Yearly Maximum Pensionable Earnings(YMPE) contributions for those forty years.  Canadians most likely to not receive full CPP benefits are those who have not worked for forty years or have not been able to make full contributions because of low income.  Senior singles also pay more and get less in seniors benefits (pay-more).

Recently there has been much discussion about CPP contributions and benefits being enhanced because Canadians are not saving enough for their retirement.  Apparently, the enhancements will include increasing the amount of required CPP contributions and, in return, the amount of CPP benefits received.

Enhancements include:  Once fully implemented in 2025, the total CPP contribution rate (which is shared between employees and employers) will increase from the current rate of 9.9 per cent to 11.9 per cent of eligible earnings up to a maximum of $72,500. In addition, earnings between $72,500 and $82,700 will also be subject to mandatory CPP contributions at a lower rate of 8 per cent.

CPP retirement benefits will also be increased. The replacement rate for pensionable earnings will increase from 25 per cent to 33 per cent. According to the Department of Finance, it will take “about 40 years” for the full increase in retirement benefits to be phased in.  The Department of Finance has stated that like the current program, future benefits will be based on the years of contribution and actual contributions.

The significance of these changes is astounding.  Future benefits will remain the same based on the two principles of the years of contributions and actual contributions, in other words, same old, same old.  The premise remains the same – individuals with highest YMPE will receive the most CCP, while those at lower income levels will receive the least CPP benefits because they have not been able to make maximum CPP contributions.

The YMPE will be be raised to between $72,500 and $82,700 (up from $54,900 or approximately $25 per hour in 2016).  Based on approximately 2,200 hours of work per year, $72,500 equals approximately $33 per hour and $82,700 equals approximately $38 per hour.  In other words, the more income an individual makes, the more CPP benefits they will receive.

In 2013, the minimum wage was around $10 in all provinces. In constant dollars, this rate was similar to the rate observed in the late 1970s.  It is only in the last several years that the minimum wage has increased somewhat.   Historically, Alberta’s minimum wage went from $8 in 2007 to $9.95 in 2013.   In addition to the stagnant wage, the Alberta income tax rate in 1999 went from a graduated rate based on income to a flat tax of 10%.  The tax rate for  the middle class and wealthy was changed to 10% while the rate for lower income individuals went up from 8% to 10%.

The 10% tax rate remained in place for about fourteen years until 2015, when the NDP came into power and reverted the flat tax system to a graduated system.The current minimum wage rose to $11.40 in October 2015 and is set to rise to $12.20 in October 2016.  This is has all been a result of the NDP party coming into power in Alberta after a forty year reign by the Progressive Conservative party.

At the present time, the difference between Alberta’s minimum wage today of $12.20 per hour and the present CPP YMPE rate of $25 per hour is striking.  What this means is that the middle class and wealthy working for forty years will be able to attain greater CPP wealth than the person earning a minimum wage who has faithfully worked for 40 years.  Why wouldn’t those working at minimum wage be angry and in utter despair at policy decisions that don’t financially include them with fairness and equality?  If ordinary persons without math degrees can figure this out, why can’t government, policy makers and businesses?

In order for there to be financial fairness, the minimum wage has to rise at same rate as the increase  the CPP YMPE rate!  Think that is going to happen, don’t hold your breath!

PROBLEMS:  

  • Governments and businesses give many excuses as to why minimum wage should not be raised
  • Businesses don’t want to pay the proposed increases of their required CPP employer contributions because they say it will impact their businesses-they are threatening to go to contract and part time employees.
  • Currently only two provinces index their minimum wages based on the Consumer Price Index, thus offering guaranteed protection from wage erosion. Currently, there is no accountability for those actually determining the minimum wage.
  • With new proposed enhancements earnings between $72,500 and $82,700 will also be subject to mandatory CPP contributions, but at a lower rate of 8 per cent.  Why is it that higher income earners always get the reduced rates?  Why should those earnings between $72,500 and $82,700 get a lower rate of 8 per cent?  What is the factual basis for choosing a lower rate for income range between $72,500 and $82,700?
  • Minimum wage or a living wage and income tax rates are two very important factors that help determine quality of financial life for singles and the poor.  So why is that politicians, governments and businesses always give better rates to higher income earners (middle class and wealthy than lower income earners and to families over singles)?  Those at lower income levels are more often made to pay more while getting less.  Examples of this are increasing minimum wage at pitiful rates and making lower income earners pay the same income tax rate while decreasing rates for the middle class and wealthy as described above (Alberta Conservative government).   The present Liberal party did same by reducing taxes only for the middle class, but not reducing rates for the poor.
  • Upside down finances continue to be perpetuated (finances) so that the poor are forcibly made to remain poor by the upside down financial decisions by government and politicians.  Why don’t single persons deserve a full CPP benefit if they have been faithfully employed for forty years, (never used EI, never used maternity/paternity benefits, etc.) but have not been able to contribute full YMPE because of a lower income?

CONCLUSION

The policy decisions by government for CPP enhancements past and present have created a pillar whose base is cracked and breaking.  The only way most ever singles, early divorced singles, single parents and the poor can ever hope to reach the maximum CPP YMPE is by working multiple jobs.   Married or coupled family units may have the option of both spouses working and receiving two CPP pensions.  The indexing of a minimum wage or a living wage is paramount in avoiding financial discrimination in CPP enhancements for singles and the poor. To do anything less is a blatant violation of the human and civil financial rights of poor and low income Canadians.

THE MINIMUM WAGE IN CANADA

An excellent article “The Minimum Wage in Canada” by the Canadian Labour Congress, April 2015 gives an excellent perspective on minimum wage (minwage).

Some of the details of this article include the following:  

“A profile of minimum wage workers will show that the stereotypical teenage employee is not the reality and many individuals are struggling to provide for their families on minimum wage incomes. Common concerns about increases to the minimum wage, such as a rise in unemployment rates, the financial impacts on small business, and alternative policy changes to address poverty will be discussed in order to break down the myth that an increase to the minimum wage will have detrimental economic impacts…..

British Columbia froze its minimum wage at $8.00 an hour for almost a decade.  During this freeze period minimum wage earners were put under increasing financial strain as inflation restricted their ability to consume.  Currently only two provinces index their minimum wages based on the Consumer Price Index, and are offered guaranteed protection from this type of wage erosion….

There are two clear considerations that must be made when evaluating the adequacy of the minimum wage in Canada….Letting the real value of the minimum wage deteriorate just creates a cycle of poverty….

For those who oppose increasing the minimum wage in Canada, there are several arguments used to justify maintaining low rates. …The amount of people earning the minimum wage has remained under 10% of the total working population. This is not a large enough portion of the population to make a difference; if most people already earn above the minimum wage there’s no need to increase it. One thing often used to strengthen this argument is that, of the small number of minimum wage workers that exist, the majority are teenagers or students who are not attempting to support a family. Instead, they are working for personal money or for the experience and will soon move up the job ladder. The first major issue with this argument is that it blatantly accepts discrimination as a reason to pay someone low wages. Age is one of the prohibited grounds outlined in Section 15(1) of the Canadian Charter of Rights and Freedoms which guarantees all citizens equal and fair treatment under the law. To say that the wages of adults should be prioritized over the wages of young workers is a clear violation of this right. The purpose of setting a minimum wage is to create a sense of equality for vulnerable workers of all ages. Second, teens account for less than half of the minimum wage earners, so there are quite a few adults in Canada earning the lowest legal wages. Young adults may not have been active in the labour market for long but they are just that, legal adults who have financial responsibilities. Some do attend a post-secondary institute; however, that does not mean they are working out of choice. Not all young people have the financial support of their families to help them pursue their education. They rely on their paid employment to cover the ever increasing costs associated with education. ….The reality is that minimum wage earners are not one specific group of people and they definitely do not fit the stereotype of a few teenagers and students getting their first jobs. ….

The philosophy associated with our economic system is the constant need to keep costs as low as possible, which also means low wages for much of our workforce …. The theory is that as wages increase operation costs, employers are forced to find other ways to make up the difference. ….Although Canada’s unemployment rate has made some recovery since the 2009 recession, as of August 2014 it was still 7.0%…. Given the current economic climate, this argument suggests that the potential repercussions that increasing the minimum wage might have on unemployment rates, could seriously affect Canadian society. After examining the economic research available on the connection between unemployment and minimum wage increases, it is difficult to say with conviction how the two factors are related, if they are at all….. According to The World Bank’s World Development Report 2013: Jobs, there is no known universal impact of the minimum wage on unemployment rates. In order to say with certainty what the impact actually is, individual countries would have to closely monitor the labour market and compile vast amounts of research (World Bank, 2012). Our opinion on the matter is very similar. Based on the research that has already been done, there is too much contradicting evidence to say with confidence what the real effects on unemployment rates are.

A proposed alternative to increasing the minimum wage is to instead increase the basic personal tax exemption…..This policy does not introduce more money into the economy, it simply redirects it from government revenues to individual households. ….The redistribution of money does not make Canadians better off, it only continues to subsidize the low wages offered by employers…..

Minimum wage workers are more likely to be employed with a large firm than a small company; a troubling trend that requires further examination.  This recognition that large scale companies are more likely to pay the minimum wage than small businesses raises some serious concerns about who is utilizing minimum wage laws and why. ….However, some of Canada’s largest companies continue to offer many of their staff members only the minimum wage despite their recent success and profitability…..

Individuals earning low wages are the least likely to be meeting all their needs, so when their wages increase instead of saving their new income they use it to purchase the goods they have been lacking. This directly contrasts the wealthy who are more likely to save or invest additional income than inject it back into the local economy.

Minimum wage laws can actually benefit communities. Studies have shown that because individuals cannot afford to financially support their households on the minimum wage, they often turn to social services for assistance ….This means that the taxpayers are essentially subsidizing the low wages of a company that makes billions in profits. Additionally, when large firms move into an area and offer low priced goods, it drives down the wages of workers employed at small firms that need to reduce costs to stay competitive….. In some cases, not only will wages in the area drop but small employers will be forced to close—eliminating jobs altogether.

Even with most provinces attempting to conduct neutral reviews on the minimum wage rate, the final decision still remains politically motivated. One team of researchers found that, while the proximity of an election did not influence the decision to alter the minimum wage, the political ideologies of the government in power did. The New Democratic Party in particular were more likely to have a higher minimum wage rate in place than other parties (Dickson & Myatt, 2002). A 2006 study (Green & Harrison, 2006) found similar trends relating to the minimum wage and political agendas; conservative governments would let the minimum wage stagnate and centre-left parties would approve increases but neither were willing to make drastic changes. ….The issues at play when debating the appropriate minimum wage rate are complex, as it is not exclusively an economic policy….. Rather it is the ideology of “universal fairness” that generates support ….. This attitude is further portrayed by research that suggests the public perception of poverty is not to blame the victim. One study found that respondents, instead of citing the self-destructive behaviours of individuals like laziness and the inability to adhere to a budget, were more inclined to believe structural factors were the major contributors to poverty. This included social and economic factors like low wages (Love, et al, 2006). Individuals also recognized that employment no longer guaranteed people the means to escape poverty, as wages are often insufficient and, while workers are often willing to work more hours, full time positions are becoming more rare (Love, et al, 2006). The reality is that minimum wage policy is an economic, political, and social matter. As Canadians we must decide what we need from our minimum wage rates, then determine how to balance all these factors to achieve that goal. Decreasing wage inequality should be the first priority, as minimum wage policies have the potential to prevent extreme poverty. Increase the wages of other low paid workers and allow individuals to accumulate more financial support (World Bank, 2012). We must decide what quality of life we feel all Canadians deserve. Should full-time workers only be able to meet their basic needs like food and shelter, or are they entitled to a lifestyle that also considers their social and political well-being when determining basic living standards….? It is not possible to set the minimum wage based solely on economic factors because these broader social implications are the end results for Canadians.

Currently, there is no accountability for those actually determining the minimum wage.

This is not an issue that only affects businesses, so the human aspect needs to be given more priority in the minimum wage debate. While it is important for our economy to remain stable, we must also ensure the needs of workers are being met. They should be able to enjoy a certain standard of living; however, full-time employment is no longer a guaranteed escape from poverty. It is time to evaluate what our society deems fair, and compensate minimum wage workers accordingly. Raising the value of labour at the bottom, is a raise for everyone in Canada”.

(This blog is of a general nature about financial discrimination of individuals/singles.  It is not intended to provide personal or financial advice).

CANADA PENSION PLAN JUST ANOTHER GOVERNMENT PROGRAM PROMOTING FINANCIAL DISCRIMINATION OF SINGLES AND THE POOR

CANADA PENSION PLAN JUST ANOTHER GOVERNMENT PROGRAM PROMOTING FINANCIAL DISCRIMINATION OF SINGLES AND THE POOR

(These thoughts are purely the blunt, no nonsense personal opinions of the author about financial fairness and discrimination and are not intended to provide personal or financial advice).

(singles-need-to-learn-how-to-articulate-financial-discrimination-of-singles)

Our last post discussed the financial discrimination of Old Age Security (OAS).  This post discusses the financial discrimination of the Canada Pension Plan (CPP).

CPP is part of the Pillar 2 plan of Canada’s retirement income system for seniors.  Some of the attributes of the plan are:

  • Federal government and Provinces are joint stewards of the CPP
  • Provides retirement, survivor, and disability benefits
  • Universal coverage of all workers in all industries
  • Employees and employers make equal contributions (4.95% each – 9.9% combined in 2015?) on earnings up to annual maximum of $54,900 (2016)
  • Defined Benefit – up to 25% of the average wage
  • Fully portable
  • Inflation-indexed to CPI
  • Actuarially sound for the next 75 years
  • The maximum CPP benefit for 2016 is $1,092.50 per month.

Unfortunately, most Canadians do not realize that the average Canadian will not receive the maximum CPP on retirement.  In fact, most will only receive about $643 per month of CPP maximum.  Why is this so?

Jim Yiu from ‘Retire Happy’ in his article “How much will you get from Canada Pension Plan in Retirement?” states (words in italics are my words):  

‘When planning for retirement, the first piece of advice given is not to plan on getting the maximum.  When you look at the average payout of CPP, it’s just a little over $643 per month in 2016, which is a long way from the maximum. In other words, not everyone gets the maximum. At the most basic level, the amount you get from CPP depends on how much you put into CPP.

Why is it that so many people do not qualify for the maximum amount of CPP? The best way to answer that is to look at how you get the maximum retirement benefit. Eligibility to receive the maximum CPP benefit is based on meeting two criteria:

  1. Contributions – The first criteria is you must contribute into CPP for at least 83% of the time that you are eligible to contribute. Essentially, you are eligible to contribute to CPP from the age of 18 to 65, which is 47 years. 83% of 47 years is 39 years. Thus, the way to look at CPP is on a 39-point system. If you did not contribute into CPP for at least 39 years between the ages of 18 to 65, then you won’t get the maximum. If so, then you might get the maximum but there is another consideration.
  2. Amount of contributions – Every year you work and contribute to CPP between the age of 18 and 65, you add to your benefit. To qualify for the maximum, you must not only contribute to CPP for 39 years but you must also contribute ‘enough’ in each of those years. CPP uses something called the Yearly Maximum Pensionable Earnings (YMPE) to determine whether you contributed enough. (For 2016 the YMPE is $54,900 – EQUIVALENT TO ABOUT $25 PER HOUR).

Basically if you make less than $53,600 of income in 2015 ($54,900 in 2016), you will not contribute enough to CPP to qualify for a point on the 39-point system…..As you can see, it’s not easy to qualify for full CPP especially with the trend of people entering into the workplace later because of education and people retiring earlier.  If you have 39 maximum years of contribution you’ll get the maximum CPP amount. If you have 20 maximum years of contributions you will get approximately half the maximum (you might get some partial credits for part years).

Planning your retirement needs and income requires some understanding of how much you will get from CPP. Many people either assume they will get the maximum or assume they will get nothing at all because they fear the benefit may not be there in the future. Both these assumptions have significant flaws. Take the time to personalize the planning by understanding how the CPP benefit is calculated and how much you will receive.’

ANALYSIS

Reasons why CPP is financially discriminatory to singles with low/moderate incomes and the poor:

    1. The YMPE 2016 salary to get maximum CPP benefits is $54,900 (up $1,300 from last year).  If average annual hours of work equals 2,200 hours then YMPE salary will be approximately $25 per hour.  Many singles and the poor do not have $25/hr. jobs.  In addition politicians, government, and businesses generally refuse to increase the minimum wage or ensure a living wage for all Canadians. If the YMPE is increased by $1,300, why aren’t the wages increased by the same amount for the poor so they can also contribute more to CPP?  Even those persons who work faithfully at full time jobs for forty years, but don’t have $25 per hour jobs will not receive full CPP benefits.  (Is this really what they deserve after working faithfully for their country for forty years)?  So who benefits most from CPP?  It is the middle class and wealthy who have at least $25/hr. jobs and, therefore, are able to get full  CPP benefits.
    2. Early retirement – who gets to retire early?  It is generally the upper middle class and wealthy married or coupled family units because of the marital manna benefits they receive, high incomes and the net worth they have.   In reality many of these families really do not need full CPP benefits.  From personal experience of this blog author, some married or coupled spouses will say both spouses do not need to work when really both spouses should be working or because of their high income only need one spouse working.  (To get full  CPP benefits each Canadian born citizen needs to contribute into CPP for at least 39 years between the ages of 18 to 65.   And, Canadians must not only contribute to CPP for 39 years but they must also contribute ‘enough’ to maximum of YMPE in each of these years).
    3. Marital manna benefits – Married or coupled family units have received many marital manna benefits that allows them to achieve more wealth than many singles and the poor.  One such example is the Child Rearing Drop-out Benefit.  CPP benefits may be increased for years that spouse did not generate income because of staying home to rear child from ages 1 to 6.  This is not necessarily a bad thing in and of itself, but those who are more likely to be able to stay home for child rearing are those with healthy incomes.
    4. Perception of financial  need –  Many politicians, governments, and financial planners have misconceived perceptions that financial goals should be for Canadians to have equal or higher pension income than while working.  In other words, if poor, it is okay to always be poor even in retirement.  For middle class or wealthy they say the goal should be equal or more pension income than working income even with high net worth and assets.  In reality, institutions like the OECD states less wealthy need 100% retirement income  of working income, while wealthy need retirement incomes that are much less of working income.  What is left out of these perceptions is quality of life.  Equal or higher pension income than income while working for singles with low/moderate incomes and the poor especially if paying rent or mortgage in retirement often does not equal a good quality of life.
    5. Proposed enhancements to CPP contributions and benefits – Proposed enhancements where CPP retirement pensions will be higher if taken after age 65 and./or will be higher if person works past age 65 are very good things. However, it is likely that singles and the poor are not the ones who will be able to postpone receiving their CPP benefits, and it is also more likely that singles and the poor are the ones who will need to work longer.  As for increasing CPP contributions now so that CPP benefits can be increased in the future, this generally is a good thing; however, the stress of having to contribute more will be more financially distressing for singles with low and moderate incomes and the poor rather than the middle class and the wealthy.

CONCLUSION

It seems to be more important for politicians and governments to ensure that upper-middle class and wealthy maintain their standard of living than it is to treat ever singles, early divorced singles, single parents and the poor fairly in benefits they receive (cpp).

Upside-down financial systems (upside-down) and marital manna benefits have created a nanny state where married/coupled persons want it all and once these benefits are in place, it is very difficult to eliminate them because of voter entitlement.  Upper middle class and wealthy married/coupled persons have been made irresponsible by their own politicians and government.  Many are not living an equal life style in their retirement, but a much better lifestyle.  A further question is whether these programs will be financially sustainable because upper class and wealthy married or coupled family units have not contributed enough to pay for these benefits.

Much is required of all family units regardless of marital status to educate themselves on what their actual retirement income will be.  If you don’t work, you won’t get CPP.   You won’t get CPP if you don’t work.  You won’t get CPP if you don’t make CPP contributions, for example, working ‘under the table’.  (And, wouldn’t it be nice for parents to pass this financial information onto their children so that their children will also make wise financial decisions)!  Much is required of financial planners to educate themselves on quality of life issues, not just equal or higher pension incomes.  Much is required of politicians and governments to educate themselves on how financially discriminatory many of the pension benefits are and to make changes so that there is financial equality and fairness in distribution of pension benefits for every Canadian,not just middle class married or coupled family units and the wealthy.

(This blog is of a general nature about financial discrimination of individuals/singles.  It is not intended to provide personal or financial advice).

OAS CLAWBACK OUTRAGEOUSLY BENEFICIAL TO UPPER MIDDLE-CLASS MARRIED OR COUPLED SENIORS, BUT FINANCIALLY DISCRIMINATORY TO SINGLES AND POOR

OAS CLAWBACK OUTRAGEOUSLY BENEFICIAL TO UPPER MIDDLE-CLASS MARRIED OR COUPLED SENIORS, BUT FINANCIALLY DISCRIMINATORY TO SINGLES AND POOR

(These thoughts are purely the blunt, no nonsense personal opinions of the author about financial fairness and discrimination and are not intended to provide personal or financial advice).

(six-reasons-why-married-coupled-persons-are-able-to-achieve-more-financial-power-wealth)

Occasionally, there are topics that give one pause resulting in questioning as to the efficacy of the  formulation behind the topic.  The OAS Clawback (proper name is OAS Recovery tax as per Canada Revenue Agency) and the financial discriminatory properties behind the program is one such topic.  One way to resolve the questioning is to look at the topic in detail.

OAS is a federal social program designed to provide a very modest pension to low- and middle-income retirees.  It is part of the universal government benefits for seniors (pillar 1) to ensure income security for senior Canadians.  In 2016 the OAS maximum amount is $6,680 for a single person and $13,760 for a couple. OAS clawback which began around 2011 does very little to clawback the income of upper middle class persons, particularly married or coupled family units.  The clawback of OAS benefits in 2016 starts with a net income per person of $72,809 (couple $145,618)  and completely eliminates OAS with income of $118,055 (couple $236,110).  The repayment calculation is based on the difference between personal income and the threshold amount for the year. The repayment of OAS is 15 percent of that amount.  All OAS is clawed back if personal income is over $118,055.

According to Human Resource Development Canada, only about five percent of seniors receive reduced OAS pensions, and only two percent lose the entire amount.  This program benefits wealthy couples and widowers the most.  OAS clawback for couple only begins at net income of $145,618 ($72,809 per person) thus allowing them to receive full OAS of $13,760 as a couple.  There are not many ever single seniors, early divorced in life seniors and single parent seniors who could hope to achieve a net income of $72,809; however, for wealthy widowers this may be easier to achieve and they are the ones who complain about clawback.

An example of OAS clawback is the following example:  

The threshold for 2015 is $72,809.  If your income in 2015 was $80,000, then your repayment would be 15 percent of the difference between $80,000 and $72,809:

$80,000 – $72,809 = $7,191

$7,191 x 0.15 = $1,078.65

You would have to repay $1,078.65 for the July 2016 – June 2017 period.

Many financial advisors will give strategies on how to avoid the clawback while benefitting married or coupled family units the most.  This is just another example of financial marital manna benefits and manipulation of assets that within the legal limits of Canada Revenue Agency’s laws allows married or coupled person to increase their wealth (manipulation-of-assets).  This also is just another example of the upside finances perpetuated in this country by politicians, government and businesses that benefit married or coupled persons the most (quality-of-life).

From a financial advisor comes this statement (claw-back):  “I also want to put the impact of the claw back into perspective. Although no one likes to give up $6,600 in free money, it’s not like you were going to get to keep it all anyway. As the OAS is taxable, most people in the claw back zone would have paid back over 30% of it in taxes.

Secondly, some clients look at paying claw back as the cost of doing business; while they may not love it, they look at it as a price of their own financial success and as money they really don’t need anyway. Moreover, they might correctly see that in some cases combatting the claw back isn’t worth the effort. For example, although the rest of the article will focus on how dividends are often bad news for retirees trying to avoid the claw back, these same people might also be reluctant to modify their investments to produce other types of investment returns, especially if that means unnecessarily courting more investment risk or triggering a big capital gain in order to rebalance their portfolios”.

Limiting OAS Clawback

There are a few strategies you can implement to reduce clawback amounts (strategies):

  1. Split your pension with your spouse. If your spouse has a lower income, you can transfer up to 50 percent to your spouse, which should reduce your overall income. This could also include a Registered Retirement Income Fund and annuity income.
  2. Dip into your Registered Retirement Savings Plan before you turn 65. An RRSP is only a tax deferral, meaning that at some point, you’ll have to pay those taxes. Consider taking funds out before reaching the age of 65 so you do not lose the OAS.
  3. Use your tax-free savings accounts to generate investment income, which is non-taxable and would not count towards your net income.
  4. Interest on funds borrowed to earn investment income can be deducted and could reduce your net income.
  5. Watch for capital gains. If you are planning a sale of an asset that could trigger large capital gains, consider selling it before you turn 65.

From another financial planner (minimizing-clawback):  “At the end of the day, more people’s concern over OAS clawback will not be such a big deal simply because there are not a lot of people over the age of 65 making more than $72,809 of income. The people that do may have significant pensions or continue to work and earn and income over the age of 65. There will also be a group of people that trigger significant capital gains from the sale of second property or investments but the good news is they will only lose part or all of there OAS in the one year that the capital gains is realized and reported on the tax return. But if you happen to be one of the few that will get affected, make sure you plan ahead accordingly”.

CONCLUSION

The OAS clawback (implemented by Conservative party) is just another example of how politicians and government have ensured that senior upper middle class married or coupled family units with incomes between $72,809 to $118,055 net income per person will benefit more from the OAS government program. These same politicians and government agencies have financially discriminated against ever single seniors, early divorced in life seniors and single parent seniors by ensuring only five percent of seniors will receive reduced OAS pensions, and only two percent lose the entire amount.  Note we have specifically stated upper middle class married or coupled family units because wealthy married and coupled family units have already been excluded from receiving OAS pension by virtue of the $$118,055 (couple $236,110) net income limit.

To add further insult, politicians and government have ensured that the upper middle class will receive benefit upon benefit upon benefit to reduce the effects of the OAS recovery tax program.  The Liberal party (now ruling federal party) implemented a 1.5% reduction in income tax for incomes between $45,282 and $90,563.  These are middle class incomes, not incomes of the poor. Pension splitting is another program that reduces the possibility of OAS clawback.  As stated above, past governments have also ensured that marital manna benefits and ability to manipulate assets have been been given primarily to married or coupled family units all within legal limits of financial laws.  All of these benefits perpetuate an upside-down financial system where the upper middle class and the wealthy are able to achieve greater wealth than ever single, early divorced in life and single parent seniors.  In other words, the OAS Recovery Tax program (supposed to provide income security for poorer seniors) is a failed program which ensures greater wealth for the upper middle class and greater poverty for singles and the poor.

SOLUTION (added August 31, 2016)

Equivalence scales (scales) and net worth –  how many times can it be said over and over again that wealthy and upper middle class married or coupled family units are increasing their wealth by government programs designed to give more to these family units?  To correct this financial discrimination and upside finances for singles and the poor, equivalence scales and net worth need to be applied to these programs.  Monies saved could then be redistributed to the poor regardless of marital status.

(This blog is of a general nature about financial discrimination of individuals/singles.  It is not intended to provide personal or financial advice).

POLITICIAN’S RESPONSE LETTER DOES NOT UNDERSTAND SINGLES’ FINANCES

POLITICIAN’S RESPONSE LETTER DOES NOT UNDERSTAND SINGLES’ FINANCES

These thoughts are purely the blunt, no nonsense personal opinions of the author and are not intended to provide personal or financial advice.

The post on Fort McMurray Fire Disaster relief (fort-mcmurray-fire-disaster)showed how family units comprised of singles received the lowest financial assistance of all family units.  This information was sent to Province of Alberta politicians to make them aware of this situation.

One of the politician’s (right wing Conservative) response to this information is outlined here.  This letter continues to show the financial misunderstanding and financial discrimination of singles in this country.

A portion of the letter is reproduced as follows:

“Data from Statistics Canada Table 203-0023 concerning total household expenditures shows that Alberta government and Red Cross financial assistance for single person households, lone parent households, and couples without children total between 50% and 63% of typical monthly expenditures for those household types. The only household type to receive financial assistance approximating their average monthly household expenditures were couples with children. The same data shows that a two person household with no children has almost twice (184%) the household expenses of a one person household.

Given that shelter, food, household operations, transportation, healthcare, and recreation are the largest components and total approximately 50% of household expenditures of all the household types, and given that most of those goods/services are provided without cost or at steep discounts to evacuees, and given that those goods/services are used in reduced amount during evacuation, the level of temporary financial support provided does not appear unreasonable. However, given that some organizations’ aid programs are focused on the needs of mothers, seniors, and other demographics, there may be an opportunity for more organizations or programs focused on single adults.

It is true that two parent families with two or more children receive more financial assistance than the other family types, however we are not aware of a compelling public benefit to reducing financial assistance to individuals living as two parent families with children on the basis of their family status.

With respect to potential human rights violations, the financial assistance appears to be provided without discrimination on the basis of any protected human rights grounds, with the reasonable exception of children who have lower financial needs than adults and seniors. As far as we are aware, “financial human rights” is an interesting concept but not currently a well-founded legal doctrine in Canada or any other jurisdiction. In order for treatment of particular social groups to amount to persecution, any alleged violation of basic human rights would need to arise out of repeated or mistreatment which causes personal harm the affected individuals. All of the available evidence suggests that the relevant governments intend to rebuild the wildfire-affected areas and to resume providing services to individuals communities in the same ways as before the wildfires.”

First, the Conservative right wing politician’s letter refers to Statistics Canada Table 203-0023 showing 2013 household expenditures for family units of one person households, lone parent with children, couples without children, couples with children as well as other family unit types.  It is interesting to note that this data was based on surveys and these expenditures include tobacco and alcohol as well as games of chance.  These are wants, not needs and do not deserve to be included in any discussion of fairness of financial expenditures or financial disaster assistance of family units.

Second, the letter readily admits that two parent with children family units received the most assistance. The statement also is made as follows:  “we are not aware of a compelling public benefit to reducing financial assistance to individuals living as two parent families with children on the basis of their family status”. Now that is real fairness!

The statement “The same data shows that a two person household with no children has almost twice (184%) the household expenses of a one person household” is inherently false.  There are many sources of information showing that it costs singles 60-70 per cent of what it costs a married/coupled family unit to live (moneysense).

For a more accurate comparison of percentage of living expenses incurred by family units, one could use living wage analysis and equivalence scales.

Two Living Wage studies for Canadian cities are Guelph and Wellington and Grande Prairie (table at end of post) show living expenses (not middle class living, but bare bones living to prevent homelessness).  In both of these studies, it should be noted that singles are not allowed the purchase or use of a vehicle.  Instead, they have to rely on transit and taxis.

The Guelph and Wellington 2013 study (livingwagecanada-FINAL)  showed living expenses for singles at $25,380, lone parent with one child $40,704, and two parent family with two children $56,796.  The Grande Prairie 2012 study (GP.pdf) showed living expenses for singles $19,284, lone parent with one child $41,844 and two parents with two children $62,844.   Calculation of Guelph and Wellington percentages for single in comparison to lone parent with a child is 62 per cent and in comparison to two parents with two children 45 per cent.  Grande Prairie percentages of single in comparison to lone parent with one child is 46 per cent and to two parents with two children 30 per cent.

(It should be noted that one of the significant differences for Grande Prairie percentages of singles to other family units is shelter where single is allowed to share a two bedroom apartment.  If $859 rent is for allowed for not shared one bedroom Grande Prairie apartment to equal one bedroom apartment in Guelph/Wellington study, then the total annual expenditure becomes  $29,592 or 70% of lone parent with one child and 47 per cent of two parent with two children.  The percentages for singles then become more closely aligned between the two studies).                                         

It is very difficult to find Canadian living wage statistics on married/coupled persons with no children as they are never included in these studies.  If a few statistics from the USA living wage studies are used (New York 2016 (counties) example single adult $21, 382 and two adults  with no children $34,582; Salem, Oregon (Salem-OR) single adult $28,140 and married couple with no children $37,536) then percentage of singles to married or coupled and no children households is calculated as 62 per cent and 75 per cent respectively.

To summarize, the Living Wage studies for Canada and USA show that percentages of singles cost of living to lone one parent one child or two person no children households ranges from 62 to 75 per cent.

The table at the end of this post using Statistics Canada data shows that singles and lone parent families are not doing very well with respect to incomes.  Present median incomes are equivalent to living wage incomes (bare minimum to prevent homelessness).  Likewise, median net worth shows these same households are at the bottom of the scale in comparison to households with two adults.

Equivalence scales have also been used to provide comparisons of costs of living between different family units (households).  The OECD (Organization for Economic Cooperation and Development) modified equivalence scale and square root equivalence scales are two examples.  The basis for equivalence scales are described as follows:  The needs of a household grow with each additional member but – due to economies of scale in consumption– not in a proportional way. Needs for housing space, electricity, etc. will not be three times as high for a household with three members than for a single person. With the help of equivalence scales each household type in the population is assigned a value in proportion to its needs. The factors commonly taken into account to assign these values are the size of the household and the age of its members (whether they are adults or children).

Table for two equivalence scales:

equivalence scales

Statistics Canada 75F0002M – Section 2 ‘The LIM and proposed Modifications’ (75f0002m) provides an excellent overview of what is happening in Canada.  This paper proposes  modifications to the existing LIM (Low Income Measure) methodology.

“The first is to replace economic family by household as the basic accounting unit in which individuals pool income and enjoy economies of scale in consumption.   Secondly and equally if not more important, household is the international standard in comparative statistical surveys of income and well-being while the economic family concept is rarely employed by other countries.  Under the proposed modification, an individual will be defined as in low-income if the household as a whole is in low-income which in turn will generate different low-income statistics.   Adopting the square root equivalence scale – the square root has declining factors for each subsequent member while the LIM scale does not, and thus flattens out after the third member.. Furthermore, under the Square Root scale one needs only consider how many people are in the family whereas using the LIM scale one needs to keep in mind both the age of family members as well as whether the family is a single parent family”.

(It should be noted that there is no perfect system, however, equivalence scales system is one method that provides a decent measure of  financial fairness with respect to cost of living assessments for all members of family units regardless of marital status).

Finally, in regards to the letter and human rights discrimination in relation to singles finances, singles are discriminated against every single day.  This  has been described in a past post.  Re Allowance Program and Credits benefits, 2009 Policy Brief, “A Stronger Foundation-Pension Reform and Old Age Security” by Canadian Centre for Policy Alternatives, page 4 (policyalternatives.ca), states:

“This program discriminates on basis of marital status as confirmed by case brought under the Charter of Rights where federal court agreed program was discriminatory and ruled it would be too expensive to extend program on basis of income regardless of marital status”.

As well, the Progressive Conservative Party has been very diligent in implementing boutique tax credits which have consistently benefited families more.  One major example of this is pension splitting in which senior married/couple household benefit, but singles get nothing.  How is this not financially discriminatory?

CONCLUSION

  • Politicians need to become more financially intelligent about what it costs singles to live in this country and the financial formulas the country is using, for example, equivalence scales.
  • Financial formulas need to include singles equally to family households.  Singles need to be Included in the financial family.
  • All household types including singles need to be included in financial disaster recovery programs with equal dignity and respect.  Singles, after all, also donated to the Red Cross program.  A solution to distribute disaster monies equally could be to use household and equivalence scales formulas.
  • Politicians, government, families and organizations like the Red Cross need to educate themselves  on  what financial discrimination is and to include singles equally in financial formulas.
  • What is not needed is more ‘organizations’ and aid programs focused on the needs of mothers, seniors, and other demographics (single adults)’.  (Habitat for Humanity does not include ever singles in their building program).  These are only band aid solutions to what is the real problem, financial inequity of financial formulas.  What is needed is for financial formulas  to treat all households fairly and equally by using equivalence scales.
  • How about another novel idea – treat benefits (benevolent programs) equally to expenditure programs (boutique tax credits) using equivalence scales.  The Alaska Permanent Funds Dividends and Ralph buck programs (money-benefit-programs) grossly discriminated against singles by giving monies to children who have not contributed one cent to the economy.  Singles paid taxes for these dollars that are distributed to children who have paid nothing.
  • Regarding financial human rights and discrimination, the government has to yet provide an answer as to why the Allowance Program and Credit benefits is being continued through to at least 2029 even though the courts ruled it to be discriminatory.


living wage in dollars

This blog is of a general nature about financial discrimination of individuals/singles.  It is not intended to provide personal or financial advice.

RETIREMENT INCOME SECURITY FINANCIALLY DISCRIMINATORY FOR EVER SINGLES AND EARLY DIVORCED/SEPARATED PERSONS

RETIREMENT INCOME SECURITY FINANCIALLY DISCRIMINATORY FOR EVER SINGLES AND EARLY DIVORCED/SEPARATED PERSONS

(These thoughts are purely the blunt, no nonsense personal opinions of the author and are not intended to provide personal or financial advice).

This blog post was updated on December 1, 2017 replacing 70% information with 1.4 equivalence scale for couples to that of singles, not 2.0.

So here we go again, several organizations, primarily Chambers of Commerce and financial planning and insurance associations, have taken out a full page in newspapers across the country for an article called “It’s time for national cooperation on retirement income security” and is addressed to Federal, Provincial and Territorial Finance Ministers (clhia).  In this article, widowed elderly are highlighted over single elderly seniors in regards to living below the poverty level.

The article talks about being proud of Canada’s retirement system.  It then goes on to say: ‘That said, there are pockets of our population who are not as well-prepared for retirement as they could be.  These shortfalls are specific to certain segments of our populations. Hence, any ‘one-size-fits all’ approach could prove harmful to the economy as a whole and be unnecessary for many.We believe that the time has come to take a targeted approach to addressing any shortfalls.  Such an approach should be national in scope..  It should be fair, so that it doesn’t introduce inter-generational transfers or require over-saving where it is not needed.  It should be cost efficient and easy to implement.  It should minimize administrative burdens for employers.  And it should be good for the economy.

There are three specific segments not on track to maintain their standard of living in retirement:

  1. A small percentage of lower-income Canadians live below the poverty level, particularly the widowed elderly.  The commitment in the federal budget to increase Guaranteed Income Supplement (GIS) payments will provide some assistance in easing this situation  But more could and should be done, such as eliminating the claw-back for a surviving spouse under the Canada/Quebec Pension Plan.
  2. Up to 25% of modest-income Canadians (say above $27,500) are not on track, largely because they do not save outside of the public system and/or do not have workplace plans.  This group could benefit most from a modest increase in C/QPP contributions that would help meet their needs.
  3. Up to a third of higher-income Canadians are not on track to maintain their standard of living in retirement because they do not have a workplace plan or don’t maximize their participation in one, or they do not have sufficient private savings.  This group as well as all Canadians should have access to a retirement plan at the workplace, where it is easiest to save.

The undersigned urge all government to pursue a national, multi-faceted approach to improve retirement income security for all Canadians’.

The article is then signed by fifteen different organizations.

Statistics show that in 2014 there approximately 6 million seniors age 65 and over.  From BMO “Retirement for One-By Chance or By Design” (bmo) in 2008, approximately 57 percent of seniors were married; of the remaining 43 per cent of single status, 30 per cent were widowed and 13 per cent were divorced/separated or never married (ever singles).

BMO goes on to say that one of the realities for ever singles is that they lack survivor benefits.  The following table shows that ever singles and widowed persons, both with employer pensions will still probably have the same income.  For widowers with a spouse who also had an employer pension, the widower will have a higher income level from spousal employer pension survivor benefit.

income advantage senior widow over ever single2

Persons who become widowed are now ‘single’ so why should they receive special privileges like no income claw back for surviving spouses?  What do ever singles and early divorced/separated persons get that is comparable?   Studies repeatedly show that according to equivalence scales (equivalence-scales) it costs a married/coupled person family unit without kids 1.4 times that of a single person household, not double..

This blog has published several posts where it has been shown that financial advisors have no clue about the financial affairs of ever singles and early in life divorced/separated persons.  One wonders what  financial experience Chambers of Commerce have that they can comment on the financial affairs of singles.

Once again, the widowed elderly have been highlighted as an area of concern while ever singles and early divorced/separated persons are left out of the financial discussion.

There is complete financial illiteracy by most people on what it truly costs to live as a single person.  The post ‘Real Financial Lives of Singles’ (singles) gives five case studies, four of which contribute to employer pension plans, and one widowed person who has considerable wealth and is concerned that he can no longer pension split and may have his OAS clawed back.  Even with an employer pension plan it is not easy for singles to have a decent financial life.  Another post ‘Continued Financial Illiteracy of Financial Gurus Equals Financial Discrimination of Senior Singles’ (senior-singles) shows the financial silos that have been created by governments where married/coupled persons as one family unit and some widowed persons as one family unit receive more financial  benefits than ever singles and early divorced/separated persons family units.

To ensure financial equality between singles, widowers and married/coupled persons, the following measures need to be taken:

    • change financial formulas so that senior couples receive 1.4 equivalence scale only of whatever is given to a single senior person household as it costs more for single senior person household to live than it does married/coupled family units because of economies of scale
    • financial formulas should be revised to include all senior persons regardless of marital status in one financial formula.  To eliminate financial silos that benefit married/coupled persons most, delete benefits already given to married/coupled persons such as pension splitting (benefits the rich most) so that there is a level financial playing field for all regardless of marital status. (It is understood that it is expensive to raise children and  benefits given for children should last for first twenty years of the life of the child. However, beyond the twenty years of the children, any other benefits given to married/coupled persons should be deleted or revised to a rate of 1.4 to that of a single person)
    • create a side-by-side list of all possible benefits under categories of married/coupled, widowed and single and analyze what each category gets in benefits.  Financial formulas should be created equally for all categories, not just the married/coupled and widowed.
    • delete allowance benefit that has been ruled to be discriminatory by the courts
    • education, education and more education on financial literacy for singles.  Think tanks, financial gurus and married/coupled people need to educate themselves on what it really costs singles to live.
    • financial benefits should be income-tested for all family unit types.  Income testing should include housing and savings.  It is likely to cost ever singles more to live as they are more likely to rent while widowers are more likely to own their own homes.
    • all financial formulas for singles should include ever singles, early divorced/separated persons and widowers on an equal basis.

This blog is of a general nature about financial discrimination of individuals/singles.  It is not intended to provide personal or financial advice.

HOMELESSNESS IN CANADA BIGGER PROBLEM FOR SINGLES AND POOR SINGLE PARENT FAMILIES

HOMELESSNESS IN CANADA BIGGER PROBLEM FOR SINGLES AND POOR SINGLE PARENT FAMILIES

These thoughts are purely the blunt, no nonsense personal opinions of the author and are not intended to provide personal or financial advice.

(The author of this blog applauds Ron Kneebone and Margarita Wilkins for their study on homelessness for single employables in this country.  Words in italics are the words of the author of this blog.  Caveat: While we don’t agree with everything that comes out of Schools of Public Policy, we agree with the premise of this study, that is, single employables (singles and single parents) are having a very difficult time surviving on low wages and lack of affordable housing.)

The following excerpts are taken from “Shrinking the need for homeless shelter spaces” (policthat is, yschool.ucalgary.ca) by Ron Kneebone and Margarita Wilkins from the University of Calgary School of Public Policy and the opinion letter “The secrets of reducing homelessness” (calgaryherald) by Ron  Kneebone also refers to this study.

‘In 2009, an estimated 147,000 people, or about one in 230 Canadians, stayed in an emergency homeless shelter.

….The chronically homeless, whether for long periods or with repeated episodes, are a minority (one-third due to personal challenges (sic such as alcoholism and drug addiction) not immediately associated with the economic conditions of the city in which they live) of those experiencing homelessness.  An implication is that the majority of emergency shelter beds are provided to meet the needs of people who experience homelessness for short and infrequent periods and do so as a result of poverty.  The remaining two-thirds of shelter beds are filled by people who make relatively infrequent use of shelters and are more likely forced into shelters by economic conditions….

A role is also possibly played by discrimination in the housing market; discrimination that leaves some people with no option but to use a shelter and for social agencies to provide for them.

But our main focus was on housing affordability. We found that cities where the income support provided by the provincial social assistance system to a single person was small relative to rent — that is, in cities where housing was expensive for a very poor person — social agencies found it necessary to provide more emergency shelter beds.

The policy implications of this result are clear; increase the affordability of housing to very poor people and the need for emergency shelter spaces will fall. There are a number of ways of accomplishing this goal and it would likely be wise to act on all of these policy fronts…

We show that providing a relatively small income increase — just $1,500 per year — to single people on social assistance would enable the closing of about 20 per cent of emergency shelter beds.

Attacking housing affordability from the other side, by reducing housing costs, would also be effective. There are many options available here, from increased rent supplements to tax and regulatory changes that enable housing to be built that is affordable to those with low incomes….

  Policy-makers need not focus too narrowly on just a few policy responses, and need not rely solely on publicly funded construction of low-income housing.  Many, more subtle, adjustments to policy levers can have equally important influences on the housing market and hence homelessness….

…We continue to be perplexed why governments fail to index for inflation the income support provided to those in poverty….

…two broad sets of policy responses are possible, those aimed at treating causes of homelessness closely tied to individual circumstances and those aimed at treating causes of homelessness related to housing market conditions….

…The theoretical connection between homelessness and housing market conditions is straightforward:  even if one can pay for the minimum quality of housing available in a city, if there is little income left over for other of life’s necessities (food, clothing, etc.) one might rationally choose to forgo conventional housing and try one’s luck doubling up with relatives or friends, or temporarily using a city’s shelter system.  Thus, to the extent that minimum-quality housing is priced such that it would consume an extremely high proportion of one’s income, a person may become homeless….

….Rapid population growth and strong labour markets (sic such as occurred in cities like Vancouver, Toronto, and Calgary) influence prices by increasing the demand for housing. For those unable to benefit from strong economic growth, housing costs can quickly rise out of reach. Changes in income distribution may also play a role as the types of housing available in a city with income skewed toward the high end will differ from housing options available in a city with income skewed in the other direction.

Public policy choices can also be expected to influence the affordability of housing.  Interest rates and tax policies influence the housing market by affecting new construction costs, the costs of rehabilitating old buildings, and the costs of maintenance and building abandonment….

…Report by TD Economics. (Affordable Housing in Canada):  Using data from 2002, the report provides information that allows one to identify what percentage of the total cost of building a modest rental apartment is due to local infrastructure charges, application fees and building permits. These local charges ranged from a low of 1.7 per cent of total cost in Montreal to a high of 11 per cent in Ottawa. In a study using U.S. data, Stephen Malpezzi and Richard Green show that moving from a relatively unregulated to a heavily regulated metropolitan area increases rents among the lowest-income renters by one-fifth and increases home values for the lowest quality single family homes by more than three-fifths. The largest price effects of such regulations occur at the bottom of the distribution in units that are disproportionately occupied by low- and moderate-income households….

…The influence seems to be large; providing an additional 100 rent-assisted units has been shown to reduce by four the number of people experiencing homelessness (from How to House the Homeless)….’

When conducting the study, Kneebone and Wilkins used the following variables:

‘….Our dependent variable is the number of emergency shelter beds (Beds) provided in each city as a fraction of that city’s total adult population (Pop). Our key policy-sensitive determinant of that dependent variable is a measure of housing affordability, the ratio of a relevant income measure to a relevant measure of housing cost….

…Our measure of income is the amount of social assistance income provided to a person defined in provincial social assistance programs as a single employable (Income). A person classified in this way is single and without an impediment to employment that is recognized by the provincial social assistance program. Our measure of housing cost is based on the average amount paid on a one-bedroom rental unit (Rent).

We use as our measure of income the aforementioned amount of social assistance paid to a single employable for three reasons.   First, the vast majority of homeless shelter users are single. Second, people most likely to experience homelessness are mainly, as emphasized by Burt et al.,  the “poorest of the poor.” At an average annual income of about $7,500 (our data are for 2011 and vary by province), social assistance is the income of last resort for a single person deemed healthy enough to find employment. Finally, our focus is on identifying public policies that might influence the perceived need to provide emergency shelter beds.  One possibly important policy lever is government-provided income support to the income-demographic group most likely to use emergency shelters….

…The estimated coefficient on our measure of housing affordability indicates that a one per cent increase in the ratio of social assistance income to rent is associated with a 1.15 per cent reduction in the ratio of shelter beds to adult population. An implication of this sensitivity is that increasing the annual amount of social assistance provided to a person identified as a single employable by $1,500 per year would, by increasing the ratio of income to rent, enable social agencies to close a total of 2,599 shelter beds across Canada, a reduction of 18 per cent….

An alternative policy – or perhaps one to be introduced in conjunction with the increase in income – would be to increase the size of the rent subsidy available to those with low Income.  Our results suggest that increasing rent subsidies by $100 per month would be sufficient to enable providers to close 2,975 shelter beds across Canada. Our two policy options therefore have similar effects.

DISCUSSION Our calculations suggest the potential efficacy of an approach that favours what might be broadly described as a market solution to shrinking the need for emergency shelter beds.  This is particularly so with respect to our suggestion to provide the very poor with a higher level of income support and allow them to purchase goods and services through the market.….What is important is that the income support enables the very poor the opportunity to be able to afford housing not otherwise available to them….Providing rent subsidies is another approach we have shown can be effective at shrinking the need for emergency shelter beds. That approach is somewhat more prescriptive – the very poor must use the support on housing – but is similar in the sense that rent subsidy effectively increases the income available to the very poor to purchase more of life’s necessities. If the declining stock of affordable housing is in part the result of rising income inequality and poverty, then providing the poor with income support in these ways is a direct way of addressing the cause of the affordable housing crisis.

This non-exhaustive list of possible influences on the low-end housing market emanating from public policy choices suggests that all levels of government have a role to play in addressing homelessness and that they have a wide variety of policy levers to adjust.  Policy-makers need not, therefore, focus too narrowly on just a few policy responses.  Policy responses that have more subtle and less direct influences on the housing market than, say, the publicly funded construction of low-income housing, may have far more pervasive influences on the housing market and hence homelessness.   What’s more, more subtle policy responses may prove to be less costly to the public treasury and may avoid the potential for direct government provision or subsidization of housing units to result in reductions in the unsubsidized housing stock….It is useful to emphasize that our suggestion to increase social assistance income is a one time expenditure made necessary by the failure of policy-makers to properly adjust those payments to inflation. For reasons that are unclear to us, provincial governments do not index social assistance payments to the cost of living in the same way they index income tax brackets relevant to better-off Canadians or pensions provided to seniors adjusted by the federal government. Instead, provincial governments periodically increase social assistance payments in a haphazard effort to enable the very poor to keep up with rising costs….Indexing social assistance payments to the costs of the key drivers of the welfare of the very poor – housing and food costs – would go a long way toward enabling them to stay housed and escape the necessity of having to sometimes rely on homeless shelters.

CONCLUSION Homelessness is an exceptionally complex social problem. It has root causes in the personal traits of those most likely at risk of a spell of homelessness and the structural factors that influence the housing options available to the poorest of the poor. The unintended consequences of public policies also play a role. Our focus in this paper has been on those persons who experience homelessness as a result of what we have described as structural factors, the state of housing and labour markets that destine the very poor to be unable to afford even minimum-quality housing.

Contrary to popular belief, most people who become homeless will remain so for a few days or weeks but not become homeless again. The chronically homeless (sic due to drug abuse, alcoholism, etc.) whether for long periods or with repeated episodes, are a minority of those experiencing homelessness. An implication is that the majority of emergency shelter beds are provided to meet the needs of people who experience homelessness for short and infrequent periods and do so as a result of poverty. Our results, and similar results from research using U.S. data, suggest that relatively modest public policies can make significant differences in the perceived need to provide shelter beds. Directing support toward those for whom housing costs consume a very large share of their low incomes can have a significant impact on the number of people experiencing homelessness and thus on the need for emergency shelter beds.

….Data on the total adult population aged 15 years and over, the total aboriginal population aged 15 years and over, and the number of recent international migrants to a city are from the 2011 National Household Survey (NHS) available on the Statistics Canada website at http://www12.statcan.gc.ca/census-recensement/index-eng.cfm .

A recent international migrant is a person who lived outside of Canada one year prior to the census reference data of May 10, 2011.’ (end of Kneebone/Wilkins info.)

From “Encyclopedia of Canadian Social Work” (books.google.ca)

‘…..low rates in Newfoundland reflect severe cuts in 1996 to benefit levels for single employable persons and the low rates in Alberta reflect the steady decline in benefit levels under the conservative provincial government…. the current reality of less generous social assistance provision in Canada is reflective of the global ascendance of neo-conservative philosophies and the accompanying pressures of neo-liberal economic policies. Ideologies emphasizing individual blames, rather than collective responsibility, foster more restrictive social programs.  Restrictions to Canadian social assistance programs began in 1990 with a federal cap to limit expenditures under the Canada Assistance Plan, closely followed by provincial/territorial cutbacks through tighter eligibility criteria, lower benefit levels, and more stringent conditions.’

An example of the deterioration of social policies in Alberta was the introduction of 2001 Alberta flat tax rate of 10%.  While most of upper income level persons benefited from the 10% flat rate, the tax rate for bottom level income earners went from 8% to 10%.

It appears that the most common recipients in need of social welfare are single employable and single parents, yet the most emphasis today by governments and politicians appears to be on children of all family types when majority of focus should be placed on single parents.

Too often, current social assistance programs fail to distinguish a single employable family unit  from a married or coupled persons without children family unit.  There is no recognition that it costs a single employable family unit seventy per cent to live of what it costs married or coupled persons without children family unit.  When reviewing the literature on social programs many only look at the family units of singles, single parents with children, singles with a disability and married or coupled parents with children in their analysis.  To achieve financial fairness for singles, single person family units finances in relation to married/coupled persons without children family units also needs to be analyzed.

The single employable adult population that is often financially compromised includes aboriginals and recent immigrants.  Immigrant singles will often be more financially compromised than married or coupled immigrants with or without children family units.  An example is immigrant singles without family supports in this country working multiple jobs in order to send money home to their families (i.e. to buy necessary medications).  Some of these singles as result of over work unintentionally will suffer illnesses such as strokes from undiagnosed high blood pressure or undiagnosed diabetes or even death because they have not sought medical attention throughout their intensive work schedules involving multiple jobs.

How many different ways can it be said that Canadian singles are feeling financial despair in this country, one of the major factors being housing?

Yet another example is the financial profile of Jessica, an age 54 Ontarian single with three grown children  in ‘Home Ownership Possible But Tight’ (buying-a-home).  She would like to buy a home in the $150,000 range which is  pretty much impossible except in small town Ontario.   This is the same profile as several other presented in this blog (real-financial-lives-of-singles) Jessica has a take income of $3,315 per month or almost $40,000 per year.  Her rental income is $877 per month.  She has a company defined contribution plan.  The financial planner estimates that on retirement she will have approximately $2,300 monthly income for expenses.  Without home ownership, how does a senior single live on $2,300 per month with $900 per month rent?  If singles are unable to support themselves with a $60,000 – $70,000 pre-tax income (more than $15 per hour minimum wage), how are those at lower levels supposed to afford housing, (rental or home ownership)?

Single employables (singles and single parents) deserve the same financial dignity and respect as married/coupled persons with and without children.  Singles and single parents (white, aboriginal and of immigrant status) deserve to be included in financial formulas at the same level as married or coupled persons with and without children.

This blog is of a general nature about financial discrimination of individuals/singles.  It is not intended to provide personal or financial advice.

REAL FINANCIAL LIVES OF SINGLES

REAL FINANCIAL LIVES OF SINGLES

These thoughts are purely the blunt, no nonsense personal opinions of the author and are not intended to provide personal or financial advice.

It seems governments, decision making bodies, families and married/coupled people have difficulty understanding that many singles are in as much financial distress as they are. They perceive singles to have spendthrift lifestyles and to be poor managers of their finances.  To show how untrue this is, five cases are presented here.  Four of the cases are employed singles or divorced persons; fifth case is a wealthy widower already retired.

CASE STUDIES

Case 1-Tanis age 54, November 2, 2013, Financial Post Personal Finance Evaluation, “Frugal Lifestyles Reaps Rewards” (business.financialpost)-Single 54 year-old (divorced in 2002, left with debt of $40,000 which she paid off in five years) has take-home income of $48,000 annually ($80,000 pretax?). Two children are financially independent.  She would like to retire between age 65 and 67.  To save, she buys clothes at thrift shops, has hair done by students and volunteers at events so she can see them without charge.  Assets $215,000 home, $75,000 vacation cottage $8,500 car, $149,925 RRSPs, line of credit $8,500, mortgages $201,374 with net worth of $239, 551.  She is anxious to sell vacation property as occasional rentals are not covering mortgage costs.  Article states she has turned frugality (financial distress) into a financial strategy.  Total monthly expenses are $3,996.  She has no money left for emergencies, replacement of vehicle, or other unexpected expenses like dental, vision care or medications.  Elimination of vacation condo mortgage, fees, insurance and line of credit would free up $1500 monthly for these financial realities. If she takes advice of financial planner (2013), she should have retirement income at age 66 comprised of $12,240 employee pension, CPP $10,840, OAS 7,008, investment income of $12,516 and $12,465 from other savings for total before tax income of $55,069 or $3,900 a month after 15% average income tax.

Case 2-Public Service Canadian employees in same job/wage categories with 2013 annual income around $67,000 for never married singles, no children (calculations may vary between provinces regarding tax and other deductions).  Approximate payroll , deductions include income tax $11,000, CPP and EI $3,200, union dues $900, public pension contributions $5,300, RRSP deductions $3,500, parking $1,200, health premiums and insurance $600, for total of $25,700.  This leaves $41,300 yearly take home income.

Case 3- Doris  age 63, October 12, 2013 Financial Post Personal Finance Evaluation, “The choices:  Be a good grandma and poor or work and retire happy” (pressreader)-This generous 63 year old grandmother (divorced or single with a grown child?) has total before tax  income $47,600 ($41,600 annual earnings and receives $6,000 from roommate with whom she shares apartment). Car worth $3,000 and $10,000 line of credit for negative net worth of minus $7,000.  She is barely making ends meet now.   Monthly expenses are $3,100 per month.   Question asked: can she quit work at age of 63 and babysit granddaughter for $500 a month?  Answer is a definitive ‘no’.  She is better off to work to age 65 to get full job and Canada pensions and then could give $500.00 to daughter (who earns similar salary as her mother) to help with daycare costs.  Best financial situation is to work until age 70 to maximize her own pension and have extra money as contingency.  At age 70 she will have after tax income of $3,800 a month.  As a renter this single has to work well beyond age 65 to avoid poverty as a single senior.  (She is very generous.  If there is problem with expenses, should she be contributing $116 to her granddaughter’s RESP?  Also food budget is high at $375, but some of this might be for granddaughter and is renter paying for own food?)

Case 4–Georges age 51, August 15, 2015, Financial Post Financial Evaluation, “Should he buy first house at 51? (business.financialpost)-Georges is a production line supervisor who rents and has total net worth of $152,000.  Current after tax income is $50,244 or $4,187 per month.  Financial planner states that Georges’ problem is very simple; he cannot afford both to buy a home and build retirement savings.  Repeat:  this man, who has appearance of a responsible productive citizen working at supervisory level, is making $81,600 a year, but has been told that he cannot afford both.  Financial planner says alternatives are to buy smaller (translation cheapest) home or get better paying job. At age 65 and still renting, his projected before tax retirement income is $55,258 (with OAS at 67), and 22% tax, after tax income will be $3,590 a month with $949 surplus to do with whatever he wants.  How generous and fifteen years later his apartment will be how old with no refurbishments and likely increases in rent!!!  (Georges does have very high food and restaurant expenses.  Further economies could be achieved by reducing these expenses.  His travel costs also appear very high; however, there is no mention that he owns a vehicle so some of the travel costs may be for transit and taxi costs.  Living wage for Guelph and Wellington suggests  $221  for transit and taxi for a single person.)

Case 5-Philip  age 78, October 26, 2013 Financial Post Personal Finance Evaluation, “Strategy:  Cut the taxman’s bite” (pressreader) -Widower 78 years old wants to keep as much as of his $1million net worth for his two sons, but can no longer pension income split.  His pre-tax income of $79,450 and taxable dividends puts him in danger of 2013 OAS clawback. The article states ‘that is unfair to every person who has taxable dividends and receives OAS.  In this case his sons will receive less inheritance.  It is the fact of life for every widow and widower.’  Wow, that really is a financial hardship for him (and his sons who will receive large inheritances)!!!  How the taxes were calculated for this person is not clear.  At one point, it is stated that taxes plus OAS clawback gives a total of 48% income tax payable.  Yet, his $66,000 income per month out of total $80,000 before tax income equals a deduction of only 18%.  After expenses, it is amazing that he is able to put $3,000 into his TFSA and savings accounts.

financial case profiles

ANALYSIS

  • Frugal financial lifestyle – Many singles are frugal because they have to be (Tanis).  Word ‘frugal’ used by financial planners respectfully describes financial distress of singles.  Why not call it was it is, a  poor financial quality of life?
  • Good incomes, but have difficulties living on them regardless if renting or paying  a mortgage– Some singles in these cases are making around $80,000 before tax income which is far above average before tax incomes of many singles and families in Canada.  The MoneySense 2015 All Canadian Wealth Test (wealth-test-2015-charts) (based on 2011 Statistics Canada data) shows that the top 20% quintile of unattached individuals have incomes over $55,499.  Unattached individuals in the middle 20% quintile have incomes from $23,357 to $36,859 and are considered to be middle class.  But are they able to live a middle class or wealthy lifestyle with these incomes?  If singles are having a hard time living on $50,000 plus incomes and are unable to max out their TFSA and RRSP accounts, there is something very wrong with financial systems for singles in this country (including lower income singles). Married/coupled people are quite often able to buy additional properties like rental and vacation properties, but then have to sell them (Case 1 – Tanis) when they become single because they can’t afford them.
  • Good incomes, but it doesn’t matter how much more singles make they still gain very little from increased income.  With every $20,000 increase in income they are lucky to get maybe extra $500 a month or $6,000 a year.  This is 30% gain in disposable income to 70% loss in deductions.  If Georges gets a higher paying job, he will likely be in a higher tax bracket. (added April 27, 2016)
  • Financial planners say it is not possible for singles to have a mortgage and save at the same time, can only do one or other.  They also tell single to get better paying jobs (but Case 4 – Georges already has a very good paying job at $81,000). – When singles are already working at very good salaried and management jobs earning $60,000 to $80,000, these are not $15 per hour jobs but $30 to $40 per hour jobs.  It is also bizarre when financial planners state these high paid singles are not able both to save for a house and save for retirement and should get better paying jobs ( Case 4 – Georges).  What does this mean, singles are only able to rent and cannot have mortgages except with $100,000 plus income jobs?  Another example is MoneySense April, 2016 “Budget Basics” (moneysense) – Lindsay is 29 year old engineering consultant from British Columbia who earns $71,000.  She owns an affordable $150,000 condo (housing costs are just 30% of her income which is nearly unheard of in British Columbia) and has $46,000 in RRSP and TFSA savings (saves 20% of her salary at $400 to her TFSA and $220 to her RRSP- RRSP is matched by her employer).   She wants to save for a bigger condo so she can have a dog and a garden.  The problem, though, is her expenses are surpassing her income.  She has $11,000 line of credit and $15,000 car loan.  The suggested financial action plan is to rethink her budget and to track her true expenses, subtract them from her net income and then reallocate what is left to savings.  She is in good financial shape, but she is trying to accomplish too many things at once (so stated in article).  In other words, it is very difficult for singles to have a mortgage and save at the same time even with good salaries.
  • What expenses are missing from budgets for most singles (can’t afford)? 
  • Dental, medical, medication
  • House maintenance
  • Extra monies for savings/emergencies
  • Restaurants/vacation/entertainment
  • Computer and repair, paper, ink
  • Replacement of vehicle
  • Other fees and expenses like library/recreation/fitness/magazines, books, etc.
  • Car license, registration, motor association fees
  • Professional association fees which can be very expensive depending on profession
  • Public Service single employees during employment or retirement are not as rich as everyone thinks – Singles with public service jobs (you know those people who make so much more than private sector employees and have outrageous pensions) often don’t have any more take home pay than private sector employees.  The public pension benefits must come from contributions during their working years leaving them financially stretched during their working years (this is not a bad thing as this is income being directed to savings).  Pensions on retirement are taxed at same rate as married persons and pension splitting is not available for singles.  Survivors pensions paid to widowers are subsidized by contributions of single employees.  Many singles with or without company pensions don’t have any more income in retirement than they had during employment.  If they are paying rent or mortgage they often are as poor during retirement and have no extra money for emergencies, replacement of vehicles and medical expenses.  (They may have a better quality of life during retirement if they own their own home and are not paying rent.  In these cases the only deductions public service individuals have any control over is the personal RRSP contribution).  Based on 15 year service as public service employee and rough calculation of retirement, take home income at age 65 is may be about $3,400 a month with rent or mortgage possibly not paid in full; therefore, these persons will have to draw from savings to pay expenses or work past the age of 65.
  • Unused RRSP and TFSA contributions – Most singles, unless they are wealthy, will have multiple unused room in RRSP and TFSA savings plans because of inability to max out contributions.
  • Married/coupled persons (many, not all) have unrealistic sense of entitlement and want it to continue throughout their lives from time of marriage to date of death – Case 5 – (business.financialpost) Philip wants to keep as much of his $1million net worth for sons’ inheritances, but doesn’t want OAS clawback on his income and taxable dividends.  Some married/coupled people with huge financial assets don’t want to give anything up (David 71 and Celeste 63, August 8, 2015, Financial Post Personal Finance Evaluation, “Couple fears shift to pension income”) (business.financialpost).  If they have problems during retirement, how about selling their $355,000 USA condo and winter at home in Canada?  Herb and Isabel at age 37 have so much wealth, $1.8 million, they can take two year out of country vacation and retire early and wealthy even though they have two children (Herb and Isabel, August 22, 2015, Financial Post Personal Finance Evaluation, “Vacation, Retirement hinge on real estate” business.financialpost).
  • Marital status or state of being married does not mean married people are any better at managing their financial affairs than singles (David and Celeste-need financial planning as disinterested investors with $ 1.9 million net worth, and Patricia 53, August 29, 2015, Calgary Herald, Financial Post Personal Finance Evaluation, “Debt clouds dreams of retirement at 60” who has monthly after tax income of $15,000) (pressreader).
  • Many married/coupled persons can retire before age 65, while most singles know they can’t retire until age 65 or beyond (Case 3 – Doris)
  • Shouldn’t financial systems be well planned to ensure all citizens (singles and young people) can live decent respectful financial lives without help from their parents and/or inheritances and without marital manna benefits?

CONCLUSION

Singles deserve same financial dignity and respect as married/coupled persons.  Singles need to be included in financial decision making and formulas at same level as married/coupled persons and families.

This blog is of a general nature about financial discrimination of individuals/singles.  It is not intended to provide personal or financial advice.

EVALUATION OF MONEYSENSE ARTICLES RE THE COST OF RETIRING WELL: COUPLES VERSUS SINGLES, DECEMBER, 2014 AND JANUARY, 2015.

EVALUATION OF MONEYSENSE ARTICLES RE THE COST OF RETIRING WELL:   COUPLES VERSUS SINGLES, DECEMBER, 2014 AND JANUARY, 2015.

These thoughts are purely the blunt, no nonsense personal opinions of the author and are not intended to provide personal or financial advice.

SOURCES OF INFORMATION FOR THIS BLOG POST

MoneySense, December, 2014, “The Cost of Retirement Happiness” by David Aston (couples) /the-cost-of-retirement-happiness/

MoneySense January, 2015, “Single Retirees: The Power of One” by David Aston (singles) /single-retirees-the-power-of-one/

Kudos to MoneySense-they are one of the few sources of information that identify what it truly costs singles to live in comparison to married/coupled persons.

——————————————————————————————————————–

The above articles for couples and singles were presented in two different timeframes by MoneySense.  financialfairnessforsingles.ca thought it would be an interesting exercise to combine the figures from both articles and complete an analysis of the figures for the married/coupled retirees versus the singles retirees.  (It is important to note that the definition of ‘single’ status by MoneySense is not the same definition used by financialfairnessforsingles.ca and Statistics Canada.  The only person who is truly single in the six profiles is Spencer as an ‘ever’ single person (never married, no children), while Reynolds is divorced and McDonald is widowed.  This is based on and justified by the Canadian Income Tax forms where the status of the tax filer has to be entered re status of married, single, divorced/separated or widowed and Statistics Canada definitions of marital status).

MoneySense Comments on Retirees Incomes

Couples – According to MoneySense author, a couple should be able to have a middle-class retirement lifestyle spending $42,000 to $72,000 a year including income taxes and assuming there is a paid-for home and no debt.  After tax, that will leave about $38,000 to $62,000 a year to spend as couples choose.  The minimum of about $38,000 (excluding taxes) should be sufficient to cover the basics, including operating a car and eating healthy.  Money Coaches Canada advises keeping annual spending on the basics within the $25,000 to $35,000 range, while trying to ensure there is at least $10,000 for extras, (Dec. /14, article).

Singles – According to MoneySense author, a middle class single retiree should count on spending approximately $30,000 to $50,000 a year including taxes and assuming there is a paid-for home and no debt.  This is about 70% of what is required for a couple since it costs about 70% of the couple’s rate for a single to maintain the same lifestyle as a couple.

For $30,000 income, taxes would be about $2,000 to $3,000 for older singles and $3,800 to $5,100 for younger singles below age 65.  After taxes and if budget is tight, singles should allow at least $20,000 to $25,000 a year for the basics (including shelter, groceries, transportation and clothing) and at least $5,000 for the extras like entertainment and travel, (Jan. /15, article).

Detailed Financial Information

Couples

Case #1 – It is stated that the Taylors live frugally but comfortably.  They have a paid-for three-bedroom home in a nice neighborhood and a ten-year old mid-level car. They eat out occasionally and take regular vacations.  They spend just over $25,000 on the basics, which leaves enough left over to spend almost $12,000 on the extras.  They both have university educations and held high-paying jobs in the technology industry while raising one child, who now lives independently.  Their modest spending habits allowed them to build their savings quickly while working, so they were able to retire in their early 50s and have a large nest egg.

Many advisers tell prospective retirees that they need to replace 70% to 80% of the peak income they had while working, but the Taylors live on less than 20% of the $250,000 they earned while working.

Case #2 – The Statscan couple depicts the average spending by senior couple.  (Source: Statistics Canada, Survey of household spending in 2010) plus inflation adjustments using the Consumer Price Index.

Case #3 – The Coopers, both close to 70, have lots of money to do the things they consider important, but don’t live a lavish lifestyle.  They spend modestly on the basics, which leaves plenty for the extras that give them the most satisfaction, like travel.  Their basic spending, at just under $45,000, isn’t much more than that of the Statscan couple.  But by economizing on the basics, they can afford to spend about $36,000 on the extras.  They learned frugality early on in life.  During their working years, they lived on his public sector professional salary while she had primary responsibility for the household and raising three children.  They also benefitted from his pension plan and saved by living well within their means and invested wisely. They have two vehicles (buy them used and keep them well beyond ten years).  Now they have far more money than they need to support their accustomed lifestyle.

The Coopers love to spend money for the benefit of their extended family.  They have a two-bedroom condo in the city as well as a vacation property.  They use their $16,000 travel budget for regular vacations.  They even spend some of their budget to cover the cost of extended family joining them on vacation.  They also contribute to their grandkids’ RESPs.  And while the $6,000 they budget for charitable and personal gifts is not enormous, they have distributed around $500,000 to their kids over the years to give them a good start.

Singles

Case #1 – ‘Ever’ single Spencer is in her early 60s and had to stop working at her physically demanding public sector job over a year ago due to a repetitive stress injury.  She hopes to return to work in some role, but even if she is unable to work again she feels she can live comfortably and sustainably on what she now has in savings, as well as government and employer pensions.  She has a $38,000 budget and pays $5,000 in income tax. Based on having a paid-for home she will spend about $23,000 on basics which leaves about $10,000 left for the extras.  She recently made the choice to move to a small town, mainly for the small town lifestyle, but also for the lower cost of living as well.  Money has been set aside to purchase a modest home.  (She does state that earlier in life she had some bad spending habits; however, she has learned to make careful, purposeful spending choices).

Case #2 – Reynolds in her early 60s (split up with her partner about ten years ago and no children?) is intent on making the most of retirement and has above-average means to do so.  Recently retired after a career in the public sector, she has a budget of $73,000 a year, including about $33,000 for the basics, and a sizeable $25,000 for the extras.  She likes to travel and has about $6,000 a year allocated to it.  In the early years of her career she was fixated on saving, which helped provide the ample nest egg she has today, including a group RRSP.

Case #3 – McDonald, a widower in his late 60s, has an above average budget of about $81,000, including $41,000 for the basics and $21,000 for the extras.  He uses his money to support hobbies, travel and spending on his two grown children and their families.  He is trying to find a balance between spending his money and leaving a large legacy.  He takes two to three trips a year with his $10,000 budget.  His budget also covers some travel for his children and relatives.  He spends quite a bit on groceries and restaurants, including paying for meals with extended family.  He happily spends less than his ample means would allow.

Qualifying Statements by MoneySense about the two articles

The MoneySense author along with Money Coaches Canada notes that the category ‘shelter’ includes property taxes, utilities, maintenance, house insurance, rent and mortgage payments.  Case #3 Statscan figures include a small proportion of costs attributable to a second home.  For the ‘vehicle’ category, $2,000 a year has been added for depreciation.  The category ‘home and garden’ includes cleaning supplies, furnishings, appliances, garden supplies and services.  The category ‘recreation and entertainment’ includes computer equipment and supplies, recreation vehicles, games of chance, and educational costs.

The author also makes the following qualifying statements: “If you are single, you know that retirement planning is tougher for you than it is for couples.  You have no one to rely on but yourself, and you can’t share expenses or split income.  As a result, you can’t just take the cost of retirement for couples and divide it by two. Situations vary, but a single person will need to spend roughly 70% as much as a couple to enjoy an equivalent lifestyle in retirement…The figure for couples isn’t twice the figure for singles–it is only about 40% higher because spouses are able to share costs for things like housing and cars.  The higher per-person income singles need also results in higher taxes”.

Table

The following table combines the financial profiles of the three couples and three singles from the two articles into one table.

Following the table are financialfairnessforsingles.ca comments evaluating the results of the financial profiles.

moneysense cost of retiring well

Analysis of the Financial Profiles of Couples Versus Singles

Marital Status

First, it is important to get one fact straight.  Couples who divorce/separate and persons who are widowed are not singles.  The only person who is truly single in the six profiles is Spencer as an ‘ever’ single person (never married, no children).  The profile of the ‘ever’ single person shows that she is likely at the bottom of the financial status list in terms of wealth as she is the one with a modest home in a small town where it is cheaper to live.  The separated person likely has a better financial profile because she was able to accumulate wealth as a coupled person for twenty-five or thirty years and was separated later in life (if she had separated earlier in life, she likely would have a financial profile more equal to the ‘ever’ single profile).  All of the other profiles show that they have more wealth and homes in nice neighborhoods and even second homes (Coopers).

Benefits

Marital status also determines who is likely to have more benefits.  It can be assumed that the couples have the higher financial status simply because they are married or widowed.  The married profiles will most likely pay less income tax than the single profiles because couples receive two of everything, have the ability to pension split and can get survivor benefits when widowed, etc.   As retirees, the two profiles that lose on benefits are the ‘ever’ single person and the person who is separated.

It is stated that most of the couples have lived so frugally that they now have more money than they need, but at same time have three bedroom houses in nice neighborhood, vacation home, and can retire in their 50s and 60s with a very comfortable lifestyles.  This implies, even with frugality, they had plenty of money to spend and save as married/coupled families with children.

The single person is the one that has to move to a smaller town to lower living expenses while others are living in what appears to be substantial housing.

Taxes

On examination of the profiles, it is easy to see that the persons who are paying the most taxes are the ever single person, the separated person and the widowed person.  The Taylor couple pays the same taxes as the ‘ever’ single person (Spencer), but they have approximately $5,000 more in income and appear to have much more wealth in terms of assets (must be the pension splitting).  It pays to be married.  The Statscan couple pays less income tax (almost one half of the amount equal to 13.4%) than the separated Reynolds person (20%), but her income does not come even close to double of the Statscan couple.  The Coopers are paying only $20,000 on $100,000 income (20%).

The widowed person (McDonald) with all of his wealth is most likely receiving survivor benefits.  Did he pay extra for these benefits and why is he portrayed as being single?   If he is now single why should he receive anything more than the ‘ever’ single person and the separated person?

Benefits to Families of Coupled People

The profiles of the coupled persons and the previously coupled person (widower McDonald) blatantly state that they have more money than they can spend and have given generous monetary gifts, paid for the meals of their kids, grandchildren and extended family members, etc.

Married/coupled people or previously coupled people are often able to give exorbitant gifts, inheritances, etc. to family and extended family.  Does this not create a sense of entitlement for family, children and grandchildren who begin to expect this all the time? How does this extravagance teach frugality?

Emergency Monies

Where in any of these profiles has money been set aside for emergencies?  The person most likely to be unable to pay for financial emergencies due to illness, financial issues, etc. is the ever single person with the least accumulation of wealth.

Education, Education, Education!!!

It is beyond comprehension on how governments, families, society and think tanks lack knowledge and are financially illiterate on the true facts of how ‘ever’ singles and divorced/separated retirees are financially robbed to subsidize married/coupled retirees by paying more taxes while getting less benefits like pension splitting and widower benefits in this country.

Singles require 70% of the income/wealth of Couples

How many ways can this fact be stated and how many different sources of information does the government and society need to make changes on how singles are financially discriminated against in this country??  Do Members of Parliament ever think to include singles when making important decisions like pension splitting and benefits that benefit only the married/coupled and families of this country?  Government, businesses, society and media only ever talk about middle class families. Singles meanwhile have been financially discriminated against by their government and society.

 How expensive is it to raise a child?

So how expensive is it to raise one child, two children, and three children and still come out on top in terms of wealth in the personal profiles?  Governments, society and families, think tanks continue to talk about how expensive it is to raise a child, and yet many families are able to leave large legacies/inheritances to their children.  Unfortunately, based on the facts this seems to be based on the half-truths and lies of governments, society, families and think tanks.

Profiling

Singles are often profiled as having excessive spending habits/lifestyles while married/coupled persons are usually profiled as being frugal.  Married/coupled persons in their retired state are still profiled as being frugal even though they can give extravagant gifts (in one case around $500,000) to their children and grandchildren and spend more money on items like vacations.

 Happy, happy, happy!!!!!

In both articles the profiles and the author comments seem to imply that everyone is happy, happy, and happy with their financial status.  ‘Ever’ singles and divorced/separated retirees are blatantly told they should be happy with what they have even though they have been discriminated against financially.

‘Ever’ single persons and divorced/separated persons not so lucky to have achieved equivalent wealth (70%) of married/coupled persons as shown in above examples wish to state they are not happy with being financially discriminated against on every level of government and society.  They are not asking for more than married/coupled people.  They are asking for financial fairness.

FINAL STATEMENT

Governments, businesses, society, families, think tanks all maintain that the middle class is being affected most by poverty.  The real truth is that ‘ever’ singles, singles with kids, persons divorced/separated early in marriage/coupling, and families with low incomes are being affected most by poverty.  Singles (‘ever’ and divorced/separated) in this country are not happy with always being excluded from financial formulas and conversations.  They are human and in their humanity are equal to married/coupled people, and it is time that they are treated with the same financial fairness, dignity and respect as married/coupled people.

This blog is of a general nature about financial discrimination of individuals/singles.  It is not intended to provide personal or financial advice.