‘SELECTIVE’ DEMOCRATIC SOCIALISM FINANCIALLY DISCRIMINATORY FOR SINGLES AND THE POOR

‘SELECTIVE’ DEMOCRATIC SOCIALISM FINANCIALLY DISCRIMINATORY FOR SINGLES AND THE POOR

These thoughts are purely the blunt, no nonsense personal opinions of the author and are not intended to provide personal or financial advice.

Democratic socialism or socialized democracy has achieved some very good things for equalization of social rights in Canada such as the Canada Pension  Plan, Employment Insurance Plan and universal public healthcare as well as human rights policies.  Also included are benefits meeting the current basic needs of society for all – care for the elderly, school systems and social security systems such as Old Age Security and Guaranteed Income Supplement.  This has resulted in improving the lives of women, First Nations, racialized Canadians, the poor and the elderly by social equalization.

Worker benefits won by unions have greatly benefited fairness in working conditions: such as equal pay for equal work, weekends off, lunch and work breaks, vacation and sick leave, minimum wage, eight hour working  day, overtime pay, child labor laws, safety and health laws,workers compensation, pensions, health care insurance, etc.  The list goes on and on.

Unfortunately, some of  the social and economic equalization has been undone by governments giving tax cuts to profitable corporations and high income individuals, giving boutique tax credits to only certain parts of the population and replacing progressive tax systems with flat tax systems.  Results of unequal social benefits include lack of affordable housing (violating Maslow’s hierarchy of basic needs), high student debt and less  job security.

Raising the minimum wage to $15 an hour has been a contentious issue.  The ruling social democratic party in the province has said it is not fair for a single parent to work 50 hours a week and then have to stop at the foodbank to feed the family.  Review of research states the premise behind ‘a minimum wage policy supported by a strong social policy is an efficient mechanism against poverty and income erosion of the poorest households.  Minimum wage is one of the instruments which can control wage disparity and in this way reduce income inequality’.

An editorial view in the Calgary Herald, April 22, 2018  ‘Meddling with Wages’ (meddling-with-wages) argues against increasing the minimum wage :

‘a higher minimum wage of $15 will add further pain to employers and hurt those the measure is intended to benefit.’

The editorial implies that the single parent referred to in above paragraph does not happen very often and only occurs for two per cent of the provincial population.  The editorial  then goes on to state that most of the two per cent are not single parents, but youth getting a start in the labour force by working part time while living at home.

‘ The minimum wage was never intended to be something a single person could support a family on.  Raising the minimum wage….further imperils the the viability of small businesses and creating greater incentive to trim by shedding jobs and cutting hours.

Canadians are helping low-income families through generous supports from both the federal and provincial governments .  More should be done to lift people out of poverty, of course, but it should be achieved with programs that boost their skills and increase their employability.  It should  not be done by clumsy government meddling.’

Blog author’s comments:  Writer states that the minimum wage was  never intended to be something a single person could support a family on. Really?  REALLY?   The premise behind a minimum wage policy supported by a strong social policy is an efficient mechanism against poverty and income erosion of the poorest households.  Minimum wage is one of the instruments which can control wage disparity and in this way reduces income inequality.  To say that a young person still living at home does not deserve a wage equivalent to a single parent is like saying all those persons working in sweatshops in Bangladesh also don’t deserve a wage equivalent to the same jobs performed in non-third world countries.  Also, raising the minimum wage helps the economy through increased spending on the necessities of life and more taxes being paid to support social programs.

Two reader comments put a proper perspective on the results of not increasing the minimum wage.  First comment (from Canadian Poverty Institute at Ambrose University) ‘Businesses should pay decent wages’ (pressreader):

 ‘…..If  minimum wage had kept up with inflation, it would be around $15 today.  While education and training programs may reduce poverty, demands for austerity would cut exactly these programs.  In abdicating responsibility to pay decent wages, business uploads the cost of low wages to government.  Poverty costs the provincial government $7-9 billion annually.

A business model based on poverty wages is untenable. Decent wages are the cost of doing business.

Ensuring a decent income is a shared responsibility.  Individuals are doing their part by working.  Business must do its part by paying people appropriately, not relying on government and taxpayers to pick up the tab.’


Opinion letter from second reader ‘Creating a more humane province’ (pressreader):

‘By concentrating heavily on the economics of the minimum wage (and indeed, low wages in general), the editorial misses the central point that wages are more about increased opportunity for inclusion and participation.  To deny an expansion of these dimensions to low-income workers, simply because of stereotypes, economic short-termism and the assertion that only two per cent of people actually work for minimum wage, reflects a fundamental misunderstanding of what it means to be a citizen of this province.

I’m glad our provincial government continues to act in the interests of ordinary citizens and realize that the expansion of justice has a cost.  A higher minimum wage, together with the provision of living wages, is the price we can and should pay for the creation of a more just, humane and inclusive province.’

Then there are those who have no regard for left-wing politics.  An example is Calgary Herald editorial comment: ‘How soon we forget the economic carnage of left-wing policies’ (calgaryherald). The argument made is that:

‘those who ignore socialist history are doomed to repeat it…..If nobody had ever tried left-wing policies before, we might be justified in giving this “new” socialism a chance.  Unfortunately, the world has long been a laboratory for socialist policies with mostly disastrous results.

Democratic socialism has left valuable legacies – like subsidized, widely available health care and education – but also has created a lot of economic carnage.  During the 1970s, big-spending, left-wing governments in Canada, Scandinavia and Great Britain created high unemployment and sluggish growth before buckling under the weight of their taxes and debt…

……The province’s premier doesn’t understand, or perhaps doesn’t care, that raising taxes makes struggling citizens poorer, and just transfers wealth from the already wounded private sector to the public sector.

She wants to appease her union comrades by massively raising the minimum wage , which will raise inflation , hurt less profitable industries and reduce employment…..How did our collective memories become so short?’

Reader’s opinion letter ‘Right-wing policies fail’ (pressreader) in response to this editorial states:

 ‘This column is nonsense….The highest rate of unemployment in the U.K. in recent years were under the reign of Margaret Thatcher.  Currently, the only people who benefit from the right wing U.K. government’s policies are the rich.

Food banks, unknown in my younger years, are common and very necessary.

It’s also true that the province’s unemployment rate is unacceptable, but to criticize the premier is wrong.  If our economy had been less dependent on oil and gas, we would be better off.

The right-wing trickle-down economic theory is utterly discredited.’

‘SELECTIVE’ DEMOCRATIC SOCIALISM

As noted in the above, there has been much that has been good about democratic socialism, but there also has been negative outcomes to democratic socialism.  One negative is what we will call ‘selective’ democratic socialism  where certain members of society get more social benefits than others.

Examples of ‘selective’ democratic socialism:

Women not being paid same amount as men for same job – Unions have forced the private sector to enforce social benefits such as eight hour day, overtime pay, vacation and sick pay, etc., and  above all equal pay for equal work, but the private sector in many cases still has neglected to pay women the same wage for doing same job as men.

There are many who object to the wages and pensions federal and provincial civil and public servants receive. They say these employees are paid too much money, thus causing economic concerns.  The irony of this negativity is that one reason why the budgets for civil, public and union employees is higher is that women are actually paid the same wage as men doing the same job.

It would be nice if right-wing financial think tanks used some outside the box thinking and conducted studies on how much of the budgets of unionized employees is dedicated to paying women equally to men.  Or, vice versa, how much more money would it take to pay women in the private sector equally to men?

Keep minimum wages low and don’t  consider living wages ‘Selective’ democratic socialism allows the top employees (elite one per cent and the rich) to outpace wages of those at the bottom.  Then, because they have the money to do so, they will bypass the democratic social programs of health care and public schools to pay for elite services of private health care and private schools.

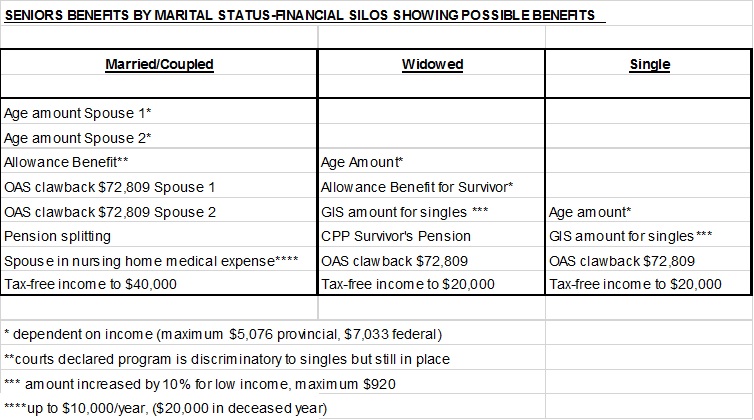
Married/Coupled person get more benefits than singles and the poor (singles often excluded from these benefits) – Many persons leaning to political right and working in the private sector view defined contribution public pensions to be unfair as they perceive money for these pensions to be coming from the public purse.  However, they also refuse to recognize that singles receiving public pensions are supporting/subsidizing the public pension plans of married/coupled persons.  While married/coupled persons are receiving their public pensions, they have been given a boutique tax credit where they get to pension split (benefit added on top of benefit), thus paying less income tax.  Singles don’t get to do this and poor married/coupled persons do  not get the same benefits from pension splitting as the rich.  Yet another level of ‘selective’ democratic socialization is added to the mix when widowed persons (who now technically are single) get a supplementary public pension from their deceased spouses.

It is very difficult for political parties to eliminate the unfair pension splitting tax credit for fear of being voted out. A solution to making the playing field fair for singles versus married/coupled persons could be to give singles a fully refundable tax break during their pension years that is equivalent to amounts received in pension splitting by married/coupled persons.   For the widowed person’s public pension marital manna benefit, a solution to remedy this could be to give the widowed spouse whatever is left of the pension in a lump sum just like single deceased persons receive in their estates upon dying.  Again, it would be nice if financial think tanks would use some outside the box thinking to evaluate how fair the public pension system is to singles versus married/coupled persons and to analyze who really is getting the bigger slice of the pie.

Affordable housing prices out of reach for singles and poor families – Another ‘selective’ democratic socialist outcome is when affordable housing solutions are put in place, but the poor still pay more per square foot  for this housing.  The housing prices are out of whack when rich proportionally pay less per square foot (often the bigger the house the less they seem to pay per square foot), but ‘ever’ singles, early divorced persons and poor families pay more.  As a result, they also pay more in housing and education taxes, real estate fees and mortgage interest charges than the rich since these are based on price and not the square footage of the housing.

What better evidence is there of this than the case where a single person from San Francisco created a  ‘pod’ in the living room of an apartment so he could have a private place to sleep instead of the couch (singles-deserve-affordable-housing). Another is ‘free rent for sex’ advertisements resulting from the out of control Vancouver housing market (pressreader.)

Then there is the insanity of the charmed lives of the rich building luxurious playhouses for their children (pressreader).  These playhouses range from $7,000 to $100,000 and may include electricity, fireplaces and cabinets.  The sleeping pod of the San Francisco single man could probably be the size of the doghouse for the pets of the children owning these playhouses.

‘Selective’ democratic socialism where families get social benefits and singles are excluded – Many government and business financial solutions and social programs appear to include only families with singles being excluded.  One example is Habitat for Humanity who build houses for families only, not singles.

‘Selective’ democratic socialism above all means FAMILIES RULE – Government and politicians in their discussions talk mainly about family, family, family and the middle class instead of talking about ‘families and individuals’.  Singles are rarely included in the discussions.  ‘Selective’ democratic socialism by definition is exclusionary and selects families to receive benefits with singles rarely being included equally in the benefits.

CONCLUSION

These are just a few examples of ‘selective’ democratic socialism.  How positive or negative democratic socialism has been is in the eye of the beholder.  However, it is very hard to say that there have been more negatives than  positives when one looks at the list of all the accomplishments of union rights and democratic socialism.

Now, if only ‘ever’ singles, early divorced singles and poor families were included equally to other members in society in democratic social formulas, the world would be an even better place.

This blog is of a general nature about financial discrimination of individuals/singles.  It is not intended to provide personal or financial advice.


CONTINUED FINANCIAL ILLITERACY OF FINANCIAL GURUS EQUALS FINANCIAL DISCRIMINATION OF SENIOR SINGLES (Part 2 of 2)

CONTINUED FINANCIAL ILLITERACY OF FINANCIAL GURUS EQUALS FINANCIAL DISCRIMINATION OF SENIOR SINGLES (Part 2 of 2)

(These thoughts are purely the blunt, no nonsense personal opinions of the author and are not intended to provide personal or financial advice.)

This blog post is a comment on the Broadbent Institute Report on the economic circumstances of Canadian seniors.  The Broadbent Institute is a left-leaning social democratic think tank founded by Ed Broadbent who was a past leader of the New Democratic Party .  It describes itself as an independent, non-partisan organization championing progressive change through the promotion of democracy, equality, and sustainability and the training of a new generation of leaders.  Its mission is to “Support, develop, and promote social democratic principles for the 21st century”, “Propose new solutions for a more equal society”, and “Equip a new generation of progressive campaigners & thinkers with the tools they need to build a social democratic society through training and education”.

This post addresses excerpts from the report first (Part 1), and then is followed by comments on the report (Part 2).

COMMENTS ON  REPORT – PART 2 OF 2

In February, 2016 the Broadbent Institute in Canada and Richard Shillington of Tristat Resources published the report:  “An Analysis of the Economic Circumstances of Canadian Seniors”.       (analysis_of_the_economic_circumstances_of_canadian_seniors)

The report information is mainly directed towards poverty of seniors without an employer pension plan (roughly 47 per cent) and therefore, many of these seniors have wholly inadequate retirement savings.

(It should be noted in the report that single seniors does not refer to marital status, but the fact that they live alone.  Therefore, single seniors includes ‘ever’-never married, no kids-singles, divorced/separated, and widowed seniors living alone).

Review of the report reveals some points that are very disconcerting.

  • The true facts of what it costs singles to live is under-reported.  Married/coupled persons and, indeed, the author of the Broadbent report do not seem to realize that the widowed (married/coupled persons whose spouses are deceased) are a part of the singles population.  It is a well known fact that it costs singles approximately 70 per cent of what it costs married/coupled persons to live as a single unit.  This fact is never addressed in the report. (Using LIM 11.1 percent of seniors live in poverty–719,000 seniors:  419,000 singles and 250,000 living in an economic family.  The poverty is astonishingly high at almost 30 per cent for senior singles without employer pension plans).  (Widowed persons and the extra benefits they get are discussed later in this post).
  • All the extra benefits that have been given to married/coupled persons are never addressed.  Governments continue to create financial silos where more and more benefits are given to married/coupled persons even though they are able to live with less because of economies of scale, but not to singles resulting in financial inequality.  (Following table was updated on March 8, 2016 with additional information).

financial silos6

  • It is ludicrous that this report does not treat home equity as a retirement asset.  Those who have to rent are at a much greater financial disadvantage than those who own their own home.  Quote from report : “ …..Many of those who argue that there is no looming pension crisis have included home equity as a liquid asset.  This analysis has not treated home equity as a retirement asset because the replacement rate analysis has as its objective an income that allows one to enjoy a lifestyle comparable to that which existed pre-retirement.  We do not include home equity here because we accept that the pre-retirement lifestyle for many middle- and moderate-income Canadians include continued homeownership”, (Page 19).

According to Statistics Canada 2011 articles “Living Arrangements of Seniors” and “Homeownership and Shelter Costs in Canada”:      (statcan.gc.ca) and (statcan)

  • The average household total income for couple-family households was about twice that of non-family households (which were primarily one-person households) and lone-parent households ($101,000 per year versus $43,000 per year and $55,000 per year respectively).  Thus, while lone-parent households and non-family households had a lower cost than couple-family households, the lower household total income results in a higher proportion exceeding the affordability threshold”.
  • Approximately 69 per cent of Canadians own their own home.  About  four out of five (82.4%) married/coupled people own their own home, while less than half (48.5%) of non-family households (singles) own their dwellings.  Just over half (55.6%) of lone-parent households own their dwelling.  (It stands to reason that more senior married/coupled and widowed persons will own their own homes, while senior singles–‘ever’ single and early divorced)–are more likely to have to rent placing them in greater income inequality and a lower standard of living and quality of life). Regardless of housing tenure, the proportion of non-family households and lone-parent households that paid 30% or more of total income towards shelter costs was about twice the proportion of the couple-family households.
  • Quote “approximately 56.4 per cent of the senior population (5 million total seniors in 2011) live as part of a couple and about 24.6 per cent of the senior population live alone (excludes those living with someone else, in senior citizen facilities and collective housing).

Singles are constantly told to ‘go live with someone’ when they have difficulties paying for housing; meanwhile married/coupled and widowed persons may be living in their big houses (enjoying the same lifestyle they had before pre-retirement) and seeking help with paying their taxes while refusing to move to a less expensive dwelling.  (senior-singles-pay-more-part-3-of-4)

  • It is ludicrous for this report to state that seventy per cent  income replacement should be a benchmark in the formulas.  Seventy per cent income replacement is entirely different for those who own their own home versus those who rent.  It is selfish to think that the rich and married/coupled persons should be able to live same lifestyle post-retirement as pre-retirement when singles and early divorced generally will have a poorer lifestyle throughout their entire lives.

An example is the Financial Post financial evaluation “Bright Future Despite Big Debt, Small Income” published in Calgary Herald on February 20, 2016 where Ontario young couple’s after tax income is $4,800 per month and their food budget is $800 and entertainment $160 per month for two people.  Just these two items are 20 per cent of their budget.  Either they live in an area with very high food costs or they are living the high life for one of the necessities of life in Maslow’s Hierarchy of need.  Seventy per cent replacement at retirement would give this couple an unreasonably high style of life for food in comparison to singles.   Reader letter mentioned above in ‘senior-singles-pay-more-part 3-of-4’ link suggested singles should be able to live on just $200 per month for food.

  • It is ludicrous to suggest that persons without employer pension plans cannot save, especially those with incomes over $100,000.

Quote from report:  “For those with incomes in $50,000-$100,000 range, the median value (savings) is only $21,000” (Page 3).

If those with pension plans have forced saving, it it is ridiculous to say that those without pension plans are not able to save.  For example, a $75,000 before-tax income may result in $600-$700 per month being deducted from pay cheque (employer deductions are excluded in this discussion).   It is also ridiculous to say that in this First World country persons with $100,000 plus incomes cannot save.  One of the principles of good finances is to save 10 per cent.  Whole report promotes greed of looking for more benefits and not planning for the future if there is no plan for saving during working years.

  • Reporting false information on marital status is a crime.  Quote from report states:  “Table 7 represents the results of increasing the single and married GIS amounts by the same percentage.  One should keep in mind that there is an incentive for seniors to appear as singles to governments even if they are living as a couple.  This is because the GIS for senior couples is less than twice the amount for singles.  An increase in the GIS for singles only (with no increase for couples) would increase this so-called ‘tax on marriage’ and associated incentives.  This would encourage couples to hide their cohabitation from the authorities for financial reasons”, (Page 21).

GIS for senior couples should, repeat, should be less than twice the amount for singles.  Singles (particularly ‘ever’ and early divorced singles including the author of this blog) have worked very hard to have financial formulas include singles at 70 per cent of married/coupled persons living as a single unit.  The GIS for senior singles is more than married/coupled persons because it costs more for singles (including widowed persons)  to live than it does for married/coupled persons living as a single unit.  Why can’t married/coupled persons understand this?  When married/widowed persons become widowed their living costs will go up.

The statement  “An increase in the GIS for singles only (with no increase for couples) would increase this so-called ‘tax on marriage’ and associated incentives. This would encourage couples to hide their cohabitation from the authorities for financial reasons” is absurd and selfish.  Tax on marriage, why can’t married/coupled persons realize all the extra benefits they receive as outlined in table above???  When is ‘enough’ ever going to be ‘enough’ for them???

The notation (# 28) at the bottom of page 21 states:  “While legislation treats those cohabiting the same regardless of their marital status, it is easier to deceive the government if you are not married”.  This statement is false and backwards.  If it is anyone being deceitful, it is the married/coupled persons.  Can someone explain why it would be easier to deceive the government if you are not married (‘ever’ single)?  The issue with false reporting lies with those who are married/coupled, divorced or separated.  They are trying to ‘milk’ the system by falsely reporting their marital status even though the Canada Revenue income tax rules clearly define the parameters of marital status.

False reporting is a crime.  It would be very easy to track deceit by following income tax declaration of marital status and address of residence over several years.  Deceit of married/coupled persons would incrementally increase the monetary value they would receive from the deceit as it costs them less to live as a couple than it does single persons.

It seems married/coupled persons want it all even if they have to lie about it.  So what will they do when their spouse goes to a nursing home or is deceased?  In order to collect the benefits they are entitled to as one spouse living at home and the the other in a nursing home and widowers, they will need to lie again and change their marital status from single to married/coupled or widowed when filing their income taxes.

‘Ever’ singles (never married, no kids) throughout their entire working lives pay same amount of taxes as each individual (with equal income to the single person) reporting income tax in a married/coupled relationship and have supported/subsidized families who use mom/baby hospital care, EI benefits for maternal/paternal leaves, etc.  They are never recognized for their tax support and for using less resources than families.  Since singles have paid supportive taxes throughout their entire working lives, they deserve to live with the same financial dignity and respect as seniors and as married/coupled persons.  As seniors, ‘ever’ singles deserve to have their own space and their own bathroom and not be forced to cohabitate with other persons.

The real financial lives of singles is revealed when a simple math calculation is used for the targeted tax relief where a single senior can now earn $20,360 and a senior couple $40,720 before paying federal income tax.  This so called tax relief for seniors allows federal tax relief for singles equal to $1,697 per month and for senior couples $3,393 per month.  The tax relief for senior singles hardly covers a rent or mortgage payment of $1,200 and $250 for food per month (Maslow’s Hierarchy of Need), but amply covers this amount for a senior couple.  For a couple $1200 for rent or mortgage and $500 for food leaves $1693 (or 50% of $40,000) for other necessities and maybe even a nice little vacation all tax free.

CONCLUSION

It is incredible how in just a few paragraphs a think-tank can undo the hard work that singles have been trying to achieve in seeking financial equality.  Think-tanks and financial gurus continue to practice financial illiteracy on what it truly costs singles to live.   (false-assumptions-four-ways-seniors-singles-lose outand (financial-gurus-financially-illiterate-about-singles-finances)

Even though the final statement of the report states:  The GIS is the most effective federal mechanism in the short term for reducing the poverty rate and the impact of poverty on seniors, and it can be targeted at senior singles who need it the most”, there are many shortcomings to this report.

This report is encouraging irresponsible financial behavior.  It is morally, ethically and socially reprehensible in a First world country to say that one cannot save with an income over $100,000 and to promote financial inequality and discrimination of singles.

The Broadbent Institute is supposed to be about ‘a more equal society’, so where is the financial equality?

SOLUTIONS

In order to ensure financial equality between singles (including widowers) and married/coupled persons the following measures need to be taken:

    • change financial formulas so that senior singles receive 70 per cent of whatever is given to married/coupled senior persons as it costs more for singles to live than it does married/coupled persons because of economies of scale
    • financial formulas should be revised to include all senior persons regardless of marital status in one financial formula.  To eliminate financial silos that benefit married/coupled persons most, delete benefits already given to married/coupled persons such as pension splitting (benefits the rich most) so that there is a level financial playing field for all regardless of marital status. (It is understood that it is expensive to raise children and  benefits given for children should last for first twenty years of the life of the child.  However, beyond the twenty years of the children, any other benefits given to married/coupled persons should be deleted or should also be given equally to singles at rate of 70 per cent)
    • create a side-by-side list of all possible benefits under categories of married/coupled, widowed and single and analyze the total value of benefits in each category (see table above).  Financial formulas should be created equally for all categories, not just the married/coupled and widowed.
    • delete allowance benefit that has been ruled to be discriminatory by the courts
    • education, education and more education on financial literacy for singles.  Think tanks, financial gurus and married/coupled people need to educate themselves on what it really costs singles to live.

(These thoughts are purely the blunt, no nonsense personal opinions of the author and are not intended to provide personal or financial advice.)


TFSA BOONDOGGLE FOR SINGLES AND LOW-INCOME CANADIANS

TFSA BOONDOGGLE FOR SINGLES AND LOW -INCOME CANADIANS

These thoughts are purely the blunt, no nonsense personal opinions of the author and are not intended to be used as personal or financial advice.    

Comment: This article was previously published in a local newspaper and is available on the internet. There were 51 recommends for this article. The final outcome (dependent on the results of the October 2015 Canadian Election) was that proposed changes to increase the TFSA to $10,000 by the Conservative party election promises was reverted back to $5,500 by the successful Liberal Party under Prime Minister Justin Trudeau . Regardless of what the TFSA limit is, with no cap on the contribution amounts, individuals/singles will still be at a significant financial disadvantage to married/coupled persons. Wording has been slightly changed from the original publication but does not change the thought content of the original publication (changes and additions to wording have been italicized).

The Federal Progressive Conservatives had in their infinite wisdom proposed in an election promise that the Tax Free Savings Account (TFSA) limits be changed from $5,500 to $10,000 per year.

To show the effects of having just $5,500 as a contribution amount for married/partnered versus individual/single Canadians, everybody sharpen your financial pencils and dare to do this simple math exercise-calculator not required.

Step 1 – Create two columns, one labelled married/partnered, the other individual/single. In each column for year 1 enter $11,000 for highest possible contribution for both spouses, and $5,500 for a single. Continue up to year 5 or up to year 40 (suggested number of income producing years). Then total the amounts in each column. At year 5 married/partnered total will be $55,000, single amount will be $27,500.

Step 2 – Now using the ‘Rule of 72’ https://en.wikipedia.org/wiki/Rule_of_72 -calculate the amount of possible compounding interest, investment income that can be generated from amounts in each column. Rate of return of 7 per cent will double the bottom line amount in 10 years and double again in 20 years and so on. Okay, you can use a calculator for this step!

Step 3 – Create a graph for amounts in each column, one for married/partnered totals, another line for individual/single totals. Each step in the graph could be shown for every five years up to forty years.

Results for $5,500 contribution (not including investment or interest amounts) amounts are shown in table below:


TFSA MAXIMUM CONTRIBUTIONS PER YEAR FOR MARRIED/PARTNERED VERSUS SINGLES

NOTE: Does not include potential compounded interest/investment income

TFSA TOTAL        Married/Partnered    Individual/Single

Year 5                      $ 55,000                       $ 27,500

Year 10                     $110,000                     $ 55,000

Year 15                     $165,000                     $ 82,500

Year 20                     $220,000                     $110,000

Year 25                     $275,000                     $137,500

Year 30                     $330,000                     $165,000

Year 35                     $385,000                     $192,500

Year 40                  $440,000                    $220,000

tfsa graph

This simple math exercise, which takes TFSA financial amounts down to the lowest common denominator, shows the proposed $10,000 yearly TFSA (all tax free!) would exponentially increase the wealth of married/partnered and high-income Canadians, while flat-lining the wealth of singles and low-income Canadians.

Add in Registered Retirement Savings account (RRSP) amounts with potential investment growth and wealth spread becomes even wider.

Thank you, Progressive Conservative Party for failing this simple math exercise, lining your own pockets just because you are married/partnered and wealthy, lining the pockets of married/partnered and high-income Canadians to levels of untold wealth while kicking off the financial bus individuals/singles and low-income Canadians who are unable to max out TFSA and RRSP contributions or make contributions to both programs.

Shame on Finn Poschmann, V.P. and Director of Research, C.D. Howe Institute for also failing this simple math exercise. In the Calgary Herald, “Popularity of TFSAs could mean lifetime cap in the future”, April 23, 2015, page D3 and business.financialpost.com/personal-finance  he states:

“That is absolutely fantastic, when you picture a world where a huge share of Canadians are retiring and living for a very long time, knowing that they have significant savings on hand. And there will less draw on public support programs which is also great….” He further goes on to state: “When TFSAs do become big, they may be a political target, and a financial target for government. However, it would be morally wrong for government to turn course, then, and go back on the commitment made to savers when they are doing their saving. So changing the tax rules retroactively would be very, very bad”.

Who are your financial advisors that would lead you to such an off-balanced decision and statement? Why would think tank persons, who are supposedly critical thinkers, and politicians make such a morally unfair decision to increase TFSA amounts without a cap in the first place and then think it is morally wrong for government to change course after the morally unfair decision has been made? This decision does nothing to erase the use of public support programs as only the wealthy will benefit from raising the TFSA amount.

It is no wonder that Canadian individuals/singles with and without children and low-income persons are in financial despair, repeat, financial despair. With governments, businesses, society and families giving financial preference and perks to married/coupled people and full complement families with two heads of households, individuals/singles are repeatedly having to pay more and get less and can’t even remotely begin to ever ‘catch up’ or be on an equal playing field with married/coupled Canadians.

Financial discrimination and violation of the human rights of individuals/singles and low income people must stop. There must be a cap on TSFA amounts and the cap must be put in place right now rather than later. It is socially, morally and ethically reprehensible, irresponsible and shameful to consciously make the already wealthy even wealthier at the expense of the poor.

Political parties who fail to use simple math formulations to avoid financial discriminatory policies and promises don’t deserve to be in power. Get out and vote! Individuals/singles and low income Canadians, contact your Members of Parliament regarding the financial discrimination of singles and low income persons! (Election took place in October, 2015 with the Liberal party winning a majority and TFSA amount remaining at $5,500).

Lost Dollars Value List

Stay tuned, this is a work in progress and will hopefully appear in future blog entries.

(This paragraph on lost dollar value for TFSA was added April 10, 2016 – If age 25 to age 65 or forty years and annual contribution of $5,000 is calculated for maximum contribution of TFSA that can be used by spouse number two, then calculated lost dollar value equals $200,000 – $5,000 times 40 years.  This does not include amounts lost through compound interest and investment potential.)

The blog posted here is of a general nature about financial discrimination of individuals/singles. It is not intended to provide personal or financial advice.