TFSA (CANADA) – RAMIFICATIONS OF FINANCIAL DISCRIMINATION AND ABUSE OF THE PLAN

TFSA (CANADA) – RAMIFICATIONS OF FINANCIAL DISCRIMINATION AND ABUSE OF THE PLAN

(These thoughts are purely the blunt, no nonsense personal opinions of the author about financial fairness and discrimination and are not intended to provide personal or financial advice.)

This case study outlines how a financial advisor has shown it is possible for Canadian TFSA holders with large accounts to evade paying income tax for a number of years (15) and use benefits intended for low income persons by circumventing the low income assistance programs.

HISTORY OF TAX FREE SAVINGS ACCOUNT (TFSA)

The TFSA was introduced in 2009 by Stephen Harper, Prime Minister and Leader of the Conservative Party, and Jim Flaherty, Minister of Finance.

The maximum annual contribution room at present is $6,000 per year and is indexed to the Consumer Price Index in $500 increments to account for inflation.  The 2015 Progressive Conservatives raised the contribution limit to $10,000 and eliminated indexation for inflation.  However, the newly elected Liberal government re-implemented the pre-2015 contribution limit of $5,500 for 2016 which will be indexed for inflation after that.  As of January 1, 2019, the total cumulative contribution room for a TFSA is $63,500 per person and $127,000 for couples and for those who have been 18 years or older and residents of Canada for all eligible years. Any unused contribution room under the cap can be carried forward to subsequent years, without any upward limit.  There are no limits on withdrawals from TFSA accounts. TFSAs are not declared as income and, therefore, are not taxed.

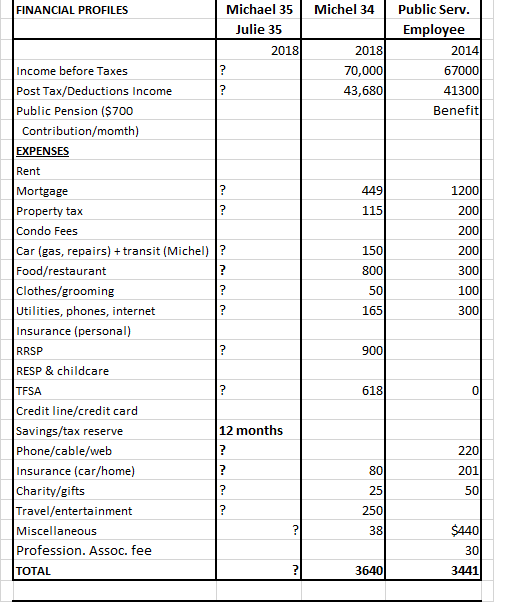
CASE STUDIES FOR COUPLE MICHAEL AND JULIE,  UNATTACHED PERSON MICHEL AND UNATTACHED PERSON PUBLIC SERVICE EMPLOYEE

(1) THEY WANT TO SPEND $50,000 PER YEAR IN RETIREMENT.  DID THEY SAVE ENOUGH? By Mark Seed, My Own Advisor and Owen Winkelmolen, PlanEasy) LINKS

Michael and Julie (they-want-to-spend-50000-per-year-in-retirement-did-they-save-enough)  $600,000 paid for home and a million dollars in retirement savings.

Sources of Income chart for Michael and Julie (Sources-of-Income-50000-per-year-.png) – they want to retire on $50,000 per year at age 55 – shows how they can avoid paying taxes for 15 years while using benefits intended for low income persons.

Net Worth chart for Michael and Julie (Net-Worth-50000-per-year-post-September-5-2018.png) at age 100 they will still have an enormous amount of wealth, especially in TFSA accounts.

(2) ALL THE FRUGALITY IN THE WORLD WON’T LET THIS 34 YEAR OLD RETIRE AT 45 by Allen Allentuck LINK                                                                                Michel (all-the-frugality-in-the-world-wont-let-this-34-year-old-retire-at-45)

(3) PUBLIC SERVICE EMPLOYEE BASED ON THE REAL LIFE EXPERIENCE (SINGLE)

Financial Profile Page 1 revised Jan. 2019 post

Financial profile TFSA holder2 page 2 revised Jan. 2019

CAVEATS – Financial information for couple in this report is limited.  It is difficult to determine if this is a real life case scenario or an example made up to illustrate what is possible for $50,000 retirement income.  As stated in the report the investment returns for TFSA remains constant for each year which is not the case in real life. It also is not possible to assess if real estate value will go up or down. It appears the couple have no children.

Financial profile for unattached individuals –  Michel’s food cost seems high (unless he requires a special diet and males require more calories). It appears he has no condo fees so he probably has expenses like condo maintenance.  Public service employee profile is based on snapshots of real life experiences of unattached persons. For the most part it closely matches the financial profile of Michel.  Food costs are replaced by mortgage costs.

Financial profiles are incomplete.  For example, expenses like medical eye and dental care and saving for vehicle replacement are not listed.

DETAILS OF CASE STUDIES FOR MARRIED COUPLE MICHAEL AND JULIE (Ontario), AGE 35 AND UNATTACHED INDIVIDUAL MICHEL, AGE 34 (Quebec)

Retirement age – Michael and Julie want to retire at age 55.  Michel wants to know if he can retire at age 45 and travel the world.  Many married couples have the ability to retire at age 55. Some would say Michel’s desire to retire at age 45 is unrealistic.  His financial advisor states that regardless of how frugal Michel is he will not be able to retire before the age of 60. Why is that unattached persons always have to be frugal and work longer?

Retirement income – Michael and Julie want a retirement after tax income of $50,000 at age 55.  Michel’s financial advisor states he unequivocally has to work to age 60 to achieve a retirement after tax income of $40,000.  There is that frugality once again!

Investment Amounts at present time – Michael and Julie’s account at present time totals $570,623 in TFSA and $423,706 in RRSP.  They have continually maxed out their TFSA accounts. Overall their portfolio has a 70/30 mix of stocks and fixed income.  A 6% rate of return on stocks and a 2.5% rate of return on fixed income is assumed for the article. They already have at age 35 a total close to a million dollars so it is difficult to figure why the amount wouldn’t be in excess of well over a million dollars in twenty years time at age 55.

Michel has $24,329 in TFSA and $90,701 in RRSP.  Calculations for retirement income are based on a 3% rate of return.

Investment Amounts at time of retirement – Estimate for Michael and Julie is stated in 2018 dollar value, not value at time of retirement, so value at retirement should be well over $1 million.  Total capital estimates for Michel at age 60 are $895,000.

Housing – Michael and Julie own a $600,000 house which they expect to own outright at time of retirement at age 55.  They plan on selling their home around age 80 and moving into an apartment or condo to rent. That might add $30,000/year to their expenses but they will have freed up almost $600,000 in real estate assets (minus 5% transaction fees).

Michel has a $165,000 condo.  He has a $97,000 mortgage with 24 years remaining amortization. At present rates, the mortgage will be paid when Michel is 58.

Income – Michael and Julie’s income is not stated, but it must be quite high to achieve the investments and $600,000  house they have at the present time. Michel has an income of $70,000 which is well above the median and average incomes for unattached individuals.

Vehicle –   Value of vehicle for couple is not stated.  The value of Michel’s vehicle is $2,500 which must be pretty much a “junker”.

How Michael and Julie will achieve their goal of retirement income of $50,000 as outlined in article

Because all their retirement savings are inside registered accounts such as their TFSAs and RRSPs, Michael and Julie have a lot of control over withdrawals and allows them to reduce taxes and optimize government benefits like CPP, OAS, and GIS.

To start, Michael and Julie will withdraw just enough from their RRSP to maximize the basic tax exemption, the rest of their income will come from their TFSA. This mix of RRSP and TFSA withdrawals (with no other income sources) will help them pay virtually zero taxes for the first 15 years of their retirement.  This will take them from ages 55 to ~ age 70.  (In the process they will have gained  almost $135,000 in benefits from paying no taxes for 15 years and reduced the income taxes on their estate to nearly zero.  At time of death their investment portfolio will consists mainly of TFSA.)

There are two other ways they can optimize their taxes and benefits during retirement.

The first is to reduce their taxable income between ages 64 and 71 by drawing primarily from TFSA. By starting OAS at age 65, but delaying CPP to age 70, their TFSA withdrawals will allow them to be eligible for GIS, GAINS, GST and Trillium benefits which are supposed to be only for low income persons (definitions provided below). Between ages 65 and 72 these benefits meant for low income persons will add $108,305 to their retirement income.

The second way they can optimize their taxes and benefits is to slowly shift their RRSPs into their TFSA each year. By taking advantage of the lowest tax bracket, they can slowly draw down their RRSPs at a low tax rate and shift these investments into their TFSA. Moving money into their TFSA makes these funds easily available in the future and reduces the taxes on their final estate.

Once they reach age 65 their withdrawal rate on investment will drop dramatically as Old Age Security (OAS) and other government benefits kick in. Then it drops again at age 70 when their Canada Pension Plan benefits begin.  By delaying withdrawal of CPP at 65 years to 70 years the rate of return on CPP will increase by 8.4% per year. By delaying CPP to age 70, they will receive 42% more than if taken at 65.

How Michel will achieve his goal of retirement income of $40,000 at age 60

From the article:  “The problem of early retirement is twofold: Not only must one build up savings faster, but those savings have to last a longer time than they would with later retirement.

In Quebec, a man we’ll call Michel, 34, works in financial services. He earns $70,000 a year and takes home $3,640 per month after many deductions for taxes and benefits. Frugal in his spending, cautious in his investing, he wants to retire at age 45 with $40,000 income per year after tax. Assuming a 3 per cent return rate after inflation, that implies he will be able to add $1 million to present savings in 11 years. On present income, it’s unlikely.

Michel’s goals will be hard to achieve even by 50, the planner says. The earliest he can retire with a $40,000 income after tax is 60. Assuming that he can achieve and maintain a 3 per cent annual return after inflation, then in 26 years his RRSP with a present value of $90,701 and $10,800 annual contributions will have risen to a value of $612,000. With the same assumptions, his TFSA with a present value of $24,329 and $6,000 annual contributions including catch-up additions to fill space will have risen to a value of $283,800. His total capital available for retirement income will total $895,800.

Assuming a 3 per cent return before tax, his RRSP and TFSA capital at 60 would generate $40,475 per year based on an annuitized payout that would exhaust all capital and income in the following 35 years to his age 95.

If he waits until age 65 and were to draw QPP (Quebec Pension Plan) of 64 per cent of a theoretical maximum benefit of $13,600 in 2019 dollars per year at age 65, $8,704, his total income would be $49,179. Retiring early makes attaining this maximum unlikely even with scheduled increases in CPP/QPP contributions and benefits, a planned 52 per cent boost to be phased in starting Jan. 1, 2019. After 20 per cent average tax, he would have $39,343 per year or $3,280 per month. At age 65, he could add Old Age Security benefits, currently $7,210 per year for total income of $56,389 before tax. Still using the 20 per cent rate, he would have post-tax income of $3,760 per month.

Calculations show that even if Michel retires at age 60, 26 years from now, he would have to live very modestly. Retiring at 60 and starting QPP benefits with a 36 per cent discount would have a drastic cost on his total lifetime benefit from CPP. The amount he will give up each month compared to the full age 65 benefit, about $5,000 per year, will have cost him $171,500 with no compounding for the following 35 years. It is a very high price to pay for what amounts to a five year bridge to full benefits at 65.”

ANALYSIS OF FINANCIAL PROFILES

Housing – Couple has $600,000 house and Michel has $165,000 condo.  Depending on what part of Ontario couple is from this is probably par for housing.  For Michel it is possible that in parts of Quebec housing can be purchased for lower prices. However, Michael and Julie will probably have much higher investment possibilities when they sell their house versus when Michael sells his condo.  One can bet that couple has a better lifestyle in their house than Michel in his condo. In many parts of Canada it would extremely difficult for an unattached individual to purchase housing under $200,000.

Accumulation of wealth – It is unmistakable that couple is able to achieve so much more in wealth than unattached individual even when unattached individual has a relatively high income and is frugal in his spending.  At age 35 they are already millionaires. The net worth information in the article is not clear on how much net worth is expected to increase between present date and retirement at age 55. The Net Worth table appears to use the same net worth at present and at age 55 – about $1 million in real estate and RRSP and $600,000 in TFSA.  At age 75, after paying no income tax for 15 years and using benefits that are supposed to be for low income persons, values appear to be about the same. However, what is shocking is how even though RRSP and non registered accounts have virtually been depleted at age 100 the TFSA has increased in value to over $2 million. The reader is encouraged to view the tables at the links provided above.  They provide a striking picture of how income tax collection is flatlined at $0 and how net worth increases over time to age 100 instead of being depleted.

It is impossible for unattached persons, no matter how wealthy they are, to ever achieve the wealth that is possible for couples because it costs more for singles to live and they must save a greater retirement amount for one person as opposed to two persons.

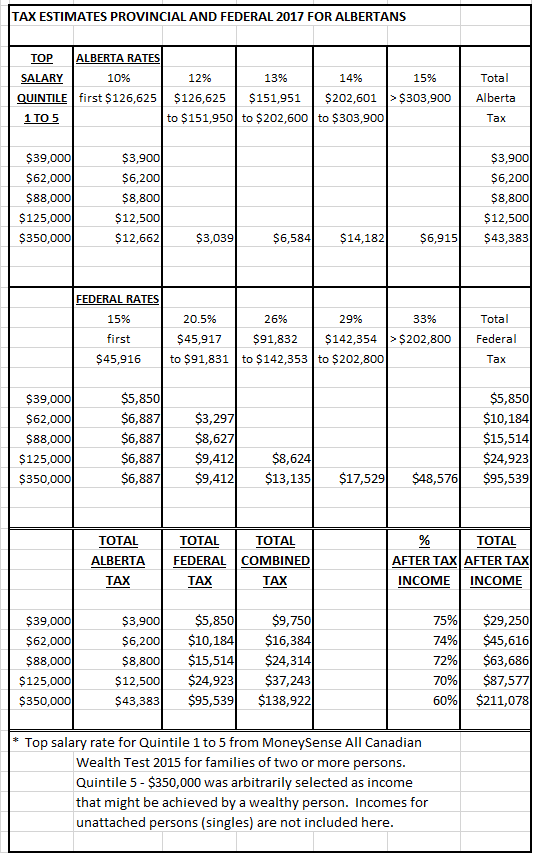
Taxes – Many of the financial profiles of unattached individuals with Michel’s income show he would probably pay a rate of 20%.  Couples who are able to use tax avoidance vehicles like pension splitting are often shown to pay income tax at rates as low as 10%.  For Michael and Julie they are able to not pay income tax for 15 years. It is an understatement to say that couples, even wealthy ones, seem to pay less income tax because of manipulation of marital benefits, pension splitting, etc.  Unattached individuals are bearing the brunt of the Canadian tax system which purposely favors married persons over unattached persons.

LESSONS LEARNED

Financial advantages of couples over unattached individualsJust how many times can it be said that according to Market Basket Measure it costs more for unattached individuals to live than couples without children (if single has value of 1.0, the value for a couple without children is 1.4, not 2.0).  Couples without children are able to maximize their net worth over unattached individuals because of marital benefits, ability to multiply wealth times two (TFSA) and compounding of investments times two. All things being equal it is virtually impossible for unattached individuals to achieve the same financial wealth as couples even though it costs more for singles to live.

TFSA revised 2019 copy 1

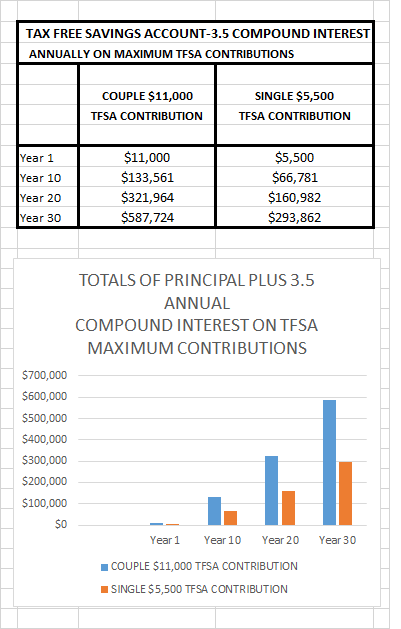
TFSA outrageously is a goldmine for the wealthy and the married – TFSA has been in place for ten years.  Maxed out TFSA now total $127,000 for couples and $63,500 for unattached individuals.

It is astonishing how Michael and Julie and Michel have been able to reach their TFSA amounts at present time with maxed out contributions.

It stands to reason that the wealthy are more likely to exponentially increase the value of their TFSAs especially if they are more risk tolerant in investment plans than low income persons.

Vetting of Income for GIS and other low income applications – Interest and investment income does have to be declared on low income applications.  However, TFSA investments are not declared as income ever. This is what allows the wealthy to circumvent the financial restrictions on who can receive assistance the low income assistance programs.

Hypocrisy of TFSA declaration of non income –  This may be harsh but TFSA not needing to be declared as income creates anger and despair for those who do not have the means to contribute to TFSA.  TFSA holders who purposefully use benefits not intended for the wealthy could be called TFSA grifters or chiselers – grifters or chiselers are con artists; in this case they swindle people and governments out of money but all within legal limits of the law.

Hypocrisy of those who demonize public pensions – Many, including far right Conservatives and proponents of private enterprise versus government jobs, berate those who receive public pensions, especially defined benefit plans .  Many of these persons are financially illiterate by stating the taxpayers pay for these systems. The real truth is that defined benefit plans are made up of employee, employer contributions and well managed investments.

Persons who are members of public pension plans must contribute a substantial amount (10%) of their income to the plan, pay taxes as contributors and pay taxes when benefits are received.  Many who do not have a choice or choose to contribute to public pension plans cannot contribute fully to TFSAs because their incomes do not allow them to contribute to both pension plans and TFSAs.

Public pensions are not a given.  They can fail if investment managers make bad decisions and if companies decide to abandon public pensions in bankruptcy.

The Canadian Pension Plan (CPP) is a defined benefit plan, so do these same beraters want to abolish CPP?

Those who are able to maximize their TFSA should also pay taxes on their TFSA investments before they demonize public pensions.

Future consequences and collateral damage if TFSA remains the same – Ability to contribute to TFSAs have now been in place for eleven years.  If the plan is not changed so TFSA is declared as income and taxed then the wealth spread between the rich and poor will increase exponentially.  Only the need to help the middle class is being discussed by some political parties. The middle class is already being transformed into the upper middle class and wealthy while singles and the poor (boondoggle-for-singles-and-low-income) are being pushed further into poverty by the actions of these same political parties.  There will be no middle class.

Every year that goes by with no revisions to the TFSA will ensure elimination of the middle class and singles and poor families getting poorer.  Every year that goes by with the upper middle class and wealthy not paying any tax on TFSA investments and these accounts growing to incredible wealth will ensure bankruptcy of the Canadian economy.  How are schools, hospitals, roads going to be built if there is an insufficient tax base to support the building of these projects?

COMPARISON OF TFSA TO OTHER PLANS (how-does-the-tfsa-stack-up)

All TFSA plans are designed to supplement and manage income from other forms of savings.  It appears only the USA, UK, South Africa and Canada have tax free savings plans.  It also appears Canada has the most generous plan with the only limit being annual contribution limit.

The USA Roth IRA has similar contribution limits ($6,000 for those under 50 and $7,000 age 50 and over) but Americans can only make the maximum contribution if their gross income is below a specific threshold – in 2019 the threshold for unattached person modified adjusted gross income limit is $122,000 or less.  Contributions limit is reduced for income between $122,000 to $136,999 and is completely eliminated for income over $137,000. For joint filers (couples) the income limit is $193,000. Contribution limit is reduced for incomes $193,000 to $202,999 or less and is completely reduced for incomes $203,000 or more. US residents have to wait a ‘seasoning’ period of five years, and be at least 59-½ years of age, before they can withdraw tax-free from a Roth IRA.  TFSAs are primarily multi-purpose vehicles while Roth IRAs are primarily meant for retirement savings.

The fine print on Roth IRA contributions limits (roth-ira-contribution-limits) is that contributions cannot be more than individual’s taxable compensation for the year. That means that if taxable income is $3,000, the cap on Roth IRA contributions is also $3,000 for that year. If there aren’t any taxable earnings during the year, there can’t be any contributions.  The one exception is the spousal IRA which allows a nonworking spouse to contribute to an IRA based on the taxable income of the working spouse.  Roth IRA distributions aren’t included in income in retirement so are not taxable. Monies earned from investment are tax-free.

Persons age  59½ or over may withdraw as much as wanted as long as Roth IRA has been open for at least 5 years.  Persons under 59½ years of age may withdraw the exact amount of Roth IRA contributions with no penalties.  However, the earnings from the principal cannot normally be withdrawn prior to age 59½ without paying the 10% early withdrawal penalty.

It should be noted that the Roth IRA has an equivalence scale method built in similar to the Market Basket Measure.  The couple limit of $193,000 to $202,999 is not twice that of the unattached person limit of $122,000 to $136,999.

SOLUTIONS

If Canada as a country does not want to go bankrupt as a result of tax not being collected on TFSAs it is incumbent upon government and politicians to change policies so that TFSA cannot grow to unabated levels.  Also, Market Basket Measure (MBM) must be applied to TFSA formulas so that income does not benefit married persons over single unattached persons. The US Roth IRA does this. Why can’t the same be done for the Canadian plan?  The US Roth IRA does not allow the wealthy over specified limits to have a Roth IRA at all. Also, change the plan so that only contributions can be withdrawn early without penalty like the Roth IRA. Lastly, the nonsensical ability to withdraw contributions from the plan and then at a later top them up again benefits only the wealthy.  Once a contribution is made it should be not able to be topped up again when withdrawn.

Donald Trump’s ignorance on MBM and similar equivalence scale measures is demonstrated by his income tax amount reductions to double for couples to that of unattached persons instead of applying equivalence scale values of 1.0 for singles and 1.4 for couples.

It is unfathomable that Stephen Harper, an economist and Leader of the Progressive Conservatives and the PC Party, would not have taken into account the future ramifications and collateral damage that this plan would cause in creating every widening separation of the rich from the poor as the years go by.

How do governments and politicians change discriminatory financial plans that have been in place for many years without backlash from the privileged and those who feel entitled even with the discrimination?  Which political party will take this on?

For God’s sake, politicians, political parties and those who demonize social programs need to educate themselves on costs of living for unattached persons and poor families versus wealthy couples and consider full ramifications of how to avoid financial discrimination now and into the future.  If heed is not taken to the above then be prepared for the anger as has already been displayed by the poor throughout the world. You have been forewarned!

DEFINITIONS

GAINS – Ontario Guaranteed Annual  Income System may provide a monthly, non-taxable benefit to low-income seniors to between $2.50 and $83 in 2018.

GIS benefit – Guaranteed Income Supplement provides a monthly non-taxable benefit to Old Age Security (OAS) pension recipients who have a low income and are living in Canada.

GST credit – The goods and services tax/harmonized sales tax (GST/HST) credit is a tax-free quarterly payment that helps individuals and families with low and modest incomes offset all or part of the GST or HST that they pay. It may also include payments from provincial programs.

Trillium benefits – Ontario Trillium Benefit combines three credits to help pay for energy costs as well as sales and property tax: Northern Ontario Energy Credit, Ontario Energy and Property Tax Credit, Ontario Sales Tax Credit.  Beneficiaries need to be eligible for at least one of the three credits to receive the benefit.

(This blog is of a general nature about financial discrimination of individuals/singles.  It is not intended to provide personal or financial advice.)

CARBON TAX AND PRICING WILL FAIL BECAUSE OF CONSUMER AND POPULATION GROWTH EXCESSES

CARBON TAX AND PRICING WILL FAIL BECAUSE OF CONSUMER AND POPULATION GROWTH EXCESSES

(These thoughts are purely the blunt, no nonsense personal opinions of the author about financial fairness and discrimination and are not intended to provide personal or financial advice.)

Many naysayers say carbon pricing will not reduce emissions and instead will pinch household budgets, kill jobs and enrich governments.  They may be right about carbon pricing, but not for the above stated reasons.

One form of carbon pricing is charging high emitters and giving rebates back to families or consumers.  However, the naysayers will never tell the whole truth – 80 percent of emissions from a barrel of oil comes from consumption and 20 percent is generated from production of the crude.

Non renewable energy emitters or types of ‘dirty’ energy will not define the major growth or decline of emissions. The first major definer of emissions will be consumerism, the second will be increasing world population.  USA consumer spending equals 70% of economy, Europe 55% and China 40%. The world’s population is estimated to top nine billion people by 2040, and the demand for energy will increase by 27 per cent. For the environmentalists and environmental protesters, which persons will they deny energy to so that they can have green energy which possibly will not meet the energy needs of growing populations?

The most egregious and hypocritical of climate deniers and consumerism are the wealthy through climate of greed and denial of their greed.

One example is the Chinese Communist hypocrisy and oxymoron of absence of social classes and money –  all (or nearly all) property and resources are collectively owned by a classless society and not by individual citizens.  Yet there has been a sharp increase in the number of ‘new wealth’ individuals.

Even though there are restrictions on what monies can be taken out of the country and Chinese leaders clamping down on extreme ostentation displays, wealthy have found ways, as many wealthy do, to circumvent rules.  One city they have chosen to display their wealth (vancouversun) (because they can’t display their wealth in China) is Vancouver for purchase of multiple mansions and luxury vehicles.  Metro Vancouver has been nicknamed supercar capital of the world. The University of B.C. has been nicknamed the University of Beautiful Cars.  The owners of these same vehicles also buy condos whose only purpose is to house these vehicles.

Betsy DeVos, Trump appointee for education, displays her wealth in ownership of 22,000 square foot summer house and $40 million yacht (just one of nine yachts and boats).  Most of Trump appointees are wealthy Republicans who choose to use excessive consumption of energy while denying climate change.

The wealthy, hypocritical environmentalists, environmental protestors and those who just don’t care choose to ignore their energy consumption by owning and using multiple housing, cottages, recreation vehicles, and exotic world travelling for starters. These include Canadian snowbird places (snowbirds) like Arizona where housing on both sides of the border sits empty for six months of the year while still consuming energy to keep the places operational.  Additional non renewable resources are used to build these structures. Housing speculators buy housing waiting for prices to increase but never rent them out (unethical).

The wealthy also choose to ignore the anger human ramifications to their conspicuous consumption.  Studies (“The Spirit Level” wikipedia) have found people are literally less healthy in societies with large gaps between the rich and the rest. People in unequal countries are more prone to chronic stress, anxiety, depression, addiction, despair, unnecessary spending, obesity, and heart disease.

One solution for consumerism is reduce the consumerism and possibly heavily tax luxury consumption.  One solution for slowing the increase of world population is to only have number of children that will replace the number of adults, one child per adult.

There is no perfect green solution for emissions.  Solar and wind solutions use rare earth minerals, kill birds and bats and cause illnesses in some humans (ncbi).  An Ontario community-based self-reporting health survey, WindVOiCe, identified the most commonly reported industrial wind turbine-induced symptoms as altered quality of life, sleep disturbance, excessive tiredness, headache, stress, and distress. Other reported effects include migraines, hearing problems, tinnitus, heart palpitations, anxiety, and depression.  In addition, degraded living conditions and adverse socioeconomic effects have been reported. In some cases the effects were severe enough that individuals in Ontario abandoned their homes or reached financial agreements with wind energy developers.

Energy companies have done great work in reducing emissions through technological and efficiency improvements such as zero emissions refineries.

CONCLUSION

Environmentalists and environmental protesters need to focus on consumerism, not just pipelines and oil spills.  Naysayers of climate change and carbon pricing need to get real and speak the whole truth, not just partial truths.  Consumerism greed and increasing world population will define whether or not emissions will increase or decrease.

(This blog is of a general nature about financial discrimination of individuals/singles.  It is not intended to provide personal or financial advice.)

TEENAGE ENTRY LEVEL WAGE BELOW MINIMUM WAGE EQUALS BLATANT DISCRIMINATION AND SOCIAL JUSTICE FAILURE

TEENAGE ENTRY LEVEL WAGE BELOW MINIMUM WAGE EQUALS BLATANT DISCRIMINATION AND SOCIAL JUSTICE FAILURE

(These thoughts are purely the blunt, no nonsense personal opinions of the author about financial fairness and discrimination and are not intended to provide personal or financial advice.)

In preparation for the 2019 provincial election certain provincial Conservative candidates once again are proposing economic changes that target the most vulnerable – teenage entry level wage below minimum wage and flat taxes (tax-system).

Alberta Minimum Wage Profile (April 2017 – March, 2018) ‘Alberta Analysis (wage-profile)- At 28.8%, the 15 to 19 year old group  remained the largest group of minimum wage earners in Alberta, and the 20 to 24 year old group was the second largest at 20.5%.  Over one quarter or 28.3% of Alberta minimum wage earners were students’.

Fact check:

    • Some teens work to help support their families.
    • Some teens have already left home and are trying to establish themselves as hard working independent, self sufficient  and responsible individuals.
    • Some teens are emancipated minors who leave their families because of abuse and untenable living conditions at home.
    • Some unattached (and married) individuals are living at home because they can’t afford Alberta housing prices.  From the report:   During the current reference period, 39.5% of minimum wage earners were living with their parents.’
    • Households with children receive Canada Child Benefits, unattached individuals do not.
    • It costs more for unattached individuals (independent teens) to live than married without children (Market Basket Measure).  If one person (unattached) household has a value of 1.0, the value for a two person (married) household is 1.4, not 2.0.
    • Discrimination based on age is a violation of human rights.

Conservatives have referred to the Australian model for teenage entry level wages. Australia Minimum Wage Reduction for Teens in 2018 (based on $18.93 minimum wage):

  • <16 years 36.8% or $6.97
  • 16 years 47.3% or $8.95
  • 17 years 57.8% or $10.94
  • 18 years 68.3% or $12.93
  • 19 years 82.5% or $15.61
  • 20 years 97.7% or $18.49

Living wage Calgary is over $18 ($36,000/yr.) and very few living wages in Canada are below $15.00.  Alberta minimum wage of $15 ($30,000/yr.) is below the living wage, and now Conservatives want to decrease the minimum wage, for example if based on Australian model, an 18 year old to approx. 70% or $10.50/hr. ($21,000/yr.)?

It is difficult to draw statistics on specific youth ages, but from several sources and from Statistics Canada Census Profile 2016, statistics show approximate Alberta population age 15 – 19 to be 240,035, age 20 to 24 to be 261,830.  Approximately 13% to 15% of total Alberta employees are from age group 15 to 24. Do Conservatives really want to target the minority group of 13 to 15%?

In 2011 (profile-youth) the Services-Producing sector in Alberta comprised 77.9% of all youth employment.  In 2011, Alberta youth accounted for 37.7% of those employed in the Accommodation and Food Services industry.  The average hourly wage paid to youth was $9.57 less than the average hourly wage paid to all Albertans. Approximately 63% age 15 – 24 are full  time employees. In 2011 average hourly wage for all Albertans was $25.47 and for age 15-24 $15.90.

Premise that age 21 before 100% wage takes effect or five years to become skilled at a job is just plain discriminatory, a violation of human rights and a social justice failure.  At 18 years of age, these persons are adults, they can vote, and many have left home to work and become independent persons. Their parents no longer receive Canada Child Benefits.

Why would parents support a policy that is discriminatory?

If problems lie with small business then solve the small business problem instead of targeting vulnerable minorities to bear the brunt of failures of business.   Apparently politicians, businesses can’t see that they will pay one way or another-more welfare and food banks at one end and ability to live decent respectful lives at the other.

Jason Kenney needs to reveal his plan for teen minimum wage reduction in its entirety so voters can make informed choices on their candidates.

CONCLUSION

What is needed in this democratic country are centre left and right parties for balance and to challenge each other so right and fair decisions are made.  What is not needed are far right Conservatives (Jason Kenney – teen minimum wage reduction and flat taxes, Doug Ford who broke his promise by cancelling Ontario Liberal’s basic income pilot project, and Trump’s economic policies making the rich even richer).

Proper budgeting implies that if there is a problem with deficits, taxes should not be cut without reducing the “fat” or excesses.  Conservatives are also once again proposing bringing back the flat tax without cutting loopholes for the wealthy. Why is it that they always target the vulnerable, cut the revenue side by cutting taxes, but never cut regressive tax expenditures or loopholes for the wealthy?

Parkland Institute (things_to_know_about_a_15_minimum_wage_in_alberta) makes the following points:

  • Consumer spending power has more impact on employment than raising the minimum wage.

  • Raising the minimum wage by meaningful amounts helps put a dent in increasing income inequality.

  • Income inequality increases health care costs and slows economic growth.

(This blog is of a general nature about financial discrimination of individuals/singles.  It is not intended to provide personal or financial advice.)

FINANCIAL DISCRIMINATION OF SINGLES AND LONE PARENT POVERTY MASKED BY GASLIGHTING

FINANCIAL DISCRIMINATION OF SINGLES AND LONE PARENT POVERTY MASKED BY GASLIGHTING

(These thoughts are purely the blunt, no nonsense personal opinions of the author about financial fairness and discrimination and are not intended to provide personal or financial advice.)

This blog post is in response to a local newspaper opinion letter submitted by a reader who believes “singles only need small spaces and one tank of gas per month”.  This post was published in a local newspaper in shortened format as only so many words can be submitted for newspaper publication.

SHOCKING STATISTICS FOR PROVINCIAL INCOME SUPPORT PROGRAM RE INDIVIDUALS AND LONE PARENTS

Shocking statistics show that in one of the richest provinces (Alberta) there were in early 2014, 33,000 Alberta Income Support program (excluding AISH) recipients of all ages.  Alberta Income Support program in January, 2017, had 54,374 recipients and in January, 2018, 57,003 recipients.  Makeup of claimants in 2017 and 2018 include individuals 69%, lone-parent families 24%, couples with children 5%, and couples alone 3% (social-assistance-rates-continue-to-soar-despite-albertas-recovering-economy).  Totals do not say how many are turned away and do not include those who on verge of poverty.

GASLIGHTING MASKS INDIVIDUALS (SINGLES) AND LONE PARENT POVERTY

Reader comments on Alberta support program statistics gaslight by blaming NDP government and immigrants.  Local newspaper opinion letter submitted by a family gaslights as part of the family majority by using bias and financial illiteracy re singles finances to tell singles they only need small spaces and one tank of gas per month.   The letter implies families have to pay so much more than single retirees.  Sorry, singles and lone parents retirees are forced by married majority to pay more taxes because they can’t pension split and don’t have marital benefits privileging married and coupled persons with and without children.

So, apparently, while your children have their own bedrooms, it is okay for singles to live in spaces as small as 150 sq. ft. with only a microwave, bar fridge, bar sink, and no stove, bathtub, laundry or storage space.  And, apparently, as evidenced in Whistler, BC housing crisis it is okay for singles to earn a decent living, but have no place to live.  One person earning $2,800 after taxes has lived in a camper van for four years.  Styrofoam cutouts are wedged into the windows to keep out the cold. Or, in shared house a single bedroom was advertised for two female tenants at $780 per person.  Illegal short term rental greed has replaced housing designated for staff.

Singles have become invisible in DIY, real estate and housing TV programs.  Probably this is because singles are increasingly being charged more and more per square foot for their small spaces and are less able to afford home purchases.

One tank of gas per month doesn’t even deserve a response.

J-u-s-t  s-p-e-a-k  t-h-e  d-a-m-n  t-r-u-t-h!  Over 90% of Alberta Income Support recipients as minorities are singles and poor lone parent families!  Families gaslight by saying it is expensive to raise children covering only twenty to twenty five years.  Housing covering sixty to eighty years, especially rental, is biggest lifetime expense regardless of marital status or children.  House ownership is separating Canadians into ‘haves’ versus ‘have nots’.

MARKET BASKET MEASURE SHOWS IT COSTS INDIVIDUALS MORE TO LIVE THAN MARRIED OR COUPLED PERSONS WITHOUT CHILDREN

Conservatives, financially illiterate, gaslighters and married never talk about low income, equivalence-scales-in-relation-to-cost-of-living or cost of living scales like Market Basket Measure (MBM) (statcan).  Example:  if single person household has value of 1.0, lone parent, one child or two adult household has value of 1.4, one adult, two children 1.7 and two adult, two children 2.0.  It costs more for singles to live than couples without children.

Just one example of MBM not applied was the 2015 Federal Conservatives proposed targeted federal tax relief benefit for single senior to $20,360 ($1,697 per month) and senior couple $40,720 ($3,393 per month).  Using simple math, $1,000 rent and $400 food and white goods per month is barely covered for singles, but $1,000 rent and $800 food and white goods is amply covered for senior couples.   Application of MBM of 1.4 for couples would equal $28,504 ($2,375 per month), not $40,720.  Cost of living for couples is not twice that of singles. Trump has also given double tax relief for couples.

For 2018, net income limit is $75,910 for singles and $151,820 for couples. Applying MBM of 1.4 or $106,274 net income limit for couples ensures tax fairness.

Singles are told by married persons that they can always reduce costs by moving in with someone else.  However, this does not solve the problem of financial discrimination of singles being forced to pay more taxes.

MULTIPLE GOVERNMENT BENEFITS ARE GIVEN TO MARRIED OR COUPLED PERSONS WITH AND WITHOUT CHILDREN

Conservatives, who tout individual responsibility,  have implemented tax avoidance programs privileging upper middle class and wealthy married or coupled households with and without children (add link) like pension splitting, Tax Free Savings Accounts (TFSA) with no limits, Old Age Security (OAS) clawback targeting only top two percent, and tax loophole programs. They financially and socially discriminate against minority singles and poor households who generally do not have the income to take full advantage of these programs.  Wealthy never pay their fair share of taxes. The Canada Child Benefit does not take into account net worth and assets, so it privileges wealthy parents who have low incomes, paid for houses, and high net worth and assets who then retire early. These same benefits have been perpetuated by the Liberal Party because of fear of losing votes if tax fairness changes are made.

Married and coupled persons do not realize the financial power and privileging that has been given to them when they are able to apply benefits on top of benefits times two persons (family-tax-credits).  For example, it is shameful when married and coupled persons can get OAS, which is supposed to be part of the Canadian poverty reduction pillar, then take that money and max out their TFSAs while paying less taxes because they can pension split and not pay taxes on TFSA proceeds (TFSAs do not need to be included in income).

The local newspaper opinion letter on same day as above opinion letter thankfully recognizes widowed person, now homeless ‘single’ (doesn’t say she is age 65), who is begging for money because she can’t get on small town local social support 600 person waiting list.

Singles, including poor lone parent households, are not stupid and deserve to feel righteously angered.  (After all, they also have math skills since they went to same schools as their married/coupled counterparts).  Singles know as minority populations they are not respected in financial formulas to the same level as married or coupled households with and without children.

CONCLUSION

Personal responsibility with social justice imbalance can lead to selfishness and greed.  Personal responsibility with balanced social justice and financial formulas changes “me” to “we”. Less gaslighting and more financial and public policy formulas based on MBM, and including net worth and assets, on all benefits and taxation without political bias would ensure financial fairness for all Canadians.

(This blog is of a general nature about financial discrimination of individuals/singles.  It is not intended to provide personal or financial advice.) This is a WordPress blog designed by a hired individual.

HOUSING BIGGEST LIFETIME EXPENSE, NOT CHILDREN. IS HOUSING ALLOWANCE THE ANSWER?

HOUSING BIGGEST LIFETIME EXPENSE, NOT CHILDREN.   IS HOUSING ALLOWANCE THE ANSWER?

(These thoughts are purely the blunt, no nonsense personal opinions of the author about financial fairness and discrimination and are not intended to provide personal or financial advice).

(This discussion on the housing crisis was presented to a Conservative Member of Parliament for future consideration on federal budget consultations.  This is Part 1 of the presentation.  Further suggestions for budget considerations will be presented in next blog post).

AFFORDABLE HOUSING

First, affordable housing, affordable housing and more affordable housing.  Both Conservatives and Liberals have failed to provide solutions for affordable housing (Conservatives during their 40 year reign in Alberta had almost zero affordable housing, raised taxes for the poor from 8% to 10% with flat tax implementation and catered to the wealthy while having no financial plan for managing revenues from oil wealth, and therefore, were unprepared for the oil price crash-Peter Lougheed excluded).

FACT CHECK:  FOREIGN HOME OWNERSHIP AND MULTIPLE HOME OWNERSHIP

Canadian residents spent $2.2 billion on Florida real estate in the 12 months ended June 2014, making them Florida’s No. 1 international buyer of residential real estate (canadian-snowbirds). About half of Canadian buyers spent less than US$200,000 on Florida purchase and just 16 per cent paid more than US$400,000.  About half of Canadians purchased a condominium/apartment and 38 per cent bought a single-family detached home.  More than half (53 per cent) of Canadian buyers intended to use their Florida home as a vacation property (resulting in empty houses during part of year), 14 percent planned to rent it out, 17 percent said they will do both. Forty per cent of Canadian buyers purchased real estate in Florida, 23 per cent in Arizona, and 10 per cent in California. Dollar value of Canadian sales for 2009 $8.9 billion, 2010 $17.1 billion, 2011 $13.0 billion, 2012 $15.9 billion, 2013 $11.8 billion, 2014 $13.8 billion (total $80.5 billion in six years).  Fifty percent of sales were in four states of Florida, California, Texas and Arizona.

Both foreign home ownership in Canada and Canadian foreign home ownership in USA equal $80 billion (Canadian foreign home ownership is $80 billion in six years).  There is so much hype about foreign home ownership in Canada, but Canadians are so hypocritical that they can’t look in their own backyard regarding snowbird foreign home ownership in USA, having their Canadian homes empty for six months of the year and spending their money in USA for six months.  What does this mean? – those Canadians who are not so fortunate to be snowbirds like the poor are paying more to support the taxes and GDP of Canada.

Toronto – 121,100 people in the GTA owned at least one other home in 2016. Question: how many Canadians own multiple properties in Canada and USA (snowbirds) while in any given year 200,000 to 300,000 Canadians face homelessness?

Information from the following article provides an interesting perspective on housing:  (Renter-Struggle-Ultimate-Housing-Problem)

‘More than four million Canadian households — about 30 percent of total households — rent.

Without federal help, low-income renters’ struggle to find homes worsens.  There is, however, a lot of federal money reserved for homeowners. Owners selling their principal residence are exempted from capital gains tax, a tax break worth about $5 billion a year.

The federal government offers this aid for owners despite the fact they earn more than renters. Owners make more than twice as much as renters do at $67,522 a year, according to the last long form census in 2006. Owners also have 37 times the median net worth of renters, thanks to their homes, at $513,000, according to 2012 CMHC numbers. This wealth gap widens over time.

“The great thing about ownership is that you have an asset for when you retire… Politicians use the line that if you work hard and buy a house you’re going to be OK,” said the University of Toronto’s Hulchanski. “But what about renters? The rest of you are just lazy? And you’re going to suffer now? You’re going to suffer when you get old?”  Hulchanski calls the neglect of renters and prioritization of homeowners discrimination.  “That’s no way to organize society.” ’

HOMEOWNERSHIP

  • New data from the 2011 NHS (National Housing Survey) showed that 69.0% of households in Canada, or 9.2 million of 13.3 million, owned their dwelling.
  • Four in five (82.4%) couple-family households owned their dwelling, while less than half (48.5%) of non-family households (singles) owned their dwelling. Just over half (55.6%) of lone-parent households owned their dwelling.

Dr. Ben Carson (appointee of Trump who was put in charge of housing but knows nothing about housing) made statement that many of the poor create their own poverty.  This statement is so false.  Politicians, private enterprise, corporations and society have purposefully or unknowingly pushed singles and poor families further towards poverty by making them pay more.  Whether it is purposeful or unknowing still makes the perpetrators guilty of complicity in benefiting middle class and wealthy more.

Housing is a prime example.  Singles and poor families pay more for housing while being shoved into smaller and smaller spaces.  Examples of inequality of Canadian values in housing are as follows:

  • One condo development in housing complex includes 1 bed, 1 bath, 1 patio 552 sq. ft. micro-condo with starting price of $299,900 or $543 per sq. ft.  Three bed, 2.5 bath, 2 patios, 2 and 3 story 1830 sq. ft. condos in same complex are priced from $649,900 to $749,900 or $355 to $409 per sq. ft.  Ultra-deluxe model master bedroom suite with his and hers closets and spa bathroom covers entire third 600 sq. ft. floor.  Third bedroom is bigger than total square footage of $299,900 condo and sells for $150 to $200 less per square foot for two-thirds more space.
  • Vancouver 100-square-foot apartments equivalent to size of two jail cells rent for $570 a month (again most likely to be occupied by singles).  Renters in the 50 units share 11 bathrooms and laundry facilities over the four floors (and no kitchens?).

Where is the critical thinking of ripple effects where owners (most likely to be singles) of micro-condos have to proportionately pay more house taxes, education taxes, mortgage interest, insurance and real estate fees on less house and likely less take home pay for their biggest lifetime expense?

Which of those who spout family values as a personal issue believes females should go traipsing outside of their apartments to use bathroom in middle of the night? Who believes it is humane to stick anyone into a 100 square foot or smaller units (90 square foot units in Vancouver) plus charge excessive rents?

Who makes the decisions behind loan-shark or pay day loan type pricing where financial targeting of the most vulnerable occurs?  It is private enterprise, land developers,  cities (government), and greedy ‘what the market can bear’ persons that make these decisions.  Where does the bafflegab of neighbor helping neighbor, personal discipline, caring, responsibility and respect fit into these decisions?

HOUSING IS BIGGEST LIFETIME EXPENSE, NOT CHILDREN

Housing is a necessity regardless of whether or not households have children.  If lifetime length of paying for housing is from 20 to 80-90 years of age, then housing is a basic necessity spanning over sixty to seventy years.  Look at any Living Wage study, and it will show that as number of persons decrease per household, the greater the proportion of income will be spent on housing, yet most government benefit programs target only families with children or senior married or coupled households, thus leaving single person and poor households out of financial formulas.

If a household pays $1000 rent per month, then housing may cost $720,000 over a lifetime with nothing to show for it financially while supporting greedy real estate owners who pass their greed unto renters (and often ignoring renter psychological impact of excessive internal and external noise, being kicked out by landlord under guise of needing to renovate so prices can be raised, and dingy secondary suites, etc.). That is three quarters of a million dollars ‘lost’ to the  renter over a lifetime!

Homeowners after twenty five years and $1400 mortgage per month will likely have a $300,000 paid for house ($15,000 down payment and 3.70 interest rate for 3 years amortized at 25 years) which may or not increase in value as part of their assets and wealth financial portfolio (minus maintenance and house taxes)  They have the ability to move up or down in housing as dictated by their lifestyles changes.

Raising children covers only twenty to twenty five of those years, but both the Conservatives and Liberals have brought in child care benefits that benefit only households with children and in some cases child care benefits even pay entire mortgage and rental housing for these households.  Pension splitting government benefits apply only to senior married or coupled households.

Rent controls, rental vouchers don’t work and the greed of “what the market can bear” will not control the outrageous upswing of housing prices.  Charity is not the answer as charity masks the problem, but doesn’t solve it.

HOUSING ALLOWANCE

The Liberal proposal for a housing allowance is a step in right direction.  Instead of Liberals and Conservatives continuing their infighting and vote getting tactics, how about doing right thing and making housing allowance a permanent solution throughout entire lifetime, just like healthcare?  How about involving all political parties in defining a solution, now wouldn’t that be a novel idea? Housing allowance should be based on not just income, but also assets and wealth. Those who own their homes outright or more than one home should get zero assistance for housing allowance.  Housing is a human right.

One suggested housing allowance (renting or mortgage) formula based on of equivalence scales or LIM (Low Income Measure) (equivalence-scales) could include starting point of $500 (based on 1.0 LIM value) per month for one adult person household, $700 (1.4 LIM value) for two adult persons households or one adult, one child households and $1,000 (2.0 LIM value) for two adult, two children household. Amounts would be based on level of income AND assets and wealth). Households who have fully paid for ownership in housing, own more than one home and/or have ample wealth would get zero dollars for housing allowance.

CONCLUSION

Housing is a basic human right and is just one element of Maslow’s Hierarchy of need.  The inaction by politicians, governments, private enterprise and society on housing, especially in the so called free democratic world, is an egregious moral and ethical affront to the most vulnerable of our society.

(This blog is of a general nature about financial discrimination of individuals/singles.  It is not intended to provide personal or financial advice).

TAXES: FLAT VS. PROGRESSIVE AND DEBUNKING “THE TAX SYSTEM EXPLAINED IN BEER”

TAXES:  FLAT VS. PROGRESSIVE AND DEBUNKING “THE TAX SYSTEM EXPLAINED IN BEER”

(These thoughts are purely the blunt, no nonsense personal opinions of the author about financial fairness and discrimination and are not intended to provide personal or financial advice.)

Prelude:  Yet again, the tax system explained in beer story is used to ludicrously and simplistically explain the tax system, and no less by the USA White House.  We have been wanting to do a blog post on flat and progressive tax systems comparisons, so here it is. 

The story about “The tax system explained in beer” (democratic) has been flitting around the internet since 2001.  Apparently no author can be identified for the article. The analogy makes the argument that since wealthy people pay the most in taxes, they will also receive the most benefit from a tax cut. It also suggests that wealthy people will leave the US if they are made to pay more in taxes.

It appears that how the reader interprets the article is based on ‘right’ or ‘left’ political thinking, flat versus progressive taxation systems and social democracy or not.

On October 30, 2017 Sarah Huckabee Sanders, USA White House Press Secretary began her daily press briefing pitching USA Trump tax cuts by reciting the article.  Then she said,  “And that, ladies and gentlemen, is how our tax system works,” Sanders continued. “The people who are being paid the highest taxes will naturally benefit from a tax reduction but not the largest benefit. Taxing them too much and they might start drinking overseas where the atmosphere is somewhat friendlier. This is a silly story but it illustrates a very important point. Our tax cuts and reforms will create a fair system that works better for everyone. It will make our country the friendliest in the world for American families trying to build a better life for their children. And for American companies seeking a competitive edge. I will be happy to get that story to everybody so you can get those numbers later. Again, I know that may be an oversimplification but it paints a very good picture of the tax system.”

From the analogy the information is condensed as follows, ‘the premise is every day ten men go out for beer and the bill for all ten comes to $100.  If they paid their bill the way we pay our taxes, it goes something like this…’ (first four people are the poorest).  Based on their incomes, the ten men would pay:

  • The first four men (poorest) would pay   $  0
  • The fifth would pay                                  $  1
  • The sixth would pay                                $  3
  • The seventh would pay                           $  7
  • The eighth would pay                              $12
  • The ninth would pay                                $18
  • The tenth man (richest) would pay          $59  (for a total of $100)

Everyone is happy with this arrangement, until the owner throws them a curveball. Because they are such good customers, he reduces the bill to $80.  It is decided it would be fair to reduce each man’s bill by a higher percentage the poorer he was, to follow the principle of the tax system they had been using, so each man would now be paying:

(Blog author comment:  Truly funny, the totals add up to $79, not $80, so it appears the bar tender will be short changed by $1.)

  • First four persons        $  0
  • Fifth person                 $  0 (100% saving on prior payment)
  • Sixth person                $  2 ( 33% saving)
  • Seventh person           $  5 (28% saving)
  • Eighth person              $  9 (25% saving)
  • Ninth person                $14 (22% saving)
  • Tenth person                $49 (16% saving) for a total of $79

However, the men begin to compare their savings with those who get the least in percentage of savings complaining the most.

The wealthy get all the breaks. Wait a minute, yelled the first four men, we didn’t get anything at all. This new tax system exploits the poor. The nine men yelled at the tenth and made him feel bad so the next time the tenth man didn’t show up for drinks and the nine sat down and had their beers without him. When it came time to pay the bill, they discovered something important. They no longer had enough money between them all to even cover half of the bill.

For those who understand, no explanation is needed. For those who do not understand, no explanation is possible.’  (End of analogy).

Reader comment:  ‘Yes, the perilous story of the wealthy person who will leave it all behind if the taxes go a percentage point too high…all his businesses, his customers and his suppliers, all his family, his home, his social networks, his local culture, his kids schools, why he’ll just pick up all of that and magically whisk it away to some other place with a lower tax burden for free.  The only thing the story is missing to start with is “Once upon a time…” like all fairy tales’.


ANOTHER EXPLANATION OF THE ABOVE ANALOGY

Taken from the following article:   “SA Tax System Explained Through Beer” (based on South African Rand) tax-system-explained-through-beer

‘Economies are not one-liners. We’re talking about systems here – and you can’t talk about taxation and spending without talking about “where did the money come from”.

So let me attempt to re-tell that parable.

Ten Men Walk Into A Bar…And One Of Them Owns The Brewery.  Suppose that every day, ten men go out for beer and the bill for all ten comes to R100.  If they paid their bill the way we pay our taxes, it would go something like this:

  • The first four men (poorest) would         R  0
  • The fifth would pay                                 R  1
  • The sixth would pay                                R  3
  • The seventh would pay                           R  7
  • The eighth would pay                              R12
  • The ninth would pay                                R18
  • The tenth man (richest) would pay          R59 (for a total of R100)

So, that’s what they decided to do.

There are many reasons why the richest man agreed to pay the bulk of the bill, but the important one is that he owned the only brewery in town, and the barman would buy all the beer from him.

The seventh, eighth and ninth men all worked in the brewery, and earned salaries according to their skill level. The sixth and fifth men owned farms which supplied the hops – although they didn’t earn particularly well, because the brewery was the sole buyer and it negotiated quite stiff rates.

The remaining four men were farm labourers who earned enough to eat, but not enough to drink.

The way that the brewery man saw it: the drinks must flow in order for the barman to be in business and sell the beer that the brewery produced.

The ten men were also very protective of their beer industry, and would run any newcomers out of town. This meant that the ten men were the only real regulars at the bar, and the only real source of its income.

So to keep the bar in business and the town happy and the drinks flowing, the richer men would pick up most of the tab. And happily, most of the bill would end up back in the brewery man’s hands anyway.

So the ten men drank in the bar every day and seemed quite happy with the arrangement, until one day, the barman threw them a curveball. “Since you are all such good customers,” he said, “I’m going to reduce the cost of your daily beer by R20”. Drinks for the ten men would now cost just R80.

What he didn’t say is that there had been a bumper season of barley, so the brewery had produced its beer fairly cheaply that month – and the brewery owner had offered the barman a substantial discount on the beer in order to get rid of it.

The group still wanted to pay their bill the way we pay our taxes. So the first four men were unaffected. They would still drink for free. But what about the other six men? How could they divide the R20 windfall so that everyone would get his fair share?

They realized that R20 divided by six is R3.33. But if they subtracted that from everybody’s share, then the fifth man and the sixth man would each end up being paid to drink his beer.

So, the bar owner suggested that it would be fair to reduce each man’s bill by a higher percentage the poorer he was, to follow the principle of the tax system they had been using, and he proceeded to work out the amounts he suggested that each should now pay.

And so

  • The fifth man, like first four, now paid           R  0 (100% saving)
  • The sixth instead of R3 now paid                 R  2 (33% saving)
  • The seventh instead of R7 now paid            R  5 (28% saving)
  • The eighth instead of R12 now paid             R  9 (25% saving)
  • The ninth instead of R18 now paid               R14 (22% saving)
  • The tenth instead of R59 now paid               R49 (16% saving) for total of R79

Each of the six was better off than before. And the first four continued to drink for free.  But, once outside the bar, the men began to compare their savings.

“I only got a dollar out of the R20 saving,” declared the sixth man. He pointed to the tenth man,”but he got R10!”

“Yeah, that’s right,” exclaimed the fifth man. “I only saved a rand too. It’s unfair that he got ten times more benefit than me!”

“That’s true!” shouted the seventh man. “Why should he get R10 back, when I got only R2? The wealthy get all the breaks!”

“Wait a minute,” yelled the first four men in unison, “we didn’t get anything at all. This new tax system exploits the poor!”

In their rage, the nine men decided to boycott the bar.

The next night only the tenth man showed up for drinks so he sat down and had the beer on his own. But when it came time to pay the bill, he discovered something important. 90% of the beer had gone unsold, and the barman was threatening to return the stock to him in the morning.

And if the situation remained unchanged, then the barman was planning to shut up shop, and the brewery would have to close, and then everyone would be without jobs.

And that is how our economy works. The people who already pay the highest taxes will naturally get the most benefit from a tax reduction, but the wealthy also have a vested interest in keeping consumers at the table.

That consumption drives the economy and gives value to the businesses that they own. And the hard truth is: if anyone decides to leave the table, then it’s likely that everyone will lose. And it’s really hard to keep everyone happy.

It’s complicated.’ (End)

EXAMPLE OF PROGRESSIVE FEDERAL AND PROVINCIAL 2017 FOR ALBERTANS

For this blog author, the initial article is based on true stupidity and over simplification of the tax system.  In this blog article, an example is used to explain the Canadian and provincial tax system based on a progressive tax system versus a flat tax system. These calculations are examples only.  Also, final taxes will vary based on personal deductions, other deductions, tax credits and loopholes not included here.

The following information outlines the 2017 progressive tax system for Canadian and Alberta families of two or more using 2011 Stats Canada information on incomes for Quintile 1 to 5.  For the tax calculation, the highest income for Quintile 1 to 4 rounded off was used plus an arbitrarily assigned income of $350,000 for Quintile 5.

CANADIAN DISTRIBUTION OF INCOME (from MoneySense 2015 All Canadian Wealth test (moneysense.ca/save/financial-planning/the-all-canadian-wealth-test-2015/)


  • Quintile 1 up to $38,754
  • Quintile 2 $38,755 to $61,928
  • Quintile 3 $61,929 to $88,074
  • Quintile 4 $88,075 to $125,000
  • Quintile 5 $125,001 and over

Upper income point of quintiles

  • Quintile 1 $  39,000
  • Quintile 2 $  62,000
  • Quintile 3 $  88,000
  • Quintile 4 $125,000
  • Quintile 5 $350,000 (arbitrarily assigned value)

tax


ANALYSIS

First, it must be stated that all persons identified in the quintiles will not pay the full tax shown in the table since personal deductions, other deductions and tax credits have not been applied.  Also, the ability to use tax loopholes and credits, (more likely to benefit wealthy the most) have not been applied.  Examples are TFSAs (no tax savings on principal amounts, but savings are realized on tax free investments and interest earned on principal) and RRSPs (reduced taxes on employment income for yearly RRSP amounts, but will pay taxes on withdrawals from RRSP, for example, in retirement when income is likely to be less than when employed).  Combined principal amounts for TFSAs for couples now totals almost $100,000 (tfsa-boondoggle-for-singles-and-low-income-canadians).  It is almost 100% certain that couple earning $39,000 will not be able to contribute to TFSAs and RRSPs.

Also, calculations are based on the combined total income for one or two earners in family of two or more.  Taxation will vary based on income earned by each spouse and tax rules for family income.

It is interesting to note percentage of after tax income without application of any other deductions for Quintile 1 to 4 families of two or more persons averages between 70% and 75%, while percentage of after tax income for the richest Quintile 5 $350,000 arbitrarily assigned income for family of two or more is about 60%. The 60% after tax income, however, will increase substantially with the deductions, and tax avoidance, loopholes and credits that wealthy are able to use.

After tax income with no deductions for family of two or more earning $350,000 will be at least $211,078 or $17,590 per month (as compared to only approximately $2,400 per month for Quintile 1 family of two or more persons).  Families earning $39,000 with equal incomes between the spouses at 2,000 annual worked hours each works out to about $10/hr.

If 2015 old flat tax rate of 10% for Alberta is applied to Quintile 5 person earning $350,000 the total tax would only be $35,000 instead of $43,383.  What a difference a progressive tax makes!  The average person does not understand that the first dollar earned is taxed lower than the last dollar earned in the progressive tax system.  The person earning $350,000 pays the exact same tax on the first $125,000 of pay as the person making only $125,000.  That is what makes progressive taxes fair.

From MoneySense article the top income for unattached individuals for Quintile 1 is $18,717 (as compared to $38,754 for family two or more persons), Quintile 2 $23,356 ($61,928 for family two or more persons), Quintile 3 $36,859 ($88,074 for family two or more persons), Quintile 4 $55,498 ($125,000 for family two or more persons), and Quintile 5 $55,499 and over (over $125,000 for family two or more persons).  Analysis shows incomes of families of two or more are at least double or more to that of unattached individuals.  It is almost 100% certain that unattached individuals in Quintiles 1, 2 and 3 will not be able to save by contributing to TFSAs and RRSPs (unless RRSP is a forced contribution through employer).

Income does not include assets that the upper class and wealthy might have such as paid for $600,000 and up housing, investments, etc.

CONCLUSION

Michael Lewis, author of “The Undoing Project” book, describes how a Nobel Prize-winning theory of the mind altered our perception of reality.   Two Israeli psychologists, Daniel Kahneman and Amos Tversky’s work created the field of behavioral economics which revolutionized thinking of how the human mind works when forced to make judgements in uncertain situations.  An example is outcomes of surgery where there might be a 5% chance of death versus 95% chance of surviving the surgery.  When patients are presented with 95% chance of survival rate rather than 5% death rate, they are more likely to go through with the surgery.  The same judgement should apply to tax system based on beer analogy.

For upper class and wealthy, please don’t ‘cry me a river’.  Wealthy need to look at what they have left after taxation instead of what is being taken from them in taxation.  Only when all the tax loopholes, offshore tax havens, and privileging through tax credits like Tax Free Savings Accounts TFSAs that benefit wealthy the most are eliminated so that there is a level playing field and fairness between poor and wealthy, only then can the wealthy ever complain that they are being taxed unfairly.

The wealth gap between the rich and poor needs to be lessened by increasing the minimum wage to an indexed living wage and eliminating the tax deductions, loopholes and tax credits that benefit the wealthy the most (selective-democratic-socialism).

Regarding the ‘The Tax System Explained in Beer’ analogy, we will take the South African Rand analogy as being the more accurate of the two analogies, thank you very much!

Postscript: For those who wish to read more on the debunking of tax system explained in beer analogy, the following online article and reader comments is a great one – (Reality) Check, Please:  Why the Restaurant Analogy Doesn’t Work (Restaurant-Analogy-Doesnt-Work).

UPDATE OCTOBER 31, 2018 – We are very grateful to a reader who pointed out that an error was made in the calculation of information in the table.  The table has been updated.  The update decreases the tax that is paid in the $350,000 Alberta income category.

(This blog is of a general nature about financial discrimination of individuals/singles.  It is not intended to provide personal or financial advice.)

WHY CONSERVATIVES AND PROGRESSIVES THINK THE WAY THEY THINK

WHY CONSERVATIVES AND PROGRESSIVES THINK THE WAY THEY THINK

(These thoughts are purely the blunt, no nonsense personal opinions of the author about financial fairness and discrimination and are not intended to provide personal or financial advice).

The following blog post is based on George Lakoff’s research on moral politics.  It is impossible to outline all of his findings here, so it is worthwhile to read more of his research for a fuller picture of his findings.  The words in this blog post are primarily taken from the two source materials.  Words in italics are those of the blog author.   (This blog post was published in a local  newspaper in 600 word abbreviated format as submissions to newspaper are restricted to a certain number of words).  Updated August 9, 2017.

Why conservatives and progressives think the way they think

Thank goodness for local newspaper opinion letters of past few weeks highlighting why Conservatives message and Unite the Right in Alberta are failures for social democracy!

To understand conservatives and progressives George Lakoff, retired Professor of Cognitive Science and Linguistics, in ‘Understanding Trump’ (understanding-trump) and ‘Your brain on Trump’ by Jennie Josephson (transcript-george-lakoff) states “politics needs to be understood metaphorically in family terms since we are all first governed by our families and so we grow up understanding governing institutions in terms of family governance.   Family defines the self-definitions of people and people don’t vote against their self-definition.   Based on life and family circumstances neural circuitry in the brain follows two common forms of family life.  One is ‘strict father family’ (conservative) and the other ‘nurturant parent family’ (progressive).  All politics is moral.  Voters vote their moral values.  To vote against their moral values means rejection of self.

‘Strict father’ brain circuitry believes authority is justified by morality hierarchy in which those who have traditionally dominated should dominate, for example, rich above poor (increasing corporate/family wealth with no increase in minimum wage), Western Culture above other cultures, men above women, white above non whites, Christians above non Christians, straights above gays, corporate outsourcing or privatization for the sake of profit above unions, etc.  In conservative politics poor are seen as lazy and undeserving, while rich deserve their wealth (as evidenced by almost zero affordable housing during forty year Alberta Conservative oil boom reign sung to the tune of it is what the market can bear mentality). Responsibility is taken to be personal responsibility, not social responsibility.

Poor conservatives vote against their material interests, because they’re voting for their worldview. And the reason for it is that their moral worldview defines who they are. They are not going to vote against their own definition of who they are.”

Another type of dominance to add to the list is married above singles.  Singles are often invisible in the family definition and excluded in financial formulas (what-is-the-point)

“Conservatives see taxation, not as investment in publicly provided resources for all citizens but, as government taking their earnings (their private property) and giving it through government programs to those who don’t  deserve it.  They always want to cut taxes and cut public resources.  They fail to recognize that many public resources begin with business and that they themselves benefit from tax dollars used for public good in public roads, schools, hospitals, police, courts for business cases, the criminal justice system, sewers, water, electricity, Wall Street which is utilized most by the wealthy, etc.

They want to go back to ‘old time’ values as in “the Alberta I grew up in” and “Make America great again”.  They fail to realize it is impossible to go back, for example, to oil boom days when Britain and France and auto manufacturers are moving towards electric only cars.

Re conservative and progressive brain circuitry, Lakoff states “there is no middle in politics, but most people are not just all one or the other.  They are what he calls bi-conceptual or moderates.  Most conservatives have some progressive views and, likewise, most progressives have some conservative views.  And there are people who are both conservative and progressive, but one view is usually stronger than the other. How can they both reside in the same brain at the same time?  Both are characterized in the brain by neural circuitry.  They are linked by a commonplace circuit:  mutual inhibition.  When one is turned on the other is turned off; when one is strengthened, the other is weakened.  The more conservative views (Trump) are discussed in the media, the more they are activated and the stronger they get; both in the minds of hardcore conservatives and in the minds of progressive conservatives.”  (The three political parties in Canada – progressive conservative, liberal and new democrat also changes the political picture.)

“Far right conservative politicians may want to turn on the minor view in the other person and USA conservatives have figured out how to do this.  In fact, they set up leadership sessions to train leaders who want to be conservative to think and talk conservative.” What is really scary is that Lakoff says a fact that is set in the neural circuitry of the brain can be changed in less than a tenth of second.  Trump as a perfect salesman has learned how he can take the mind off of important facts.

Lakoff states that “conservative and progressive views often determine which college they are likely to attend.  Conservatives are likely to take business courses which means they will take marketing courses which teach them how to maximize marketing.  There’s a good chance they will study cognitive science, that is, how people really think and how to market things by advertising. So they know people think using frames and metaphors and narratives and images and emotions and so on. Progressives interested in politics are more likely to take political science, law, public policy, economic theory, not business, and therefore, they learn a different way of thinking.  They likely are not going to study either cognitive science or neuroscience.  Once a worldview is established and become fixed in a  lot of very complex circuits in the brain, the worldview becomes natural and automatic.”  (One professor after reading Lakoff’s research has added a cognitive science course to the curriculum).

According to Lakoff, “research has shown conservatives tend to reason with direct causation while progressives have easier time reasoning with systemic causation.  Examples of direct causation are Trump’s ‘immigrants are flooding in from Mexico so build a wall’ or cure for gun violence is to have a gun ready to directly shoot the shooter.  Those who think climate change is a hoax likely base this on direct causation.  Systemic causation in global warming explains why global warming over the Pacific can produce huge snowstorms in Washington DC:  masses of highly energized water molecules evaporate over the Pacific, blow to the Northeast and over the North Pole and come down in winter over the East coast and parts of the Midwest as masses of snow.  Systemic causation has chains of direct causes, interacting causes, feedback loops, and probabilistic causes, often combined.   Direct causation is easy to understand, and appears to represented in the grammars of all languages around the world.  Systemic causation is more complex and is not represented in the grammar of any language.  It just has to be learned”.

How do conservatives get their message across?

How do far right Conservatives get their message across?  Lakoff gives ten examples of unconscious brain mechanisms (98 per cent of thought is unconscious).  Some examples are repetition (we are going to win, win, win so much).  Then there is framing like ‘Crooked Hillary’, and repeating well-known examples over and over again like shootings by Muslims, Africans-Americans and Latinos.  In his tweets, salesman Trump uses preemptive framing, diversion or deflection, attack the messenger and trial balloons (test public reaction to nuclear arms escalation).

Lakoff states that even if Trump had lost the election, he will have changed the brains of millions of Americans, with future consequences.  This is why it is important that people know the mechanisms used to transmit Big Lies and to stick them into people’s brains without their awareness.  It is a form of mind control.

How to fight far right conservative ideology

So, how can we fight far right conservative ideology?  As stated by Lakoff responsibility rests with ordinary citizens recognizing unconscious brain mechanisms used to spread their message.  Then, recognize that it does not help to repeat false conservative claims and rebut them with facts.  Instead, go positive.  Use positive truthful framing in terms of public good to undermine claims to the contrary.  Use facts to support positively-framed truth with repetition.  Say it over and over again.   The best resistance is positive persistence.  Talk about the public, the people, public servants and good government.  And take back freedom.  Public resources provide for freedom in private enterprise and in private life.

Don’t go negative.  Keep out of nasty exchanges and attacks.  One can speak powerfully without shouting.

Rebuttal needs to start with values, not policies and facts and numbers. PROGRESSIVES ARE THE MAJORITY (in USA) so let’s make our values clear. Progressive thought is built on empathy, on citizens caring about other citizens and working through government to provide public resources for all, both businesses and individuals.  Values come first, facts and policies follow in the service of values.  Facts and policies matter, but they always support values”.  (The Democrats lost the election to Trump because their message was wrong).

From George Lakoff’s ‘Ten Points for Democracy Activists’ (condensed) (ten)

  • Understand the basic issues (see online: ‘a minority president why the polls failed and what the majority can do’)
  • Know the difference between framing and propaganda:  frames are mental structures in thought; every thought uses frames.  Frames, in themselves, are unavoidable and neutral.  Honest framing is the use of frames you believe in and are truthful.
  • Hold conservatives accountable (focus on Republican actions-minimize publicizing Trump – his image, his name, his tweets)
  • Focus attention on substance, not sideshows:  positively and strongly reframe Trump’s preemptive framing 
  • Focus on democracy and freedom (in government by, for and of the people, there is, or should be, no distinction between the public and government.  Government’s focus should be on empathy, transparency and freedom and opportunity)
  • Be careful not to spread fake news
  • Understand the brain’s politics:  All ideas are physical, embodied in neural circuitry.  The more the circuitry is activated, the stronger the circuitry gets and the more deeply the ideas are held. (Use real facts to filter out alternative facts).
  • Remember progressives are a powerful majority
  • Be positive:  frame all issues from a progressive moral viewpoint.  Take the viewpoint of the public good, of the impoverished and the weak, and of preservation
  • Join the Citizens’ Communication Network

Conclusion

Whether or not readers agree with Lakoff’s reasoning for conservative versus progressive differences is in the eye of the beholder.  However, it behooves all of us to fight dangerous Big Lies leading to authoritarian conservative governance.

This is only a small insight into what George Lakoff has to say about moral politics.  It also should be said that extremes on either side whether conservative or progressive can have dire consequences.  Far right conservatism can lead to authoritarian governance and far left progressiveness can lead to communism type governance where freedoms are taken away under guise of all persons are equal.  It also is wrong for governments to hand out numerous tax credits without looking at assets and wealth so that wealthy get tax credits and financial loopholes they don’t need.  It is all about balance!

(This blog is of a general nature about financial discrimination of individuals/singles.  It is not intended to provide personal or financial advice).

CAPITALISM (PLUTOCRATIC) FINANCIALLY NO DIFFERENT THAN COMMUNISM, DICTATORSHIP, ETC. AS THEY ROB FROM THE POOR TO PAY THE RICH

CAPITALISM (PLUTOCRATIC) FINANCIALLY NO DIFFERENT THAN COMMUNISM, DICTATORSHIP, ETC. AS THEY ROB FROM THE POOR TO PAY THE RICH

(These thoughts are purely the blunt, no nonsense personal opinions of the author about financial fairness and discrimination and are not intended to provide personal or financial advice.)

This blog has given many examples of how singles and the poor are consistently being financially compromised by their governments who are supposed to be democratic in their financial decisions, (democracy – a form of government in which the power is controlled by the people and exercised directly by them or by their elected agents under a free election system).  Instead, selective social democracy by Liberals and Conservatives and far right Conservative ideals that benefit the upper middle class and the wealthy over the poor are replacing social democracy.

Some examples of selective social democracy as outlined in this blog are 1)  Canada Pension Plan (CPP) enhancements that will benefit the wealthy more because the minimum wage on which CPP contributions are dependent is not being raised at equivalent levels to the enhancements, 2)  Old Age Security (OAS) clawbacks that don’t work so that almost all Canadian seniors receive OAS including the wealthy (oas), 3) upside down housing and food purchasing schemes that benefit the wealthy more than singles and the poor (affordable) (maslows-hierarchy-of-need), and 4) boutique tax credits which create a financial dependence on the nanny state (government) with resultant lower CPP pensions since CPP contributions are not collected on boutique tax credits (political-statements) (government).

This selective social democracy disparity has to be placed squarely at the feet of the Liberals and Conservatives as they are primarily the only parties that have been in power in this country.  Big business, Wall Street, outrageous salaries as in media and sports and big business, and gentrification can also be included here.

In the USA, far right Conservative policies like Donald Trump’s new tax plan give the top 1 percent more of a tax break than the middle class is yet another example.

Plutocratic capitalism and selective social democracy purposely rob from the poor to pay the wealthy.  They eliminate the middle class so that only the poor, the upper middle class and the wealthy are the prevailing classes and, therefore, are no different than governmental philosophies like communism and dictatorships which give financial wealth to one person or to the top very few.

Failure to recognize selective social democracy and to replace it with financial fairness for all citizens will only increase the financial disparity that the poor are facing in this country.  Children are being taught to be philanthropic with their lemonade stands and food drives to help the poor and underprivileged.  However, many parents fail to teach them how to handle finances or to think critically about how politicians like the Liberals and Conservatives are promoting selective social  democracy.  Continued programs like food drives and social community programs without providing an indexed living wage do nothing to eliminate the financial plight of the poor and disabled.

CONCLUSION

Financial intelligence and critical thinking of basic math, budgeting and common sense financial principles resulting in financially fair social democracy by governments and businesses for all citizens is required, not just for the upper middle class and wealthy.

DEFINITIONS

Online searching of definitions of communism, dictatorships, and plutocracy and many other -isms show that control is maintained by one person alone or by a very few wealthy persons.

Communism – a system of social organization in which all economic and social activity is controlled by a totalitarian state dominated by a single and self-perpetuating political party.  In the case of Russia, the country is controlled by Putin who, as he sees fit, will distribute the country’s wealth to himself and only a few other persons.

Dictatorship – a country, government, or the form of government in which absolute power is exercised by a dictator.  The country’s wealth is controlled by the dictator.

Plutocracy is a form of oligarchy and defines a society ruled or controlled by the small minority of the wealthiest citizens.  In the cases of Canada and the United States and other democratic countries the wealth is increasingly being controlled by the top wealthy corporations and individuals of the country.

(This blog is of a general nature about financial discrimination of individuals/singles.  It is not intended to provide personal or financial advice.)