CANADA PENSION PLAN ENHANCEMENTS WILL DO NOTHING TO ELIMINATE FINANCIAL DISCRIMINATION OF SINGLES AND THE POOR

CANADA PENSION PLAN ENHANCEMENTS WILL DO NOTHING TO ELIMINATE FINANCIAL DISCRIMINATION OF SINGLES AND THE POOR

(These thoughts are purely the blunt, no nonsense personal opinions of the author about financial fairness and discrimination and are not intended to provide personal or financial advice).

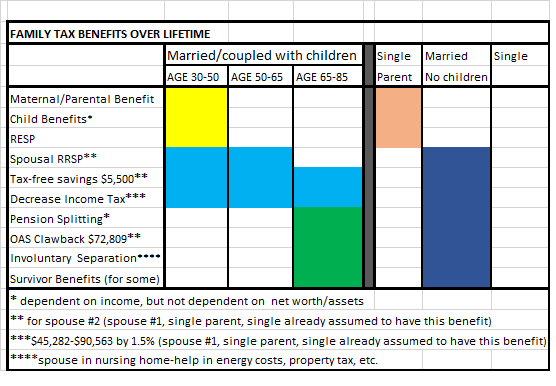
The last post discussed how the CPP plan in its present format financially discriminates against singles and the poor.  CPP is part of the Pillar 2 plan of Canada’s retirement income system for seniors.  The last post (program) showed how Canadian seniors will not receive full CPP benefit if they have not made full work contributions for forty years and if they do not have full Yearly Maximum Pensionable Earnings(YMPE) contributions for those forty years.  Canadians most likely to not receive full CPP benefits are those who have not worked for forty years or have not been able to make full contributions because of low income.  Senior singles also pay more and get less in seniors benefits (pay-more).

Recently there has been much discussion about CPP contributions and benefits being enhanced because Canadians are not saving enough for their retirement.  Apparently, the enhancements will include increasing the amount of required CPP contributions and, in return, the amount of CPP benefits received.

Enhancements include:  Once fully implemented in 2025, the total CPP contribution rate (which is shared between employees and employers) will increase from the current rate of 9.9 per cent to 11.9 per cent of eligible earnings up to a maximum of $72,500. In addition, earnings between $72,500 and $82,700 will also be subject to mandatory CPP contributions at a lower rate of 8 per cent.

CPP retirement benefits will also be increased. The replacement rate for pensionable earnings will increase from 25 per cent to 33 per cent. According to the Department of Finance, it will take “about 40 years” for the full increase in retirement benefits to be phased in.  The Department of Finance has stated that like the current program, future benefits will be based on the years of contribution and actual contributions.

The significance of these changes is astounding.  Future benefits will remain the same based on the two principles of the years of contributions and actual contributions, in other words, same old, same old.  The premise remains the same – individuals with highest YMPE will receive the most CCP, while those at lower income levels will receive the least CPP benefits because they have not been able to make maximum CPP contributions.

The YMPE will be be raised to between $72,500 and $82,700 (up from $54,900 or approximately $25 per hour in 2016).  Based on approximately 2,200 hours of work per year, $72,500 equals approximately $33 per hour and $82,700 equals approximately $38 per hour.  In other words, the more income an individual makes, the more CPP benefits they will receive.

In 2013, the minimum wage was around $10 in all provinces. In constant dollars, this rate was similar to the rate observed in the late 1970s.  It is only in the last several years that the minimum wage has increased somewhat.   Historically, Alberta’s minimum wage went from $8 in 2007 to $9.95 in 2013.   In addition to the stagnant wage, the Alberta income tax rate in 1999 went from a graduated rate based on income to a flat tax of 10%.  The tax rate for  the middle class and wealthy was changed to 10% while the rate for lower income individuals went up from 8% to 10%.

The 10% tax rate remained in place for about fourteen years until 2015, when the NDP came into power and reverted the flat tax system to a graduated system.The current minimum wage rose to $11.40 in October 2015 and is set to rise to $12.20 in October 2016.  This is has all been a result of the NDP party coming into power in Alberta after a forty year reign by the Progressive Conservative party.

At the present time, the difference between Alberta’s minimum wage today of $12.20 per hour and the present CPP YMPE rate of $25 per hour is striking.  What this means is that the middle class and wealthy working for forty years will be able to attain greater CPP wealth than the person earning a minimum wage who has faithfully worked for 40 years.  Why wouldn’t those working at minimum wage be angry and in utter despair at policy decisions that don’t financially include them with fairness and equality?  If ordinary persons without math degrees can figure this out, why can’t government, policy makers and businesses?

In order for there to be financial fairness, the minimum wage has to rise at same rate as the increase  the CPP YMPE rate!  Think that is going to happen, don’t hold your breath!

PROBLEMS:  

  • Governments and businesses give many excuses as to why minimum wage should not be raised
  • Businesses don’t want to pay the proposed increases of their required CPP employer contributions because they say it will impact their businesses-they are threatening to go to contract and part time employees.
  • Currently only two provinces index their minimum wages based on the Consumer Price Index, thus offering guaranteed protection from wage erosion. Currently, there is no accountability for those actually determining the minimum wage.
  • With new proposed enhancements earnings between $72,500 and $82,700 will also be subject to mandatory CPP contributions, but at a lower rate of 8 per cent.  Why is it that higher income earners always get the reduced rates?  Why should those earnings between $72,500 and $82,700 get a lower rate of 8 per cent?  What is the factual basis for choosing a lower rate for income range between $72,500 and $82,700?
  • Minimum wage or a living wage and income tax rates are two very important factors that help determine quality of financial life for singles and the poor.  So why is that politicians, governments and businesses always give better rates to higher income earners (middle class and wealthy than lower income earners and to families over singles)?  Those at lower income levels are more often made to pay more while getting less.  Examples of this are increasing minimum wage at pitiful rates and making lower income earners pay the same income tax rate while decreasing rates for the middle class and wealthy as described above (Alberta Conservative government).   The present Liberal party did same by reducing taxes only for the middle class, but not reducing rates for the poor.
  • Upside down finances continue to be perpetuated (finances) so that the poor are forcibly made to remain poor by the upside down financial decisions by government and politicians.  Why don’t single persons deserve a full CPP benefit if they have been faithfully employed for forty years, (never used EI, never used maternity/paternity benefits, etc.) but have not been able to contribute full YMPE because of a lower income?

CONCLUSION

The policy decisions by government for CPP enhancements past and present have created a pillar whose base is cracked and breaking.  The only way most ever singles, early divorced singles, single parents and the poor can ever hope to reach the maximum CPP YMPE is by working multiple jobs.   Married or coupled family units may have the option of both spouses working and receiving two CPP pensions.  The indexing of a minimum wage or a living wage is paramount in avoiding financial discrimination in CPP enhancements for singles and the poor. To do anything less is a blatant violation of the human and civil financial rights of poor and low income Canadians.

THE MINIMUM WAGE IN CANADA

An excellent article “The Minimum Wage in Canada” by the Canadian Labour Congress, April 2015 gives an excellent perspective on minimum wage (minwage).

Some of the details of this article include the following:  

“A profile of minimum wage workers will show that the stereotypical teenage employee is not the reality and many individuals are struggling to provide for their families on minimum wage incomes. Common concerns about increases to the minimum wage, such as a rise in unemployment rates, the financial impacts on small business, and alternative policy changes to address poverty will be discussed in order to break down the myth that an increase to the minimum wage will have detrimental economic impacts…..

British Columbia froze its minimum wage at $8.00 an hour for almost a decade.  During this freeze period minimum wage earners were put under increasing financial strain as inflation restricted their ability to consume.  Currently only two provinces index their minimum wages based on the Consumer Price Index, and are offered guaranteed protection from this type of wage erosion….

There are two clear considerations that must be made when evaluating the adequacy of the minimum wage in Canada….Letting the real value of the minimum wage deteriorate just creates a cycle of poverty….

For those who oppose increasing the minimum wage in Canada, there are several arguments used to justify maintaining low rates. …The amount of people earning the minimum wage has remained under 10% of the total working population. This is not a large enough portion of the population to make a difference; if most people already earn above the minimum wage there’s no need to increase it. One thing often used to strengthen this argument is that, of the small number of minimum wage workers that exist, the majority are teenagers or students who are not attempting to support a family. Instead, they are working for personal money or for the experience and will soon move up the job ladder. The first major issue with this argument is that it blatantly accepts discrimination as a reason to pay someone low wages. Age is one of the prohibited grounds outlined in Section 15(1) of the Canadian Charter of Rights and Freedoms which guarantees all citizens equal and fair treatment under the law. To say that the wages of adults should be prioritized over the wages of young workers is a clear violation of this right. The purpose of setting a minimum wage is to create a sense of equality for vulnerable workers of all ages. Second, teens account for less than half of the minimum wage earners, so there are quite a few adults in Canada earning the lowest legal wages. Young adults may not have been active in the labour market for long but they are just that, legal adults who have financial responsibilities. Some do attend a post-secondary institute; however, that does not mean they are working out of choice. Not all young people have the financial support of their families to help them pursue their education. They rely on their paid employment to cover the ever increasing costs associated with education. ….The reality is that minimum wage earners are not one specific group of people and they definitely do not fit the stereotype of a few teenagers and students getting their first jobs. ….

The philosophy associated with our economic system is the constant need to keep costs as low as possible, which also means low wages for much of our workforce …. The theory is that as wages increase operation costs, employers are forced to find other ways to make up the difference. ….Although Canada’s unemployment rate has made some recovery since the 2009 recession, as of August 2014 it was still 7.0%…. Given the current economic climate, this argument suggests that the potential repercussions that increasing the minimum wage might have on unemployment rates, could seriously affect Canadian society. After examining the economic research available on the connection between unemployment and minimum wage increases, it is difficult to say with conviction how the two factors are related, if they are at all….. According to The World Bank’s World Development Report 2013: Jobs, there is no known universal impact of the minimum wage on unemployment rates. In order to say with certainty what the impact actually is, individual countries would have to closely monitor the labour market and compile vast amounts of research (World Bank, 2012). Our opinion on the matter is very similar. Based on the research that has already been done, there is too much contradicting evidence to say with confidence what the real effects on unemployment rates are.

A proposed alternative to increasing the minimum wage is to instead increase the basic personal tax exemption…..This policy does not introduce more money into the economy, it simply redirects it from government revenues to individual households. ….The redistribution of money does not make Canadians better off, it only continues to subsidize the low wages offered by employers…..

Minimum wage workers are more likely to be employed with a large firm than a small company; a troubling trend that requires further examination.  This recognition that large scale companies are more likely to pay the minimum wage than small businesses raises some serious concerns about who is utilizing minimum wage laws and why. ….However, some of Canada’s largest companies continue to offer many of their staff members only the minimum wage despite their recent success and profitability…..

Individuals earning low wages are the least likely to be meeting all their needs, so when their wages increase instead of saving their new income they use it to purchase the goods they have been lacking. This directly contrasts the wealthy who are more likely to save or invest additional income than inject it back into the local economy.

Minimum wage laws can actually benefit communities. Studies have shown that because individuals cannot afford to financially support their households on the minimum wage, they often turn to social services for assistance ….This means that the taxpayers are essentially subsidizing the low wages of a company that makes billions in profits. Additionally, when large firms move into an area and offer low priced goods, it drives down the wages of workers employed at small firms that need to reduce costs to stay competitive….. In some cases, not only will wages in the area drop but small employers will be forced to close—eliminating jobs altogether.

Even with most provinces attempting to conduct neutral reviews on the minimum wage rate, the final decision still remains politically motivated. One team of researchers found that, while the proximity of an election did not influence the decision to alter the minimum wage, the political ideologies of the government in power did. The New Democratic Party in particular were more likely to have a higher minimum wage rate in place than other parties (Dickson & Myatt, 2002). A 2006 study (Green & Harrison, 2006) found similar trends relating to the minimum wage and political agendas; conservative governments would let the minimum wage stagnate and centre-left parties would approve increases but neither were willing to make drastic changes. ….The issues at play when debating the appropriate minimum wage rate are complex, as it is not exclusively an economic policy….. Rather it is the ideology of “universal fairness” that generates support ….. This attitude is further portrayed by research that suggests the public perception of poverty is not to blame the victim. One study found that respondents, instead of citing the self-destructive behaviours of individuals like laziness and the inability to adhere to a budget, were more inclined to believe structural factors were the major contributors to poverty. This included social and economic factors like low wages (Love, et al, 2006). Individuals also recognized that employment no longer guaranteed people the means to escape poverty, as wages are often insufficient and, while workers are often willing to work more hours, full time positions are becoming more rare (Love, et al, 2006). The reality is that minimum wage policy is an economic, political, and social matter. As Canadians we must decide what we need from our minimum wage rates, then determine how to balance all these factors to achieve that goal. Decreasing wage inequality should be the first priority, as minimum wage policies have the potential to prevent extreme poverty. Increase the wages of other low paid workers and allow individuals to accumulate more financial support (World Bank, 2012). We must decide what quality of life we feel all Canadians deserve. Should full-time workers only be able to meet their basic needs like food and shelter, or are they entitled to a lifestyle that also considers their social and political well-being when determining basic living standards….? It is not possible to set the minimum wage based solely on economic factors because these broader social implications are the end results for Canadians.

Currently, there is no accountability for those actually determining the minimum wage.

This is not an issue that only affects businesses, so the human aspect needs to be given more priority in the minimum wage debate. While it is important for our economy to remain stable, we must also ensure the needs of workers are being met. They should be able to enjoy a certain standard of living; however, full-time employment is no longer a guaranteed escape from poverty. It is time to evaluate what our society deems fair, and compensate minimum wage workers accordingly. Raising the value of labour at the bottom, is a raise for everyone in Canada”.

(This blog is of a general nature about financial discrimination of individuals/singles.  It is not intended to provide personal or financial advice).

CANADA PENSION PLAN JUST ANOTHER GOVERNMENT PROGRAM PROMOTING FINANCIAL DISCRIMINATION OF SINGLES AND THE POOR

CANADA PENSION PLAN JUST ANOTHER GOVERNMENT PROGRAM PROMOTING FINANCIAL DISCRIMINATION OF SINGLES AND THE POOR

(These thoughts are purely the blunt, no nonsense personal opinions of the author about financial fairness and discrimination and are not intended to provide personal or financial advice).

(singles-need-to-learn-how-to-articulate-financial-discrimination-of-singles)

Our last post discussed the financial discrimination of Old Age Security (OAS).  This post discusses the financial discrimination of the Canada Pension Plan (CPP).

CPP is part of the Pillar 2 plan of Canada’s retirement income system for seniors.  Some of the attributes of the plan are:

  • Federal government and Provinces are joint stewards of the CPP
  • Provides retirement, survivor, and disability benefits
  • Universal coverage of all workers in all industries
  • Employees and employers make equal contributions (4.95% each – 9.9% combined in 2015?) on earnings up to annual maximum of $54,900 (2016)
  • Defined Benefit – up to 25% of the average wage
  • Fully portable
  • Inflation-indexed to CPI
  • Actuarially sound for the next 75 years
  • The maximum CPP benefit for 2016 is $1,092.50 per month.

Unfortunately, most Canadians do not realize that the average Canadian will not receive the maximum CPP on retirement.  In fact, most will only receive about $643 per month of CPP maximum.  Why is this so?

Jim Yiu from ‘Retire Happy’ in his article “How much will you get from Canada Pension Plan in Retirement?” states (words in italics are my words):  

‘When planning for retirement, the first piece of advice given is not to plan on getting the maximum.  When you look at the average payout of CPP, it’s just a little over $643 per month in 2016, which is a long way from the maximum. In other words, not everyone gets the maximum. At the most basic level, the amount you get from CPP depends on how much you put into CPP.

Why is it that so many people do not qualify for the maximum amount of CPP? The best way to answer that is to look at how you get the maximum retirement benefit. Eligibility to receive the maximum CPP benefit is based on meeting two criteria:

  1. Contributions – The first criteria is you must contribute into CPP for at least 83% of the time that you are eligible to contribute. Essentially, you are eligible to contribute to CPP from the age of 18 to 65, which is 47 years. 83% of 47 years is 39 years. Thus, the way to look at CPP is on a 39-point system. If you did not contribute into CPP for at least 39 years between the ages of 18 to 65, then you won’t get the maximum. If so, then you might get the maximum but there is another consideration.
  2. Amount of contributions – Every year you work and contribute to CPP between the age of 18 and 65, you add to your benefit. To qualify for the maximum, you must not only contribute to CPP for 39 years but you must also contribute ‘enough’ in each of those years. CPP uses something called the Yearly Maximum Pensionable Earnings (YMPE) to determine whether you contributed enough. (For 2016 the YMPE is $54,900 – EQUIVALENT TO ABOUT $25 PER HOUR).

Basically if you make less than $53,600 of income in 2015 ($54,900 in 2016), you will not contribute enough to CPP to qualify for a point on the 39-point system…..As you can see, it’s not easy to qualify for full CPP especially with the trend of people entering into the workplace later because of education and people retiring earlier.  If you have 39 maximum years of contribution you’ll get the maximum CPP amount. If you have 20 maximum years of contributions you will get approximately half the maximum (you might get some partial credits for part years).

Planning your retirement needs and income requires some understanding of how much you will get from CPP. Many people either assume they will get the maximum or assume they will get nothing at all because they fear the benefit may not be there in the future. Both these assumptions have significant flaws. Take the time to personalize the planning by understanding how the CPP benefit is calculated and how much you will receive.’

ANALYSIS

Reasons why CPP is financially discriminatory to singles with low/moderate incomes and the poor:

    1. The YMPE 2016 salary to get maximum CPP benefits is $54,900 (up $1,300 from last year).  If average annual hours of work equals 2,200 hours then YMPE salary will be approximately $25 per hour.  Many singles and the poor do not have $25/hr. jobs.  In addition politicians, government, and businesses generally refuse to increase the minimum wage or ensure a living wage for all Canadians. If the YMPE is increased by $1,300, why aren’t the wages increased by the same amount for the poor so they can also contribute more to CPP?  Even those persons who work faithfully at full time jobs for forty years, but don’t have $25 per hour jobs will not receive full CPP benefits.  (Is this really what they deserve after working faithfully for their country for forty years)?  So who benefits most from CPP?  It is the middle class and wealthy who have at least $25/hr. jobs and, therefore, are able to get full  CPP benefits.
    2. Early retirement – who gets to retire early?  It is generally the upper middle class and wealthy married or coupled family units because of the marital manna benefits they receive, high incomes and the net worth they have.   In reality many of these families really do not need full CPP benefits.  From personal experience of this blog author, some married or coupled spouses will say both spouses do not need to work when really both spouses should be working or because of their high income only need one spouse working.  (To get full  CPP benefits each Canadian born citizen needs to contribute into CPP for at least 39 years between the ages of 18 to 65.   And, Canadians must not only contribute to CPP for 39 years but they must also contribute ‘enough’ to maximum of YMPE in each of these years).
    3. Marital manna benefits – Married or coupled family units have received many marital manna benefits that allows them to achieve more wealth than many singles and the poor.  One such example is the Child Rearing Drop-out Benefit.  CPP benefits may be increased for years that spouse did not generate income because of staying home to rear child from ages 1 to 6.  This is not necessarily a bad thing in and of itself, but those who are more likely to be able to stay home for child rearing are those with healthy incomes.
    4. Perception of financial  need –  Many politicians, governments, and financial planners have misconceived perceptions that financial goals should be for Canadians to have equal or higher pension income than while working.  In other words, if poor, it is okay to always be poor even in retirement.  For middle class or wealthy they say the goal should be equal or more pension income than working income even with high net worth and assets.  In reality, institutions like the OECD states less wealthy need 100% retirement income  of working income, while wealthy need retirement incomes that are much less of working income.  What is left out of these perceptions is quality of life.  Equal or higher pension income than income while working for singles with low/moderate incomes and the poor especially if paying rent or mortgage in retirement often does not equal a good quality of life.
    5. Proposed enhancements to CPP contributions and benefits – Proposed enhancements where CPP retirement pensions will be higher if taken after age 65 and./or will be higher if person works past age 65 are very good things. However, it is likely that singles and the poor are not the ones who will be able to postpone receiving their CPP benefits, and it is also more likely that singles and the poor are the ones who will need to work longer.  As for increasing CPP contributions now so that CPP benefits can be increased in the future, this generally is a good thing; however, the stress of having to contribute more will be more financially distressing for singles with low and moderate incomes and the poor rather than the middle class and the wealthy.

CONCLUSION

It seems to be more important for politicians and governments to ensure that upper-middle class and wealthy maintain their standard of living than it is to treat ever singles, early divorced singles, single parents and the poor fairly in benefits they receive (cpp).

Upside-down financial systems (upside-down) and marital manna benefits have created a nanny state where married/coupled persons want it all and once these benefits are in place, it is very difficult to eliminate them because of voter entitlement.  Upper middle class and wealthy married/coupled persons have been made irresponsible by their own politicians and government.  Many are not living an equal life style in their retirement, but a much better lifestyle.  A further question is whether these programs will be financially sustainable because upper class and wealthy married or coupled family units have not contributed enough to pay for these benefits.

Much is required of all family units regardless of marital status to educate themselves on what their actual retirement income will be.  If you don’t work, you won’t get CPP.   You won’t get CPP if you don’t work.  You won’t get CPP if you don’t make CPP contributions, for example, working ‘under the table’.  (And, wouldn’t it be nice for parents to pass this financial information onto their children so that their children will also make wise financial decisions)!  Much is required of financial planners to educate themselves on quality of life issues, not just equal or higher pension incomes.  Much is required of politicians and governments to educate themselves on how financially discriminatory many of the pension benefits are and to make changes so that there is financial equality and fairness in distribution of pension benefits for every Canadian,not just middle class married or coupled family units and the wealthy.

(This blog is of a general nature about financial discrimination of individuals/singles.  It is not intended to provide personal or financial advice).

OAS CLAWBACK OUTRAGEOUSLY BENEFICIAL TO UPPER MIDDLE-CLASS MARRIED OR COUPLED SENIORS, BUT FINANCIALLY DISCRIMINATORY TO SINGLES AND POOR

OAS CLAWBACK OUTRAGEOUSLY BENEFICIAL TO UPPER MIDDLE-CLASS MARRIED OR COUPLED SENIORS, BUT FINANCIALLY DISCRIMINATORY TO SINGLES AND POOR

(These thoughts are purely the blunt, no nonsense personal opinions of the author about financial fairness and discrimination and are not intended to provide personal or financial advice).

(six-reasons-why-married-coupled-persons-are-able-to-achieve-more-financial-power-wealth)

Occasionally, there are topics that give one pause resulting in questioning as to the efficacy of the  formulation behind the topic.  The OAS Clawback (proper name is OAS Recovery tax as per Canada Revenue Agency) and the financial discriminatory properties behind the program is one such topic.  One way to resolve the questioning is to look at the topic in detail.

OAS is a federal social program designed to provide a very modest pension to low- and middle-income retirees.  It is part of the universal government benefits for seniors (pillar 1) to ensure income security for senior Canadians.  In 2016 the OAS maximum amount is $6,680 for a single person and $13,760 for a couple. OAS clawback which began around 2011 does very little to clawback the income of upper middle class persons, particularly married or coupled family units.  The clawback of OAS benefits in 2016 starts with a net income per person of $72,809 (couple $145,618)  and completely eliminates OAS with income of $118,055 (couple $236,110).  The repayment calculation is based on the difference between personal income and the threshold amount for the year. The repayment of OAS is 15 percent of that amount.  All OAS is clawed back if personal income is over $118,055.

According to Human Resource Development Canada, only about five percent of seniors receive reduced OAS pensions, and only two percent lose the entire amount.  This program benefits wealthy couples and widowers the most.  OAS clawback for couple only begins at net income of $145,618 ($72,809 per person) thus allowing them to receive full OAS of $13,760 as a couple.  There are not many ever single seniors, early divorced in life seniors and single parent seniors who could hope to achieve a net income of $72,809; however, for wealthy widowers this may be easier to achieve and they are the ones who complain about clawback.

An example of OAS clawback is the following example:  

The threshold for 2015 is $72,809.  If your income in 2015 was $80,000, then your repayment would be 15 percent of the difference between $80,000 and $72,809:

$80,000 – $72,809 = $7,191

$7,191 x 0.15 = $1,078.65

You would have to repay $1,078.65 for the July 2016 – June 2017 period.

Many financial advisors will give strategies on how to avoid the clawback while benefitting married or coupled family units the most.  This is just another example of financial marital manna benefits and manipulation of assets that within the legal limits of Canada Revenue Agency’s laws allows married or coupled person to increase their wealth (manipulation-of-assets).  This also is just another example of the upside finances perpetuated in this country by politicians, government and businesses that benefit married or coupled persons the most (quality-of-life).

From a financial advisor comes this statement (claw-back):  “I also want to put the impact of the claw back into perspective. Although no one likes to give up $6,600 in free money, it’s not like you were going to get to keep it all anyway. As the OAS is taxable, most people in the claw back zone would have paid back over 30% of it in taxes.

Secondly, some clients look at paying claw back as the cost of doing business; while they may not love it, they look at it as a price of their own financial success and as money they really don’t need anyway. Moreover, they might correctly see that in some cases combatting the claw back isn’t worth the effort. For example, although the rest of the article will focus on how dividends are often bad news for retirees trying to avoid the claw back, these same people might also be reluctant to modify their investments to produce other types of investment returns, especially if that means unnecessarily courting more investment risk or triggering a big capital gain in order to rebalance their portfolios”.

Limiting OAS Clawback

There are a few strategies you can implement to reduce clawback amounts (strategies):

  1. Split your pension with your spouse. If your spouse has a lower income, you can transfer up to 50 percent to your spouse, which should reduce your overall income. This could also include a Registered Retirement Income Fund and annuity income.
  2. Dip into your Registered Retirement Savings Plan before you turn 65. An RRSP is only a tax deferral, meaning that at some point, you’ll have to pay those taxes. Consider taking funds out before reaching the age of 65 so you do not lose the OAS.
  3. Use your tax-free savings accounts to generate investment income, which is non-taxable and would not count towards your net income.
  4. Interest on funds borrowed to earn investment income can be deducted and could reduce your net income.
  5. Watch for capital gains. If you are planning a sale of an asset that could trigger large capital gains, consider selling it before you turn 65.

From another financial planner (minimizing-clawback):  “At the end of the day, more people’s concern over OAS clawback will not be such a big deal simply because there are not a lot of people over the age of 65 making more than $72,809 of income. The people that do may have significant pensions or continue to work and earn and income over the age of 65. There will also be a group of people that trigger significant capital gains from the sale of second property or investments but the good news is they will only lose part or all of there OAS in the one year that the capital gains is realized and reported on the tax return. But if you happen to be one of the few that will get affected, make sure you plan ahead accordingly”.

CONCLUSION

The OAS clawback (implemented by Conservative party) is just another example of how politicians and government have ensured that senior upper middle class married or coupled family units with incomes between $72,809 to $118,055 net income per person will benefit more from the OAS government program. These same politicians and government agencies have financially discriminated against ever single seniors, early divorced in life seniors and single parent seniors by ensuring only five percent of seniors will receive reduced OAS pensions, and only two percent lose the entire amount.  Note we have specifically stated upper middle class married or coupled family units because wealthy married and coupled family units have already been excluded from receiving OAS pension by virtue of the $$118,055 (couple $236,110) net income limit.

To add further insult, politicians and government have ensured that the upper middle class will receive benefit upon benefit upon benefit to reduce the effects of the OAS recovery tax program.  The Liberal party (now ruling federal party) implemented a 1.5% reduction in income tax for incomes between $45,282 and $90,563.  These are middle class incomes, not incomes of the poor. Pension splitting is another program that reduces the possibility of OAS clawback.  As stated above, past governments have also ensured that marital manna benefits and ability to manipulate assets have been been given primarily to married or coupled family units all within legal limits of financial laws.  All of these benefits perpetuate an upside-down financial system where the upper middle class and the wealthy are able to achieve greater wealth than ever single, early divorced in life and single parent seniors.  In other words, the OAS Recovery Tax program (supposed to provide income security for poorer seniors) is a failed program which ensures greater wealth for the upper middle class and greater poverty for singles and the poor.

SOLUTION (added August 31, 2016)

Equivalence scales (scales) and net worth –  how many times can it be said over and over again that wealthy and upper middle class married or coupled family units are increasing their wealth by government programs designed to give more to these family units?  To correct this financial discrimination and upside finances for singles and the poor, equivalence scales and net worth need to be applied to these programs.  Monies saved could then be redistributed to the poor regardless of marital status.

(This blog is of a general nature about financial discrimination of individuals/singles.  It is not intended to provide personal or financial advice).

HISTORY OF FAMILY TAX CREDITS OVER DECADES ARE FINANCIALLY DISCRIMINATING TO SINGLES – Part 2 of 2

HISTORY OF FAMILY TAX CREDITS OVER DECADES ARE FINANCIALLY DISCRIMINATING TO SINGLES – Part 2 of 2

(These thoughts are purely the blunt, no nonsense personal opinions of the author about financial fairness and discrimination and are not intended to provide personal or financial advice).

The August 2, 2016 post (decades) outlined almost all of the family tax credits that have been brought into play over the decades.  Many are financially discriminating because they leave  ever singles and early divorced singles out of the equations.  Single parents do receive some of these benefits for their children, but are not included in all the benefits afforded to having a spouse or partner.

family tax benefits over lifetime

The above table (updated Aug. 29/16) shows benefits available to a married or coupled family units with children from time they are able to use maternal and parental benefits to time of death of one spouse (yellow, blue and green fill in).  Single parents only have benefits related to their children (orange fill in).  Married or coupled family units without children have all the benefits related to having a spouse or partner (navy fill in).  Ever singles and early divorced singles, have none of the benefits available to married or coupled family units (fill in is blank because they have none of the benefits of spouse #2. In addition, they are often are unable to max out RRSP and TFSA contributions).  (While late in life divorced singles have none of the benefits for spouse #2, they may have been able to accumulate more net worth and assets while they had a spouse or partner).

Age categories of age 30 to 50 years are used to show suggested family unit of two children, one newborn and second child born two years later.  Life expectancy for Canadians is 80 for men and 84 for women so ages in table were calculated to age 85 assuming both spouses were still alive at age 85.

Estimation of the ADVANTAGES OF BENEFITS include the following:

Maternity and Parental Benefits

It is difficult to determine total number of Canadians who have receive EI benefits in a year as statistics seem to be based on month to month data.  However, there are studies that state annually about 25% of EI claimants receive maternity and parental benefits.  (Some parents may not receive these benefits if they did not contribute to EI or were not employed long enough receive any benefits).

StatsCan’s latest data on Employment Insurance recipients indicates Canada’s federal government (huffingtonpost) is growing stingier with EI benefits since Canada’s EI regime has been significantly toughened under Harper’s Conservative government. Changes that came into place include tougher, more complex rules for keeping EI benefits, and a new requirement that EI beneficiaries who have used EI frequently have to take any job available to them and accept as much as a 30-per-cent pay cut.

There is no such restrictions for maternal and parental benefits.  Although the benefits have a defined time limit (usually up to a year), there is no exhaustion of time limits for benefits for maternity and parental benefits as there is for regular unemployed persons (also can have benefits for multiple pregnancies).  While it is acknowledged that mothers go through stress of caring for a new infant, it should also be acknowledged that unemployed persons receiving EI go through stress of applying for EI and then constantly have to be looking for a job while EI benefits are running out and they have no money to pay for expenses.  Employees in EI offices are often not the most pleasant people to deal with.

Question:  do beneficiaries of EI (i.e. two or more children) use more benefits than other beneficiaries during working life of 35 years?  Present maximum EI contributions equal about $1,000 per year.  Over a 35 year period of working, contributions by a married or coupled family if both spouses are working is approximately $70,000 (this only holds true if each spouse is employed for 35 years each, many wealthier couples retire at age 60, not 65).  If a married or coupled family unit have two children with a maximum allowed $50,800 EI yearly insurable earnings at 55%, they will basically have used a large portion of the monies they contributed to the plan (with three children they will definitely likely have used all monies contributed).

Study ‘Benefitting from Extended Parental Leave’, March 2003, Katherine Marshall (statcan):  “Significantly more mothers who returned within eight months reported annual earnings below $20,000 in their previous or current job (49%) compared with those who returned after almost a year (29%) … this suggests that women with lower earnings (and possibly lower savings) may not be financially able to stay at home for an entire year on 55% of their earnings….Also, more likely to be a household where total income was under $40,000 (46%) compared with those who returned between nine and twelve months (38%)”.  Many families and family organizations are lobbying for the lengthening of maternal and parental leaves to two years.  It has to be stated once again that upside down financing ensures that more wealthy parents get to use full EI benefits than poor parents. Dollar value assigned for maximum maternity and parental EI benefits for two children equals approximately $55,880 ($50,800 X 55% X two children).

Canada Child Benefits – the outrageous discrimination of this program where net worth and assets has not been taken into consideration has already been discussed (poverty). Maximum annual Canada Child Benefits for 2016 are set at $6,400 per child ages one and up to six years and $5,500 for children ages 6 to 17.  Dollar value calculation using ‘middle of the road’ value (maximum values divided by 2) of $6,400 and $5.400 annually ($3,200 times five years times two children ages 1 and up to six equals approximately $32,000, $2,700 times 12 years times 2 children ages 6 to 17 equals approximately $64,800) equals a total of approximately $96,800.

Registered Education Savings Plan (RESP) based on the amount of the RESP contributions and income level, the government may additionally contribute up to $7,200 per child as well as other grants. Dollar value for two children may total at least $14,400 of government benefits not counting other grants such as provincial grants.

Spousal Registered Retirement Savings Plan (RRSP) allows a higher earner, called a spousal contributor, to contribute to an RRSP in their spouse’s name (it is the spouse who is the account holder).  A spousal  RRSP is a means of splitting income while working and during retirement and, therefore, possibly pay less tax. (It is not possible to calculate how much income tax might be saved).

Tax Free Savings Account (TFSA) – implemented in year 2009 with maximum contribution allowed per person of $5,500.  For years 2009 to 2016, the approximate maximum allowable amounts for spouse #2 is a total $42,000 (all tax free and not including monies generated from investments).  The Canadian Parliamentary Budget Office states “the TFSA program is regressive, overall, it offers no additional benefit to low- or middle-wealth households” (global) .  TFSAs for the wealthy are used as tax shelters.  It has been suggested that one half of Canadians have a TFSA account, but only half of those with the account have contributed to the account on a regular basis.  It is a well known fact that mostly wealthy Canadians have been able to contribute the maximum amounts to their accounts even in their senior years (another upside financial scheme to allow wealthier Canadians to gain even more wealth).  Many singles and poor families do not have the financial ability to max out their TFSA contributions.  Dollar value used for spouse #2-lifespan from age 30 to 85 years equals $5,500 time 55 years for a total of $302,500.

Income tax (federal) decreased by 1.5% for those earning between $45,282 and $90,563 – each spouse receives benefit of reduced income tax.  Using 2015 Canada Income Tax form, the calculated income tax for approximate income between $45,282 and $90,563 is $16,539.  A 1.5% tax reduction equals $248 annually.  The majority of ever singles and early divorced persons do not have incomes over $45,282, especially seniors. While middle class families with children get less of the Canada Child Benefit, this is offset by the reduced income tax. This is one benefit piled on top of another benefit.  Dollar value used for spouse #2 (assuming 55 working years) is $248 time 55 working years for a total of $13,640.

Pension Splittingallows splitting of the pension income between spouses to reduce tax paid.  This strategy allows the spouse who has the highest income to lower his/her tax payable by sharing up to 50% of his/her pension income with his/her spouse.  Apparently 2.2 million Canadian seniors benefit from pension income splitting.   This may also allow the higher earner to receive the full OAS benefit without clawbacks.  Review of online data (Splitting) shows:  “of the $1.2 billion federal cost for pension splitting in 2015, $250 million of that cost is due to increases in OAS payments that wouldn’t have otherwise occurred. Hole. Wealthiest 10% of families get 31% of this benefit while bottom 50% of families get 2% of the benefits.  Single-parent families and Canadians living alone would gain no benefit from the creation of this tax loophole.   The gains from the pension income splitting loophole go disproportionately to the richest four deciles—the richest 40% of the Canadian senior population. In fact, the richer the senior family, the more it receives from this loophole. The poorer the senior family, the less support it receives. The poorest 10% of seniors receive an average of 10 cents in terms of a tax break from this loophole, whereas the richest 10% receive an average of $820 in perks. The richest 10% of senior families receive more benefit from this loophole than the bottom 70%. Looking at it from another vantage point, one out of five of the richest 10% of Canada’s senior families receive a cheque for over $1,000 from this program while three out of five make some gain from it. Of the poorest half of all senior families, only one out of every 1,000 seniors gets more than $1,000 from pension income splitting. Seven out of 10 seniors enjoy no benefit at all from this tax loophole. The poorest half of all senior families—they’re making less than $36,000 a year—receive only $2 out of ever $100 paid out by this loophole. In contrast, the richest 10% of senior families making over $85,000 receive $30 out of every $100 paid out. Most of the seniors in the bottom 40% of the income distribution are single women. As such, there is no one to split with and therefore no benefit from this loophole. The cost of this tax loophole is large and gets larger every year. While most of this program’s payouts are going to Canada’s richest seniors who don’t need extra support, there remain seniors who live below the poverty line.  In fact, to lift all Canadian seniors above the After-Tax Low Income Measure (AT-LIM) poverty line in Canada, it would cost approximately $1.5 billion a year—slightly less than Canadian governments are currently spending to support Canada’s richest seniors.  As with many government decisions, budgets are all about policy choices: in the case of pension income splitting, the political choice is to support rich senior families instead of lifting all seniors out of poverty – even though they both cost approximately the same.  While income splitting is often touted as a loophole for middle class Canadians, this study illustrates how in reality, it is actually a loophole for Canada’s richest families…..The richer the family, the more it stands to gain; the poorer the family, the more it stands to lose. Under any income splitting scenario, the bottom six deciles of Canadian families wouldn’t even get an equal share of the benefits”.  Dollar Value:  If the richest 10% receive an average of $820 in these perks annually, then $800 at 20 years from age 65 to 85 equals $16,000 in income tax savings not including the benefits received from OAS not being clawbacked.

OAS Clawbackthe clawback of OAS benefits in 2016 starts with a net income per person $72,809 (couple $145,618)  and completely eliminates OAS with income of $118,055 (couple $236,110).  According to Human Resource Development Canada, only about five percent of seniors receive reduced OAS pensions, and only two percent lose the entire amount.  This program benefits wealthy couples and widowers the most. Essentially, there is virtually no clawback for the wealthy so no dollar value is calculated. No dollar value attached, but it is apparent that upside down financing prevails and wealthy families lose nothing-they get to retain their wealth.  The OAS Clawback benefit is basically a useless benefit.

Involuntary Separation Benefit –  in Involuntary Separation (spouse in nursing home), certain benefits may help pay for energy costs, and provides relief for sales and property tax and may also allow a portion of the Long-Term Care Home accommodation cost to remain with the spouse in the community. Qualifying under “Involuntary Separation” would allow both spouses to receive their pensions as single individuals (usually applies to low income seniors).  Not possible to calculate dollar value.

Survivor Benefits – benefits can apply to pensions including public pensions.  Details will not be discussed here and no dollar value has been assigned.

LOST DOLLAR VALUE TO SINGLES or looking at it in another way – Estimated Positive Dollar Value for married or coupled family units with two children

  • Maternal and Parental Benefits $55,880
  • Canada Child Benefits $96,800
  • RESP $14,400
  • Spousal RRSP (not possible to estimate dollar value)
  • TFSA $302,500
  • Income tax Reduction $13,640
  • Pension splitting $16,000
  • OAS Clawback (useless benefit as only richest 5% of Canadians get clawbacked-most married or coupled Canadians get to keep their OAS even with wealth)
  • Total $490,220

Estimated Positive Dollar Value for married or coupled family units without children

  • Spousal RRSP (not possible to estimate dollar value)
  • TFSA $302,500
  • Income tax Reduction $13,640
  • Pension splitting $16,000
  • Total $332,140

Estimated Positive Dollar Value for Single Parent with two children                    (added Aug. 24/16)

  • Maternal and Parental Benefits $55,880
  • Canada Child Benefits $96,800
  • RESP $14,400
  • Total $167,080

Estimated Positive Dollar Value for Ever Single and Early Divorced Singles  – Total $0 due to fact of no children and no spouse or partner (added Aug. 24/16)

CONCLUSION

New Canada Child Benefits if they continue in perpetuity for next twenty years implies that many middle class and wealthy married and coupled family units with children will receive benefits that equal the costs of raising children (estimated $250,000 per child) while growing their wealth.  Benefits on top of benefits and overlapping of benefits are most advantageous for married or coupled persons with children and without children.  Some benefits carry through all the way from age 30 to age 85.

While it is recognized that this exercise has only a gestimate of dollar values, there can be no doubt that many of the benefits (most initiated by the Conservative and perpetuated by the Liberal Party) continue to increase wealth for middle class and higher income married and coupled family units with and without children.  Singles parents only receive the child benefits.  Singles, single parents and poor families can never financially achieve same kind of wealth as married or coupled family units because they have been left out of financial formulas due to financial discrimination.  The political will is to support rich families instead of lifting singles and poor families out of poverty.

(This blog is of a general nature about financial discrimination of individuals/singles.  It is not intended to provide personal or financial advice).

EQUIVALENCE SCALES IN RELATION TO COST OF LIVING

EQUIVALENCE SCALES IN RELATION TO COST OF LIVING

(These thoughts are purely the blunt, no nonsense personal opinions of the author about financial fairness and discrimination and are not intended to provide personal or financial advice).

It should be noted that there is no perfect system; however,  the equivalence scales system is one method that provides a decent measure of eliminating financial discrimination and promotion of financial fairness with respect to cost of living assessments for all members of family units regardless of marital status.

Equivalence scales have been used to provide comparisons of costs of living between different family units (households).  The OECD (Organization for Economic Cooperation and Development) modified equivalence scale and square root equivalence scales are two examples.  The basis for equivalence scales are described as follows:  The needs of a household grow with each additional member but – due to economies of scale in consumption– not in a proportional way. Needs for housing space, electricity, etc. will not be three times as high for a household with three members than for a single person. With the help of equivalence scales each household type in the population is assigned a value in proportion to its needs. The factors commonly taken into account to assign these values are the size of the household and the age of its members (whether they are adults or children).

Table for two equivalence scales (updated March 29, 2017 – full StatsCan table available online):

equivalence scales

Statistics Canada 75F0002M – Section 2 ‘The LIM and proposed Modifications’  (75f0002m) provides an excellent overview of what is happening in Canada.  This paper proposes  modifications to the existing LIM (Low Income Measure) methodology.  “The first is to replace economic family by household as the basic accounting unit in which individuals pool income and enjoy economies of scale in consumption.   Secondly and equally if not more important, household is the international standard in comparative statistical surveys of income and well-being while the economic family concept is rarely employed by other countries.  Under the proposed modification, an individual will be defined as in low-income if the household as a whole is in low-income which in turn will generate different low-income statistics.   Adopting the square root equivalence scale – the square root has declining factors for each subsequent member while the LIM scale does not, and thus flattens out after the third member.. Furthermore, under the Square Root scale one needs only consider how many people are in the family whereas using the LIM scale one needs to keep in mind both the age of family members as well as whether the family is a single parent family”.

Added- December 1, 2017

The following explanation for equivalence scales as applied to LIM (Low Income Measure) has been taken from statcan.gc.ca/nhs-enm/2011

“The equivalence scales are employed to account for the economies of scales in consumption for different family compositions and sizes. A family of two persons needs more income than a single-person family, but not twice as much to maintain the same standard of living. Consequently, if the single-person family needs one unit of income, the two-person family needs more than one but less than two units of income. The equivalence scale system under LIM assigns a one to a single-person family, 1.4 to a two-person family (two adults or one adult and one child under 16 years of age), 1.7 to a three-person family consisting of two adults and one child, etc…….

Table 1 contains the after-tax LIM thresholds for the year 2006. Using data from the Survey of Labour and Income Dynamics (SLID), the estimated median of adjusted after-tax family income is $30,358. Thus the standard LIM threshold is $30,358 ÷ 2 = $15,179. The LIM threshold for a single-person family is simply equal to the standard threshold since its equivalent size is unit. For a family of size 2, since its equivalence scale is 1.4, its LIM threshold would be $15,179 x 1.4 = $21,251…….

2.3 Adopting the squared-root equivalence scale

One of the key ingredients under the LIM methodology is to choose the equivalence scale. In essence, the equivalence scale measures how the consumption of an individual will have to change when her/his family status changes such that her/his level of well-being is maintained. For example, a woman lives alone and consumes a basket of goods and services for given prices and attains a certain level of utility. The problem in identifying the equivalence scale for her is to ask how much she would save if she were to live with somebody else, attaining the same utility level as before. Since a person cannot be living alone and together with somebody at the same time, it is generally impossible to identify the equivalence scale for each individual.

Nevertheless, income/resources pooling and sharing do occur within a family or household and economies of scale in joint consumption exist. For example, if two families, each of size two, were to decide to form a new family of size four, the new family would not need as many cars, stoves and refrigerators as when they were living separately to attain their previous levels of satisfaction. They may also be able to take advantage of bulk pricing and volume discounts. Thus, in practice, the equivalence scale is primarily employed to account for savings accrued in consumption expenditures for people who live together. But the problem is that there is no agreement about the degree and extent of the saving, and hence various equivalence scales have been proposed and employed.

The equivalence scales under LIM were chosen as a rough mid-point of several scales embodied in the various series of LICOs and administrative/legislative scales implied by the municipal budget guides and provincial social assistance levels. As Table 2 shows, they fall in between the Old Organisation for Economic Co-operation and Development (OECD) scales (also known as the Oxford scales) and scales derived by Poulin (1988) from Statistics Canada’s Income Satisfaction Surveys. These equivalence scales have been employed by Statistics Canada to produce the LIM thresholds since 1991, as well as those extended versions to earlier years. LIM’s equivalence scales are also employed by the MBM line.”

CONCLUSION

For those who doubt the validity of equivalence scales, the following link (pdf/CEPE_Echelles_equiv_en.provides evidence that equivalence scales do work provided they are constantly tweaked for validity in recognition there is no perfect system and evaluation is required for changes over time.

(This blog is of a general nature about financial discrimination of individuals/singles.  It is not intended to provide personal or financial advice).

NET WORTH AND ASSETS CONTRIBUTE TO FINANCIAL DISCRIMINATION OF SINGLES-Part 2 of 2

NET WORTH AND ASSETS CONTRIBUTE TO FINANCIAL DISCRIMINATION OF SINGLESPart 2 of 2

(These thoughts are purely the blunt, no nonsense personal opinions of the author about financial fairness and discrimination and are not intended to provide personal or financial advice).

When politicians, government and the wealthy continue to perpetuate myths that net worth and assets are too difficult to calculate or should not or cannot be included in financial formulas, this continues to make it possible for the wealthy to maintain their wealth and impossible for singles and the poor to maintain or increase their financial well-being thus resulting in financial discrimination and poverty for these groups.

The following three examples show how inclusion or exclusion of net worth and assets perpetuates the myths proposed by financial analysts, politicians, government and the wealthy.

EXAMPLE #1

Affordable Housing (services)

One assistance program in Alberta is Community Housing which is a subsidized rental program. It provides housing to families and individuals who have a low or modest income. Program funding comes from the federal, provincial, and municipal governments.To qualify, applicants must be Canadian Citizens, independent landed immigrants, or government sponsored landed immigrants. Assets and belongings cannot exceed $7,000. Assets include, but are not limited to:

  • bank accounts
  • investments (excluding RRSPs)
  • equity in property
  • equity in a motor vehicle (assessed by reviewing the value in the most current Canadian Red Book)

EXAMPLE #2

Legal Aid Alberta (legalaid)

Financial Eligibility Guidelines – If income falls within the amounts listed below, person(s) may be eligible for legal representation and to have a lawyer appointed.  Representational services are not free. Repayment will be discussed if a lawyer is appointed.  Legal Aid’s Financial Eligibility Guidelines allow the following eligible monthly income for family size of 1 – $1,638, 2 – $2,027, 3 – $2,885, 4 – $3,120, 5 – $3,354 and 6+ – $3,587.

An example of this is an actual court case going on at the present time.  Legal Aid has refused to assist client’s claim of defence for an estimated $25,000 in legal fees.  Legal Aid says client still has a large amount of property ($500,000 mortgage free), $34,000 in savings, tax free savings account (TFSA), and GICs and mutual funds worth another $21,000, plus $570 a month in old-age security payments with monthly expenses of $1,660.  Legal Aid does not give coverage to individuals with assets in excess of $120,000.  Legal Aid states: “client would be left with well over a half a million dollars in assets even after payment of legal fees.”

EXAMPLE #3

Family Tax Credits (tax-credits)

June 11, 2016 Financial Post Personal Finance Plan “Farm Plan Risky for Couple with 4 kids” shows how plethora of tax credits works for this family, Ed 32 and Teresa 33, stay at home spouse have four children ages 5, 3, 1 and newborn.  Government employee Ed brings home $2,680 after monthly tax income.  Net worth is already $502,000 including $200,000 paid for house.  Non taxable Liberal Canada Child Benefit for four children will be $1,811 per month bringing income to $4,491 per month.  (From ages 6 to 17, Canada Child Benefit will be $1,478 per month).

LESSONS LEARNED

These three examples show how the inclusion or exclusion of net worth and assets benefit the wealthy and families more than singles and poor families.  In Example #1, to receive housing assistance only $7,000 is allowed in assets.  Really, that is it? Compare that to Example 3 where a family already having significant net worth will receive benefit upon benefit upon benefit in addition to Family Tax Credits.  In Example #2, this could be said to be a good case where financial fairness has prevailed.  This client has plenty of net worth and assets to pay for $25,000 legal defence.  When the Legal Aid income scales are analyzed, it is apparent they have at least used some form of equivalence scales (finances). Hallelujah, here is one example where a family unit of two is not assessed at a value times two of that of family unit of one!

CONCLUSION

This post is just another example of the blatant hypocrisy and upside-down finances that financial analysts, politicians and government, and families perpetuate by not including net worth and assets in all financial formulas across the board whether they are local, provincial or federal or of a service type such as Legal Aid.  The blatant financial discrimination of singles and the poor continues while the wealthy get to write their own ticket to wealth by paying less and increasing wealth.

(This blog is of a general nature about financial discrimination of individuals/singles.  It is not intended to provide personal or financial advice).

NET WORTH AND ASSETS CONTRIBUTE TO FINANCIAL DISCRIMINATION OF SINGLES-Part 1 of 2

NET WORTH AND ASSETS CONTRIBUTE TO FINANCIAL DISCRIMINATION OF SINGLES-Part 1 of 2

(These thoughts are purely the blunt, no nonsense personal opinions of the author and are not intended to provide personal or financial advice).

Past posts on this blog have shown how financial  formulas that do not include net worth and assets in the formulation promote financial discrimination of singles and the poor.

In past posts financial profiles from the Financial Post have been used to show reasons why and how singles are financially discriminated against.  The editor of the Financial Post profiles Andrew Allentuck, published an interesting article on November 9, 2011 “The rich not an easy target for the taxman” (financialpost).

The idea of taxing the rich is back in fashion.  Advocates for hitting wealthy people with extra taxes argue that it would add to national or provincial revenues and counter the maldistribution of wealth in Canada….

Taxing wealth by taxing income is bad economics.  Wealth is a stock while income is a flow, notes Fred O’Riordan, national advisor for tax services with Ernst & Young in Ottawa.  People can be wealthy, but if they are not employed or if they are retired, they may have modest incomes,  In turn, there are people with high incomes who are spendthrifts and do not build up much wealth.  Advocates for taxing the rich have to aim for the right target….

Today, wealth taxes (in Canada) continue to exist at low rates charged as probate fees when estates are wound up.  (These low fees have helped stop flow of monies out of the country as experienced by countries with high probate fees)…..

The problem, Mr. O’Riordan notes, is that wealth is more portable than income and is easily moved by the living. Money can be electronically zipped around the world in seconds.  Moreover, if the wealthy can see special levies coming, they can shift their wealth away from tax assessor’s hands.

Even if a country or a state or a province were to decide to tax wealth, hurdles would be substantial.  Mansions and lavish condos are immovable and therefore easy to tax. Financial assets like stocks and bonds, mutual funds and bank accounts are registered in various places and therefore also are relatively easy to tax.

Wealth taxation gets harder when the target is art hanging on walls, collections of comic books and baseball cards, all of which are subject to tests of authenticity and changing fashions.  When it comes to buried treasure, such as jewels or gold in safe deposit boxes, merely finding assets would be challenging…..

The difficulty of assessing the value of art, furs, jewels and other trappings of wealth would push tax authorities to focus on easy targets.  Houses and condos are a large component of most people’s wealth.  Yet taxes on homes would be regressive, Mr. O’Riordan says.  “Middle-class people would have a higher proportion of their net worth in houses than do the very rich.  Moreover, home equity rises with age as mortgage are paid off.  So a tax on easily measured home prices or values would hit the middle classes and the middle-aged and the elderly harder than they would young families or young people or who have little equity in their houses or condos”, he argues.

Intellectual property like copyrights and patents are even harder to value.  The value of the most powerful form of wealth, human capital, would be a tax appraiser’s nightmare….

Finally, there are questions of how much tax is too much tax.  Income is already taxed via annual returns, then retaxed when spent via sales taxes and the GST or HST, real estate taxes and sin taxes….To tax it again when unspent as wealthy might be widely resisted. Moreover, a tax on savings or, as some might see it, on thrift itself, could drive down national savings.  Businesses needing loans would be driven to borrow abroad.  Rising foreign debt would weaken the dollar.  As Leonard Loboda, a business advisor in Winnipeg explains, “soaking the rich historically defeats investment.”

COMMENTS ON ARTICLE

These comments are in reference to multiple benefits doled out by politicians, government and businesses without regard to net worth and assets.  To do nothing in assessing net worth and assets when handing out benefits is a blatant disregard of and promotes financial discrimination of singles and poor families.  An example of this is past post on family tax credits (program).

“People can be wealthy, but if they are not employed or if they are retired, they may have modest incomes,  In turn, there are people with high incomes who are spendthrifts and do not build up much wealth”.  Really???  Just because wealthy people may not be employed or have modest incomes or are retired does not mean they should receive more benefits than those who are gainfully employed with low incomes and less wealth (example:  family tax credits given in full amount to wealthy families who have low income and many children).  For those with high income who are spendthrifts, isn’t that their problem for being financially irresponsible?   It is also irresponsible for politicians and government to give benefits to this group.  (Family tax credits are only partially doing the right thing by using graduated income levels to reduce benefits for those with higher incomes).

Irresponsible financial behaviours on the part of those holding the wealth–it is irresponsible for those with wealth (applies to all persons regardless of marital status) to seek financial assistance when they have the means to use up some of their net worth and assets.  If persons can’t afford to pay house taxes or afford to  live, but have huge expensive houses, they should sell their homes and move to less expensive dwellings.

Upside down financing–net worth and assets of the wealthy where they often pay less in taxes, but get more in benefits is perpetuated by upside down financing initiated by the wealthy, politicians and government (housing is just one example) (finances).

Financial analysts and think tanks perpetuate financial advice that benefits mostly wealthy and those with more net worth and assets.  True facts about what it costs singles to live is often under-reported.  All the extra benefits given to married or coupled family units are not looked at in one big picture, but rather in isolated statements. Some financial analysts and think tanks do not treat home equity as a retirement asset.  (They believe that replacement rate analysis has as its objective an income that allows one to enjoy a lifestyle comparable to that which existed pre-retirement. They do not include home equity because they accept that the pre-retirement lifestyle for many middle-and moderate-income Canadians include continued homeownership). (financial).  In other words, those who have never been able to afford homeownership deserve to live a lesser lifestyle throughout their lives and into retirement.

When politicians, government and the wealthy continue to perpetuate myths that net worth and assets are too difficult to calculate or should not be included in financial formulas, this continues to make it possible for the wealthy to maintain their wealth and impossible for singles and the poor to maintain or increase their financial well-being thus resulting in financial discrimination for these groups.

(This blog is of a general nature about financial discrimination of individuals/singles.  It is not intended to provide personal or financial advice).

WHAT IS THE POINT OF POLITICS AND POLITICIANS IN FINANCIAL DISCRIMINATION OF SINGLES?

WHAT IS THE POINT OF POLITICS AND POLITICIANS IN FINANCIAL DISCRIMINATION OF SINGLES?

(These thoughts are purely the blunt, no nonsense personal opinions of the author and are not intended to provide personal or financial advice).

One wonders what is the point of politics and politicians when there is such gross financial discrimination (along with violation of human rights) of singles.

One online review describes the purpose of government and politics as follows:

The purpose of politics is to enable the members of a society to collectively achieve important human goals they cannot otherwise achieve individually. Through negotiation, debate, legislation and other political structures, politics procures safety, order and general welfare within the state. The question of the precise ends of politics is one of the greatest, and most inconclusive, in philosophy, as manifested by the divisive, heated debates among political parties.

Government is the regulation of human activity, and politics consists of the processes by which a society decides the nature and extent of that regulation. There are many theories concerning the proper role of politics and what aspects of human life should be politicized.

Politics is often involved in prescribing the rules that govern interhuman relationships. It determines laws regarding marriage, parenting, businesses and contracts. It creates laws regulating educational institutions and civil associations. Money always plays a big role in politics. Much time goes into deciding where public money will come from and how resources will be spent.

The activities of government, politics and politicians, however, can go very wrong especially when certain members of a population are underserved or not served at all.  An example of this is the cultural genocide of indigenous persons and violation of rights of targeted groups such as non-white persons (example:  In USA implementation of voter ID cards that would make it harder for the poor to vote).

This blog has attempted to show financial discrimination of singles.  In a financial world where parents and children rule, singles are an invisible minority.  This blog has also described how singles are financially excluded in a political world where ‘selective’ social democracy rules (singles).  The last decade has been especially financially unkind to singles in which married or coupled persons and parents with children have received the most benefits from the time they are married until the time they are seniors and then widowed (decades).

Politicians and government, both in Canada and the USA, continue to leave singles out of their discussions.  Politicians refer mostly to the middle class and families.  Singles or individuals are not included in the definition of family.  Benefits continue to be targeted more towards families, children, and the middle class, rather than singles and the poor.

Some of the reasons for the financial discrimination of singles are voter entitlements and political parties implementing programs strictly for increasing number of votes.  How decisions for these benefits are arrived at are, indeed, a puzzlement as the premises behind these benefits would never work at a business budget level or a family budget level.

Problems with government budgets and formulas include:

    1. Redistributing monies so that benefits are given to one group (families with children) while another group(singles) is forced to pay for them.
    2. No continuity of benefits from one year to another or from one political party to another.  Benefits may be implemented in one year only to be eliminated in the following year.  Over the years, this may result in one group receiving some benefits, while other groups are never able to receive any of the benefits because of the many changes over the years.
    3. There often appears to be no financial expert consultation on the financial impact or efficacy of the implemented benefits.  An example is the ability of family units with children to receive benefits even though they may be quite wealthy and  not working. The reason for this is that programs have been implemented without taking into account the net worth and assets of the groups receiving the benefits.  As a result of the benefits, these groups may become even wealthier.
    4. Financial formulas are created in isolation (federal separate from provincial).  This creates scenarios where benefits upon benefits upon benefits are doled out allowing some groups to achieve considerable incomes levels that they did not have before receiving the benefits.
    5. There appears to be no financial accountability to ensure financial fairness for all citizens.

If businesses or families and  individuals operated their budgets in this manner where the money cannot be followed, they probably would be considered by financial analysts to be poorly run, face audits from the Canada Revenue Agency and possibly even become bankrupt.

CONCLUSION

So, again the question must be asked:  What is the point of politics and politicians when programs are implemented that defy the financial intelligence of basic math, budgeting and common sense financial principles resulting in financial discrimination of certain groups like singles?

(This blog is of a general nature about financial discrimination of individuals/singles.  It is not intended to provide personal or financial advice).

IMPROPER DEFINITION OF SINGLE STATUS PROMOTES FINANCIAL DISCRIMINATION

IMPROPER DEFINITION OF SINGLE STATUS PROMOTES FINANCIAL DISCRIMINATION

(These thoughts are purely the blunt, no nonsense personal opinions of the author and are not intended to provide personal or financial advice).

Several past posts have shown how families, politicians and governments discriminate against singles in financial formulas.

In discussion of these posts, it is amazing how married or coupled persons and those in power of managing financial formulas manage to twist the definition of the status of singles.  For example, when discussing the post showing how family tax credits are pushing singles into poverty (singles), several rebuttals were made that singles do receive financial benefits.

It has taken several instances of these rebuttals to bring the author of this blog to an ‘ah ha’ moment.  Families, politicians and governments will lump singles in one marital status category, that is ‘single’, instead of stating it is single parents and widowed persons who receive the most benefits.

Readers will note this blog may refer to singles as ‘ever’ (never married, no kids) singles and ‘early in life divorced’ singles.  The reason for doing so is because ever singles and early in life divorced singles are more likely to be at the bottom of the financial totem pole.  (Late in life divorced persons are more likely to have been able to accumulate financial power and wealth because they were able to do so as two people while married or coupled).

So, in order to further clarify in future posts, this author may refer to singles as ever singles, early in life divorced singles or single parents where necessary.  The definition in the heading of this blog has been updated to reflect this change.

For those singles trying to articulate (articulate)how singles are financially discriminated against, they will need to add this level of distinction of ‘single’ status versus ‘single parent’ status to their arsenal of debating skills.  (Heaven help us, when will all of this stupidity end where singles will be recognized as needing to included in financial formulas, even when they are not single parents or widowed persons?)

(This blog is of a general nature about financial discrimination of individuals/singles.  It is not intended to provide personal or financial advice).

HISTORY OF FAMILY TAX CREDITS OVER DECADES ARE FINANCIALLY DISCRIMINATING TO SINGLES-Part 1 of 2

HISTORY OF FAMILY TAX CREDITS OVER DECADES ARE FINANCIALLY DISCRIMINATING TO SINGLES-Part 1 of 2

(These thoughts are purely the blunt, no nonsense personal opinions of the author and are not intended to provide personal or financial advice).

This post was updated on August 3 and 9, 2016.

Child Benefits (also known as Baby Bonus) have been around for a long time.  While this, in as of itself, may or may not have produced substantial financial discrimination for singles, it is all the additional marital manna benefits given to married or coupled with and without children family units over the years that have continually increased the financial discrimination of singles.

Some of most money-enhancing benefits beginning in 1945 to present date are outlined below.

benefits over decades

The Family Allowance (currently called Canada Child Benefit) began in 1945 as Canada’s first universal welfare program.  Benefits were awarded without reference to the family’s income or assets – based on the idea that all Canadian children are worthy of public support.  Since the 1980s, however, such allowances have been increasingly targeted to low-and-middle-income families.  The Child Benefits program has gone through different variations over the years.  The amount is calculated each year based on family income and the number of children in the family under the age of 18.  Supplements are also available for handicapped children.  It is said that the incidence of child poverty in Canada is second highest among Western developed nations – second only to the USA. The Canada Child Benefit program is still based only on income, not assets and net worth.

The Registered Retirement Savings Plan (RRSP) was introduced in 1957 to encourage Canadians to provide for their own retirement.  They are intended to encourage private savings for retirement and thus contribute to the earnings-replacement objective. Money placed in RRSP account,, as well as investment earnings on the money are tax-deferred until withdrawn on retirement or earlier.  As well as RRSP account for individuals, there also can be a spousal RRSP which allows a higher earner, called a spousal contributor, to contributed to an RRSP in their spouse’s name (it is the spouse who is the account holder).  A spousal  RRSP is a means of splitting income in retirement and, therefore, possibly pay less tax.

Maternity and Parental Benefits began in 1971 and are a part of the Employment Insurance program.  Parents must have contributed to EI program.   The basic rate of these EI benefits is 55% of average insurable weekly earnings up to a maximum of yearly amount of $50,800.  EI maternity benefits can be paid for a maximum of 15 weeks and EI parental benefits can be paid for a maximum of 35 weeks.  Some companies offer ‘top-up’ programs with increased benefits in amount of pay and length of payment. (Added August 21, 2016)

Child Rearing Drop-Out Benefit (CDRO) began in 1983.  This benefit allows parent to increase Canada Pension Plan (CPP) benefit if he/she stayed at home to take of children under the age of seven.  The period of time parent stayed at home can be excluded from the calculation of the CPP benefit so that CPP benefit is increased. The CDRO can only be used for months when Family Allowance Payments were received or Canada Child Benefits are eligible and earnings were lower because work was either stopped or there were fewer worked hours. (Added August 21, 2016)

The Registered Education Savings Plan (RESP) began in 1998.   From 1998 (the first year the program started) to 2006 inclusive the annual contribution limit was $4,000 and lifetime contribution limit $42,000 (including any contributions made prior to 1998).  From 2007 to present there is no annual contribution limit and the lifetime contribution limit is $50,000 (including all contributions made prior to 1998).  Based on the amount of the RESP contributions and income level, the government may additionally contribute up to $7,200 per child as well as other grants.

Since 2007, Canadian spouses or common-law partners have been allowed to split the pension income one of the spouse receives between the two spouses.  This strategy allows the spouse who has the highest income to lower his tax payable by sharing up to 50 % of his pension income with his spouse.

The Tax Free Savings Account (TFSA) began in 2009.  The amount of $5,000 new contribution room (from after-tax income) was allowed for each year from 2009 to 2012. For the years 2012 and onwards, the amount is $5,500 per person. The maximum amounts for an individual for years 2009 to 2012 is $20,000 and for a couple in a married or coupled family unit it is $40,000.  From years 2013 to 2016, the maximum amounts for an individual are $22,000 and $44,000 for a married or coupled family unit.  For years 2009 to 2016, the maximum allowable amounts for an individual total $42,000 and for a married or coupled family unit comprised of two adults $84,000 (all tax free).

OAS is a federal social program designed to provide a very modest pension to low- and middle-income retirees.  In 2016 the OAS is $6,680 for single person and $13,760 for a couple. OAS clawback which began in 2011 does very little to clawback the income of wealthy persons.  The clawback of OAS benefits in 2016 starts with a net income per person of $72,809 (couple $145,618)  and completely eliminates OAS with income of $118,055 (couple $236,110).  The repayment calculation is based on the difference between personal income and the threshold amount for the year. The  repayment of OAS is 15 percent of that amount.  All OAS is clawed back if personal income is over $118,055.  According to Human Resource Development Canada, only about five percent of seniors receive reduced OAS pensions, and only two percent lose the entire amount.  This program benefits wealthy couples and widowers the most.  OAS clawback for couple only begins at net income of $145,618 thus allowing them to receive full OAS of $13,760 as a couple.  There are not many ever single seniors and early divorced in life seniors who could hope to achieve a net income of $72,809; however, for wealthy widowers this may be easier to achieve and they are the ones who complain about clawback.

Starting in January 2016, tax changes decreased income taxes (federal) for those making between $45,282 and $90,563 from 22 per cent to 20.5 per cent. It also increased taxes on those making above $200,000 from 29 per cent to 33 per cent.  The majority of ever singles and early divorced persons do not have incomes over $45,282 (statcan).  While middle class families with children get less of the Canada Child Benefits because they are based on income, this is offset with reduced income taxes.  So, who financially loses out yet again?-answer, singles.  (This paragraph was added on August 9, 2016).

Income splitting would have allowed couples with children younger than 18 to transfer up to $50,000 in income from the higher earner to the lower earner for tax purposes, for a benefit that will be capped at $2,000. It was to start with the 2014 tax year, but was eliminated by the Liberal government.

Other possible benefits on the federal level are too numerous to mention.  Married or coupled with children family units may also receive other top up benefits on the provincial level.

From the time a married or coupled with children family unit begins at marriage until death of one of the spouses, it is possible they will receive shower, wedding and baby gifts, maternity/paternity leaves, child benefits, TFSA benefits times two, RRSP benefits times two, reduced taxes, pension-splitting, and possible survivor pension benefits.  There also are probably a great number of years where they never pay full taxes while increasing their wealth.  Singles are not able to achieve these same level of benefits and tax relief.

SOLUTION

To bring some sort of sanity to all the benefits upon benefits upon benefits that married or coupled family units receive, for starters it would be prudent for politicians and government to apply square root equivalence scales (finances) to any and all benefits, past and future.  An example when implementing benefits would be to apply a square root equivalence value of 1.0 for a single person family unit and a value of 1.4 for a married or coupled without children family unit.

CONCLUSION

As shown above benefits have been given to married or coupled persons with children family units for seventy five years and have not been as kind to singles.  The majority of the benefits have been implemented by the Federal Conservative party in the last decade and continue to be perpetuated by the Liberal party.  Ever singles and early divorced singles without children have not received the same level of benefits (single parents with children do receive some benefits, but these still are not at the same level as married or coupled family units, for example, pension splitting and spousal RRSPs).  There is no issue with providing support to poor and low income family units with children. However, singles should take great issue with benefits being given to family units with children without taking into consideration income as well as net worth and assets so that they can increase their wealth from these benefits.  Also, there should be great issue with poor and low income singles not receiving same level of assistance.

As stated in a previous post (decades), how many more decades is it going to take before singles are equally included in financial formulas as married or coupled family units? When is the financial discrimination of singles going to end?  This is not just a Canadian problem, but a worldwide problem.  Singles need to speak out about financial discrimination.

(This blog is of a general nature about financial discrimination of individuals/singles.  It is not intended to provide personal or financial advice).