
TAXES: FLAT VS. PROGRESSIVE AND DEBUNKING “THE TAX SYSTEM EXPLAINED IN BEER”
(These thoughts are purely the blunt, no nonsense personal opinions of the author about financial fairness and discrimination and are not intended to provide personal or financial advice.)
Prelude: Yet again, the tax system explained in beer story is used to ludicrously and simplistically explain the tax system, and no less by the USA White House. We have been wanting to do a blog post on flat and progressive tax systems comparisons, so here it is.
The story about “The tax system explained in beer” (democratic) has been flitting around the internet since 2001. Apparently no author can be identified for the article. The analogy makes the argument that since wealthy people pay the most in taxes, they will also receive the most benefit from a tax cut. It also suggests that wealthy people will leave the US if they are made to pay more in taxes.
It appears that how the reader interprets the article is based on ‘right’ or ‘left’ political thinking, flat versus progressive taxation systems and social democracy or not.
On October 30, 2017 Sarah Huckabee Sanders, USA White House Press Secretary began her daily press briefing pitching USA Trump tax cuts by reciting the article. Then she said, “And that, ladies and gentlemen, is how our tax system works,” Sanders continued. “The people who are being paid the highest taxes will naturally benefit from a tax reduction but not the largest benefit. Taxing them too much and they might start drinking overseas where the atmosphere is somewhat friendlier. This is a silly story but it illustrates a very important point. Our tax cuts and reforms will create a fair system that works better for everyone. It will make our country the friendliest in the world for American families trying to build a better life for their children. And for American companies seeking a competitive edge. I will be happy to get that story to everybody so you can get those numbers later. Again, I know that may be an oversimplification but it paints a very good picture of the tax system.”
From the analogy the information is condensed as follows, ‘the premise is every day ten men go out for beer and the bill for all ten comes to $100. If they paid their bill the way we pay our taxes, it goes something like this…’ (first four people are the poorest). Based on their incomes, the ten men would pay:
- The first four men (poorest) would pay $ 0
- The fifth would pay $ 1
- The sixth would pay $ 3
- The seventh would pay $ 7
- The eighth would pay $12
- The ninth would pay $18
- The tenth man (richest) would pay $59 (for a total of $100)
Everyone is happy with this arrangement, until the owner throws them a curveball. Because they are such good customers, he reduces the bill to $80. It is decided it would be fair to reduce each man’s bill by a higher percentage the poorer he was, to follow the principle of the tax system they had been using, so each man would now be paying:
(Blog author comment: Truly funny, the totals add up to $79, not $80, so it appears the bar tender will be short changed by $1.)
- First four persons $ 0
- Fifth person $ 0 (100% saving on prior payment)
- Sixth person $ 2 ( 33% saving)
- Seventh person $ 5 (28% saving)
- Eighth person $ 9 (25% saving)
- Ninth person $14 (22% saving)
- Tenth person $49 (16% saving) for a total of $79
However, the men begin to compare their savings with those who get the least in percentage of savings complaining the most.
The wealthy get all the breaks. Wait a minute, yelled the first four men, we didn’t get anything at all. This new tax system exploits the poor. The nine men yelled at the tenth and made him feel bad so the next time the tenth man didn’t show up for drinks and the nine sat down and had their beers without him. When it came time to pay the bill, they discovered something important. They no longer had enough money between them all to even cover half of the bill.
For those who understand, no explanation is needed. For those who do not understand, no explanation is possible.’ (End of analogy).
Reader comment: ‘Yes, the perilous story of the wealthy person who will leave it all behind if the taxes go a percentage point too high…all his businesses, his customers and his suppliers, all his family, his home, his social networks, his local culture, his kids schools, why he’ll just pick up all of that and magically whisk it away to some other place with a lower tax burden for free. The only thing the story is missing to start with is “Once upon a time…” like all fairy tales’.
ANOTHER EXPLANATION OF THE ABOVE ANALOGY
Taken from the following article: “SA Tax System Explained Through Beer” (based on South African Rand) tax-system-explained-through-beer
‘Economies are not one-liners. We’re talking about systems here – and you can’t talk about taxation and spending without talking about “where did the money come from”.
So let me attempt to re-tell that parable.
Ten Men Walk Into A Bar…And One Of Them Owns The Brewery. Suppose that every day, ten men go out for beer and the bill for all ten comes to R100. If they paid their bill the way we pay our taxes, it would go something like this:
- The first four men (poorest) would R 0
- The fifth would pay R 1
- The sixth would pay R 3
- The seventh would pay R 7
- The eighth would pay R12
- The ninth would pay R18
- The tenth man (richest) would pay R59 (for a total of R100)
So, that’s what they decided to do.
There are many reasons why the richest man agreed to pay the bulk of the bill, but the important one is that he owned the only brewery in town, and the barman would buy all the beer from him.
The seventh, eighth and ninth men all worked in the brewery, and earned salaries according to their skill level. The sixth and fifth men owned farms which supplied the hops – although they didn’t earn particularly well, because the brewery was the sole buyer and it negotiated quite stiff rates.
The remaining four men were farm labourers who earned enough to eat, but not enough to drink.
The way that the brewery man saw it: the drinks must flow in order for the barman to be in business and sell the beer that the brewery produced.
The ten men were also very protective of their beer industry, and would run any newcomers out of town. This meant that the ten men were the only real regulars at the bar, and the only real source of its income.
So to keep the bar in business and the town happy and the drinks flowing, the richer men would pick up most of the tab. And happily, most of the bill would end up back in the brewery man’s hands anyway.
So the ten men drank in the bar every day and seemed quite happy with the arrangement, until one day, the barman threw them a curveball. “Since you are all such good customers,” he said, “I’m going to reduce the cost of your daily beer by R20”. Drinks for the ten men would now cost just R80.
What he didn’t say is that there had been a bumper season of barley, so the brewery had produced its beer fairly cheaply that month – and the brewery owner had offered the barman a substantial discount on the beer in order to get rid of it.
The group still wanted to pay their bill the way we pay our taxes. So the first four men were unaffected. They would still drink for free. But what about the other six men? How could they divide the R20 windfall so that everyone would get his fair share?
They realized that R20 divided by six is R3.33. But if they subtracted that from everybody’s share, then the fifth man and the sixth man would each end up being paid to drink his beer.
So, the bar owner suggested that it would be fair to reduce each man’s bill by a higher percentage the poorer he was, to follow the principle of the tax system they had been using, and he proceeded to work out the amounts he suggested that each should now pay.
And so
- The fifth man, like first four, now paid R 0 (100% saving)
- The sixth instead of R3 now paid R 2 (33% saving)
- The seventh instead of R7 now paid R 5 (28% saving)
- The eighth instead of R12 now paid R 9 (25% saving)
- The ninth instead of R18 now paid R14 (22% saving)
- The tenth instead of R59 now paid R49 (16% saving) for total of R79
Each of the six was better off than before. And the first four continued to drink for free. But, once outside the bar, the men began to compare their savings.
“I only got a dollar out of the R20 saving,” declared the sixth man. He pointed to the tenth man,”but he got R10!”
“Yeah, that’s right,” exclaimed the fifth man. “I only saved a rand too. It’s unfair that he got ten times more benefit than me!”
“That’s true!” shouted the seventh man. “Why should he get R10 back, when I got only R2? The wealthy get all the breaks!”
“Wait a minute,” yelled the first four men in unison, “we didn’t get anything at all. This new tax system exploits the poor!”
In their rage, the nine men decided to boycott the bar.
The next night only the tenth man showed up for drinks so he sat down and had the beer on his own. But when it came time to pay the bill, he discovered something important. 90% of the beer had gone unsold, and the barman was threatening to return the stock to him in the morning.
And if the situation remained unchanged, then the barman was planning to shut up shop, and the brewery would have to close, and then everyone would be without jobs.
And that is how our economy works. The people who already pay the highest taxes will naturally get the most benefit from a tax reduction, but the wealthy also have a vested interest in keeping consumers at the table.
That consumption drives the economy and gives value to the businesses that they own. And the hard truth is: if anyone decides to leave the table, then it’s likely that everyone will lose. And it’s really hard to keep everyone happy.
It’s complicated.’ (End)
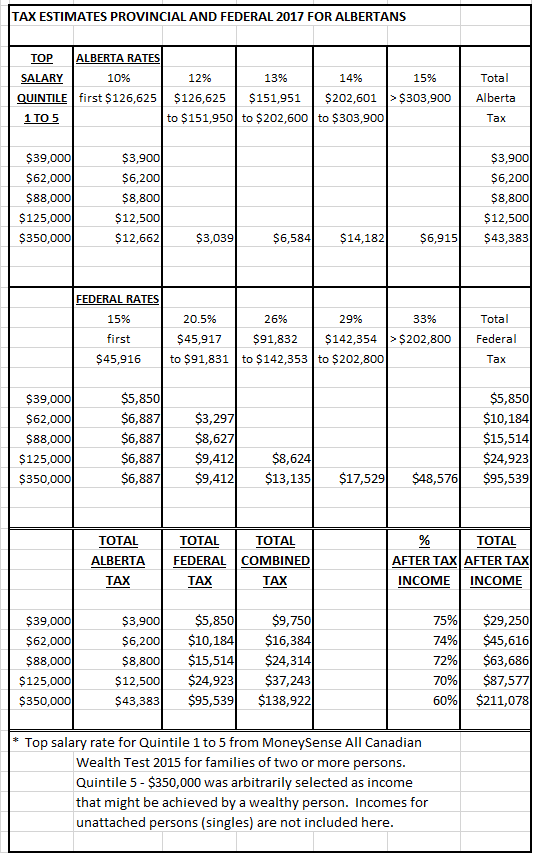
EXAMPLE OF PROGRESSIVE FEDERAL AND PROVINCIAL 2017 FOR ALBERTANS
For this blog author, the initial article is based on true stupidity and over simplification of the tax system. In this blog article, an example is used to explain the Canadian and provincial tax system based on a progressive tax system versus a flat tax system. These calculations are examples only. Also, final taxes will vary based on personal deductions, other deductions, tax credits and loopholes not included here.
The following information outlines the 2017 progressive tax system for Canadian and Alberta families of two or more using 2011 Stats Canada information on incomes for Quintile 1 to 5. For the tax calculation, the highest income for Quintile 1 to 4 rounded off was used plus an arbitrarily assigned income of $350,000 for Quintile 5.
CANADIAN DISTRIBUTION OF INCOME (from MoneySense 2015 All Canadian Wealth test (moneysense.ca/save/financial-planning/the-all-canadian-wealth-test-2015/)
- Quintile 1 up to $38,754
- Quintile 2 $38,755 to $61,928
- Quintile 3 $61,929 to $88,074
- Quintile 4 $88,075 to $125,000
- Quintile 5 $125,001 and over
Upper income point of quintiles
- Quintile 1 $ 39,000
- Quintile 2 $ 62,000
- Quintile 3 $ 88,000
- Quintile 4 $125,000
- Quintile 5 $350,000 (arbitrarily assigned value)
ANALYSIS
First, it must be stated that all persons identified in the quintiles will not pay the full tax shown in the table since personal deductions, other deductions and tax credits have not been applied. Also, the ability to use tax loopholes and credits, (more likely to benefit wealthy the most) have not been applied. Examples are TFSAs (no tax savings on principal amounts, but savings are realized on tax free investments and interest earned on principal) and RRSPs (reduced taxes on employment income for yearly RRSP amounts, but will pay taxes on withdrawals from RRSP, for example, in retirement when income is likely to be less than when employed). Combined principal amounts for TFSAs for couples now totals almost $100,000 (tfsa-boondoggle-for-singles-and-low-income-canadians). It is almost 100% certain that couple earning $39,000 will not be able to contribute to TFSAs and RRSPs.
Also, calculations are based on the combined total income for one or two earners in family of two or more. Taxation will vary based on income earned by each spouse and tax rules for family income.
It is interesting to note percentage of after tax income without application of any other deductions for Quintile 1 to 4 families of two or more persons averages between 70% and 75%, while percentage of after tax income for the richest Quintile 5 $350,000 arbitrarily assigned income for family of two or more is about 60%. The 60% after tax income, however, will increase substantially with the deductions, and tax avoidance, loopholes and credits that wealthy are able to use.
After tax income with no deductions for family of two or more earning $350,000 will be at least $211,078 or $17,590 per month (as compared to only approximately $2,400 per month for Quintile 1 family of two or more persons). Families earning $39,000 with equal incomes between the spouses at 2,000 annual worked hours each works out to about $10/hr.
If 2015 old flat tax rate of 10% for Alberta is applied to Quintile 5 person earning $350,000 the total tax would only be $35,000 instead of $43,383. What a difference a progressive tax makes! The average person does not understand that the first dollar earned is taxed lower than the last dollar earned in the progressive tax system. The person earning $350,000 pays the exact same tax on the first $125,000 of pay as the person making only $125,000. That is what makes progressive taxes fair.
From MoneySense article the top income for unattached individuals for Quintile 1 is $18,717 (as compared to $38,754 for family two or more persons), Quintile 2 $23,356 ($61,928 for family two or more persons), Quintile 3 $36,859 ($88,074 for family two or more persons), Quintile 4 $55,498 ($125,000 for family two or more persons), and Quintile 5 $55,499 and over (over $125,000 for family two or more persons). Analysis shows incomes of families of two or more are at least double or more to that of unattached individuals. It is almost 100% certain that unattached individuals in Quintiles 1, 2 and 3 will not be able to save by contributing to TFSAs and RRSPs (unless RRSP is a forced contribution through employer).
Income does not include assets that the upper class and wealthy might have such as paid for $600,000 and up housing, investments, etc.
CONCLUSION
Michael Lewis, author of “The Undoing Project” book, describes how a Nobel Prize-winning theory of the mind altered our perception of reality. Two Israeli psychologists, Daniel Kahneman and Amos Tversky’s work created the field of behavioral economics which revolutionized thinking of how the human mind works when forced to make judgements in uncertain situations. An example is outcomes of surgery where there might be a 5% chance of death versus 95% chance of surviving the surgery. When patients are presented with 95% chance of survival rate rather than 5% death rate, they are more likely to go through with the surgery. The same judgement should apply to tax system based on beer analogy.
For upper class and wealthy, please don’t ‘cry me a river’. Wealthy need to look at what they have left after taxation instead of what is being taken from them in taxation. Only when all the tax loopholes, offshore tax havens, and privileging through tax credits like Tax Free Savings Accounts TFSAs that benefit wealthy the most are eliminated so that there is a level playing field and fairness between poor and wealthy, only then can the wealthy ever complain that they are being taxed unfairly.
The wealth gap between the rich and poor needs to be lessened by increasing the minimum wage to an indexed living wage and eliminating the tax deductions, loopholes and tax credits that benefit the wealthy the most (selective-democratic-socialism).
Regarding the ‘The Tax System Explained in Beer’ analogy, we will take the South African Rand analogy as being the more accurate of the two analogies, thank you very much!
Postscript: For those who wish to read more on the debunking of tax system explained in beer analogy, the following online article and reader comments is a great one – (Reality) Check, Please: Why the Restaurant Analogy Doesn’t Work (Restaurant-Analogy-Doesnt-Work).
UPDATE OCTOBER 31, 2018 – We are very grateful to a reader who pointed out that an error was made in the calculation of information in the table. The table has been updated. The update decreases the tax that is paid in the $350,000 Alberta income category.
(This blog is of a general nature about financial discrimination of individuals/singles. It is not intended to provide personal or financial advice.)
Pingback: BIG LITTLE LIES OF SIMPLE TAX (FLAT) RATE | Financial Fairness For Singles
You made an error in your calculation, $350,000 on the Alberta progressive system would pay $43,383 not $65,720. You included the whole income in the first bracket rather than the first $126,625.
This would put their total tax paid at $138,922 and their income after tax at $211,078
Brad, thanks so much for pointing out the error. We are very grateful. The information was updated today.
Financial fairness for singles
Pingback: TEENAGE ENTRY LEVEL WAGE BELOW MINIMUM WAGE EQUALS BLATANT DISCRIMINATION AND SOCIAL JUSTICE FAILURE | Financial Fairness For Singles