
HISTORY OF FAMILY TAX CREDITS OVER DECADES ARE FINANCIALLY DISCRIMINATING TO SINGLES – Part 2 of 2
(These thoughts are purely the blunt, no nonsense personal opinions of the author about financial fairness and discrimination and are not intended to provide personal or financial advice).
The August 2, 2016 post (decades) outlined almost all of the family tax credits that have been brought into play over the decades. Many are financially discriminating because they leave ever singles and early divorced singles out of the equations. Single parents do receive some of these benefits for their children, but are not included in all the benefits afforded to having a spouse or partner.
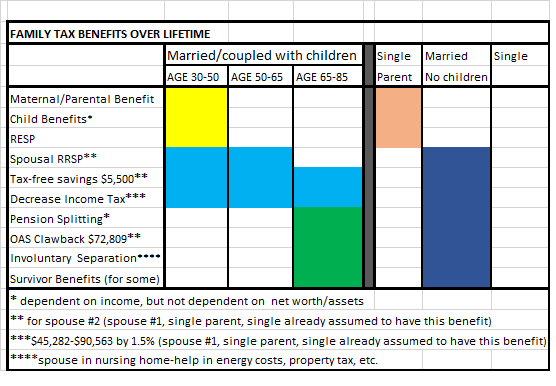
The above table (updated Aug. 29/16) shows benefits available to a married or coupled family units with children from time they are able to use maternal and parental benefits to time of death of one spouse (yellow, blue and green fill in). Single parents only have benefits related to their children (orange fill in). Married or coupled family units without children have all the benefits related to having a spouse or partner (navy fill in). Ever singles and early divorced singles, have none of the benefits available to married or coupled family units (fill in is blank because they have none of the benefits of spouse #2. In addition, they are often are unable to max out RRSP and TFSA contributions). (While late in life divorced singles have none of the benefits for spouse #2, they may have been able to accumulate more net worth and assets while they had a spouse or partner).
Age categories of age 30 to 50 years are used to show suggested family unit of two children, one newborn and second child born two years later. Life expectancy for Canadians is 80 for men and 84 for women so ages in table were calculated to age 85 assuming both spouses were still alive at age 85.
Estimation of the ADVANTAGES OF BENEFITS include the following:
Maternity and Parental Benefits
It is difficult to determine total number of Canadians who have receive EI benefits in a year as statistics seem to be based on month to month data. However, there are studies that state annually about 25% of EI claimants receive maternity and parental benefits. (Some parents may not receive these benefits if they did not contribute to EI or were not employed long enough receive any benefits).
StatsCan’s latest data on Employment Insurance recipients indicates Canada’s federal government (huffingtonpost) is growing stingier with EI benefits since Canada’s EI regime has been significantly toughened under Harper’s Conservative government. Changes that came into place include tougher, more complex rules for keeping EI benefits, and a new requirement that EI beneficiaries who have used EI frequently have to take any job available to them and accept as much as a 30-per-cent pay cut.
There is no such restrictions for maternal and parental benefits. Although the benefits have a defined time limit (usually up to a year), there is no exhaustion of time limits for benefits for maternity and parental benefits as there is for regular unemployed persons (also can have benefits for multiple pregnancies). While it is acknowledged that mothers go through stress of caring for a new infant, it should also be acknowledged that unemployed persons receiving EI go through stress of applying for EI and then constantly have to be looking for a job while EI benefits are running out and they have no money to pay for expenses. Employees in EI offices are often not the most pleasant people to deal with.
Question: do beneficiaries of EI (i.e. two or more children) use more benefits than other beneficiaries during working life of 35 years? Present maximum EI contributions equal about $1,000 per year. Over a 35 year period of working, contributions by a married or coupled family if both spouses are working is approximately $70,000 (this only holds true if each spouse is employed for 35 years each, many wealthier couples retire at age 60, not 65). If a married or coupled family unit have two children with a maximum allowed $50,800 EI yearly insurable earnings at 55%, they will basically have used a large portion of the monies they contributed to the plan (with three children they will definitely likely have used all monies contributed).
Study ‘Benefitting from Extended Parental Leave’, March 2003, Katherine Marshall (statcan): “Significantly more mothers who returned within eight months reported annual earnings below $20,000 in their previous or current job (49%) compared with those who returned after almost a year (29%) … this suggests that women with lower earnings (and possibly lower savings) may not be financially able to stay at home for an entire year on 55% of their earnings….Also, more likely to be a household where total income was under $40,000 (46%) compared with those who returned between nine and twelve months (38%)”. Many families and family organizations are lobbying for the lengthening of maternal and parental leaves to two years. It has to be stated once again that upside down financing ensures that more wealthy parents get to use full EI benefits than poor parents. Dollar value assigned for maximum maternity and parental EI benefits for two children equals approximately $55,880 ($50,800 X 55% X two children).
Canada Child Benefits – the outrageous discrimination of this program where net worth and assets has not been taken into consideration has already been discussed (poverty). Maximum annual Canada Child Benefits for 2016 are set at $6,400 per child ages one and up to six years and $5,500 for children ages 6 to 17. Dollar value calculation using ‘middle of the road’ value (maximum values divided by 2) of $6,400 and $5.400 annually ($3,200 times five years times two children ages 1 and up to six equals approximately $32,000, $2,700 times 12 years times 2 children ages 6 to 17 equals approximately $64,800) equals a total of approximately $96,800.
Registered Education Savings Plan (RESP) – based on the amount of the RESP contributions and income level, the government may additionally contribute up to $7,200 per child as well as other grants. Dollar value for two children may total at least $14,400 of government benefits not counting other grants such as provincial grants.
Spousal Registered Retirement Savings Plan (RRSP) – allows a higher earner, called a spousal contributor, to contribute to an RRSP in their spouse’s name (it is the spouse who is the account holder). A spousal RRSP is a means of splitting income while working and during retirement and, therefore, possibly pay less tax. (It is not possible to calculate how much income tax might be saved).
Tax Free Savings Account (TFSA) – implemented in year 2009 with maximum contribution allowed per person of $5,500. For years 2009 to 2016, the approximate maximum allowable amounts for spouse #2 is a total $42,000 (all tax free and not including monies generated from investments). The Canadian Parliamentary Budget Office states “the TFSA program is regressive, overall, it offers no additional benefit to low- or middle-wealth households” (global) . TFSAs for the wealthy are used as tax shelters. It has been suggested that one half of Canadians have a TFSA account, but only half of those with the account have contributed to the account on a regular basis. It is a well known fact that mostly wealthy Canadians have been able to contribute the maximum amounts to their accounts even in their senior years (another upside financial scheme to allow wealthier Canadians to gain even more wealth). Many singles and poor families do not have the financial ability to max out their TFSA contributions. Dollar value used for spouse #2-lifespan from age 30 to 85 years equals $5,500 time 55 years for a total of $302,500.
Income tax (federal) decreased by 1.5% for those earning between $45,282 and $90,563 – each spouse receives benefit of reduced income tax. Using 2015 Canada Income Tax form, the calculated income tax for approximate income between $45,282 and $90,563 is $16,539. A 1.5% tax reduction equals $248 annually. The majority of ever singles and early divorced persons do not have incomes over $45,282, especially seniors. While middle class families with children get less of the Canada Child Benefit, this is offset by the reduced income tax. This is one benefit piled on top of another benefit. Dollar value used for spouse #2 (assuming 55 working years) is $248 time 55 working years for a total of $13,640.
Pension Splitting – allows splitting of the pension income between spouses to reduce tax paid. This strategy allows the spouse who has the highest income to lower his/her tax payable by sharing up to 50% of his/her pension income with his/her spouse. Apparently 2.2 million Canadian seniors benefit from pension income splitting. This may also allow the higher earner to receive the full OAS benefit without clawbacks. Review of online data (Splitting) shows: “of the $1.2 billion federal cost for pension splitting in 2015, $250 million of that cost is due to increases in OAS payments that wouldn’t have otherwise occurred. Hole. Wealthiest 10% of families get 31% of this benefit while bottom 50% of families get 2% of the benefits. Single-parent families and Canadians living alone would gain no benefit from the creation of this tax loophole. The gains from the pension income splitting loophole go disproportionately to the richest four deciles—the richest 40% of the Canadian senior population. In fact, the richer the senior family, the more it receives from this loophole. The poorer the senior family, the less support it receives. The poorest 10% of seniors receive an average of 10 cents in terms of a tax break from this loophole, whereas the richest 10% receive an average of $820 in perks. The richest 10% of senior families receive more benefit from this loophole than the bottom 70%. Looking at it from another vantage point, one out of five of the richest 10% of Canada’s senior families receive a cheque for over $1,000 from this program while three out of five make some gain from it. Of the poorest half of all senior families, only one out of every 1,000 seniors gets more than $1,000 from pension income splitting. Seven out of 10 seniors enjoy no benefit at all from this tax loophole. The poorest half of all senior families—they’re making less than $36,000 a year—receive only $2 out of ever $100 paid out by this loophole. In contrast, the richest 10% of senior families making over $85,000 receive $30 out of every $100 paid out. Most of the seniors in the bottom 40% of the income distribution are single women. As such, there is no one to split with and therefore no benefit from this loophole. The cost of this tax loophole is large and gets larger every year. While most of this program’s payouts are going to Canada’s richest seniors who don’t need extra support, there remain seniors who live below the poverty line. In fact, to lift all Canadian seniors above the After-Tax Low Income Measure (AT-LIM) poverty line in Canada, it would cost approximately $1.5 billion a year—slightly less than Canadian governments are currently spending to support Canada’s richest seniors. As with many government decisions, budgets are all about policy choices: in the case of pension income splitting, the political choice is to support rich senior families instead of lifting all seniors out of poverty – even though they both cost approximately the same. While income splitting is often touted as a loophole for middle class Canadians, this study illustrates how in reality, it is actually a loophole for Canada’s richest families…..The richer the family, the more it stands to gain; the poorer the family, the more it stands to lose. Under any income splitting scenario, the bottom six deciles of Canadian families wouldn’t even get an equal share of the benefits”. Dollar Value: If the richest 10% receive an average of $820 in these perks annually, then $800 at 20 years from age 65 to 85 equals $16,000 in income tax savings not including the benefits received from OAS not being clawbacked.
OAS Clawback – the clawback of OAS benefits in 2016 starts with a net income per person $72,809 (couple $145,618) and completely eliminates OAS with income of $118,055 (couple $236,110). According to Human Resource Development Canada, only about five percent of seniors receive reduced OAS pensions, and only two percent lose the entire amount. This program benefits wealthy couples and widowers the most. Essentially, there is virtually no clawback for the wealthy so no dollar value is calculated. No dollar value attached, but it is apparent that upside down financing prevails and wealthy families lose nothing-they get to retain their wealth. The OAS Clawback benefit is basically a useless benefit.
Involuntary Separation Benefit – in Involuntary Separation (spouse in nursing home), certain benefits may help pay for energy costs, and provides relief for sales and property tax and may also allow a portion of the Long-Term Care Home accommodation cost to remain with the spouse in the community. Qualifying under “Involuntary Separation” would allow both spouses to receive their pensions as single individuals (usually applies to low income seniors). Not possible to calculate dollar value.
Survivor Benefits – benefits can apply to pensions including public pensions. Details will not be discussed here and no dollar value has been assigned.
LOST DOLLAR VALUE TO SINGLES or looking at it in another way – Estimated Positive Dollar Value for married or coupled family units with two children
- Maternal and Parental Benefits $55,880
- Canada Child Benefits $96,800
- RESP $14,400
- Spousal RRSP (not possible to estimate dollar value)
- TFSA $302,500
- Income tax Reduction $13,640
- Pension splitting $16,000
- OAS Clawback (useless benefit as only richest 5% of Canadians get clawbacked-most married or coupled Canadians get to keep their OAS even with wealth)
- Total $490,220
Estimated Positive Dollar Value for married or coupled family units without children
- Spousal RRSP (not possible to estimate dollar value)
- TFSA $302,500
- Income tax Reduction $13,640
- Pension splitting $16,000
- Total $332,140
Estimated Positive Dollar Value for Single Parent with two children (added Aug. 24/16)
- Maternal and Parental Benefits $55,880
- Canada Child Benefits $96,800
- RESP $14,400
- Total $167,080
Estimated Positive Dollar Value for Ever Single and Early Divorced Singles – Total $0 due to fact of no children and no spouse or partner (added Aug. 24/16)
CONCLUSION
New Canada Child Benefits if they continue in perpetuity for next twenty years implies that many middle class and wealthy married and coupled family units with children will receive benefits that equal the costs of raising children (estimated $250,000 per child) while growing their wealth. Benefits on top of benefits and overlapping of benefits are most advantageous for married or coupled persons with children and without children. Some benefits carry through all the way from age 30 to age 85.
While it is recognized that this exercise has only a gestimate of dollar values, there can be no doubt that many of the benefits (most initiated by the Conservative and perpetuated by the Liberal Party) continue to increase wealth for middle class and higher income married and coupled family units with and without children. Singles parents only receive the child benefits. Singles, single parents and poor families can never financially achieve same kind of wealth as married or coupled family units because they have been left out of financial formulas due to financial discrimination. The political will is to support rich families instead of lifting singles and poor families out of poverty.
(This blog is of a general nature about financial discrimination of individuals/singles. It is not intended to provide personal or financial advice).
Pingback: CAUSE AND EFFECT OF FINANCIAL POLICIES PROMOTING FINANCIAL DISCRIMINATION OF SINGLES AND THE POOR | Financial Fairness For Singles
Pingback: POLITICAL STATEMENTS AGAINST THE NDP PARTY ARE BLATANTLY FALSE AND FINANCIALLY DISCRIMINATORY | Financial Fairness For Singles
Pingback: AFFORDABLE HOUSING FOR VULNERABLE POPULATIONS, SINGLES AND THE POOR | Financial Fairness For Singles
Pingback: INCOME SPRINKLING PROMOTES FINANCIAL DISCRIMINATION OF SINGLE MARITAL STATUS ENTREPRENEURS | Financial Fairness For Singles
Pingback: FINANCIAL DISCRIMINATION OF SINGLES AND LONE PARENT POVERTY MASKED BY GASLIGHTING | Financial Fairness For Singles