
EQUIVALENCE SCALES IN RELATION TO COST OF LIVING
(These thoughts are purely the blunt, no nonsense personal opinions of the author about financial fairness and discrimination and are not intended to provide personal or financial advice).
It should be noted that there is no perfect system; however, the equivalence scales system is one method that provides a decent measure of eliminating financial discrimination and promotion of financial fairness with respect to cost of living assessments for all members of family units regardless of marital status.
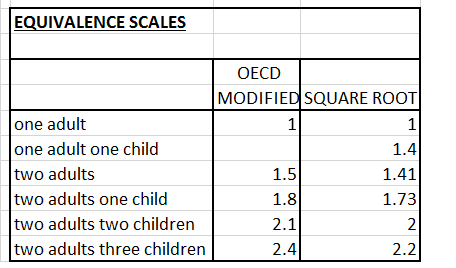
Equivalence scales have been used to provide comparisons of costs of living between different family units (households). The OECD (Organization for Economic Cooperation and Development) modified equivalence scale and square root equivalence scales are two examples. The basis for equivalence scales are described as follows: The needs of a household grow with each additional member but – due to economies of scale in consumption– not in a proportional way. Needs for housing space, electricity, etc. will not be three times as high for a household with three members than for a single person. With the help of equivalence scales each household type in the population is assigned a value in proportion to its needs. The factors commonly taken into account to assign these values are the size of the household and the age of its members (whether they are adults or children).
Table for two equivalence scales (updated March 29, 2017 – full StatsCan table available online):
Statistics Canada 75F0002M – Section 2 ‘The LIM and proposed Modifications’ (75f0002m) provides an excellent overview of what is happening in Canada. This paper proposes modifications to the existing LIM (Low Income Measure) methodology. “The first is to replace economic family by household as the basic accounting unit in which individuals pool income and enjoy economies of scale in consumption. Secondly and equally if not more important, household is the international standard in comparative statistical surveys of income and well-being while the economic family concept is rarely employed by other countries. Under the proposed modification, an individual will be defined as in low-income if the household as a whole is in low-income which in turn will generate different low-income statistics. Adopting the square root equivalence scale – the square root has declining factors for each subsequent member while the LIM scale does not, and thus flattens out after the third member.. Furthermore, under the Square Root scale one needs only consider how many people are in the family whereas using the LIM scale one needs to keep in mind both the age of family members as well as whether the family is a single parent family”.
Added- December 1, 2017
The following explanation for equivalence scales as applied to LIM (Low Income Measure) has been taken from statcan.gc.ca/nhs-enm/2011
“The equivalence scales are employed to account for the economies of scales in consumption for different family compositions and sizes. A family of two persons needs more income than a single-person family, but not twice as much to maintain the same standard of living. Consequently, if the single-person family needs one unit of income, the two-person family needs more than one but less than two units of income. The equivalence scale system under LIM assigns a one to a single-person family, 1.4 to a two-person family (two adults or one adult and one child under 16 years of age), 1.7 to a three-person family consisting of two adults and one child, etc…….
Table 1 contains the after-tax LIM thresholds for the year 2006. Using data from the Survey of Labour and Income Dynamics (SLID), the estimated median of adjusted after-tax family income is $30,358. Thus the standard LIM threshold is $30,358 ÷ 2 = $15,179. The LIM threshold for a single-person family is simply equal to the standard threshold since its equivalent size is unit. For a family of size 2, since its equivalence scale is 1.4, its LIM threshold would be $15,179 x 1.4 = $21,251…….
2.3 Adopting the squared-root equivalence scale
One of the key ingredients under the LIM methodology is to choose the equivalence scale. In essence, the equivalence scale measures how the consumption of an individual will have to change when her/his family status changes such that her/his level of well-being is maintained. For example, a woman lives alone and consumes a basket of goods and services for given prices and attains a certain level of utility. The problem in identifying the equivalence scale for her is to ask how much she would save if she were to live with somebody else, attaining the same utility level as before. Since a person cannot be living alone and together with somebody at the same time, it is generally impossible to identify the equivalence scale for each individual.
Nevertheless, income/resources pooling and sharing do occur within a family or household and economies of scale in joint consumption exist. For example, if two families, each of size two, were to decide to form a new family of size four, the new family would not need as many cars, stoves and refrigerators as when they were living separately to attain their previous levels of satisfaction. They may also be able to take advantage of bulk pricing and volume discounts. Thus, in practice, the equivalence scale is primarily employed to account for savings accrued in consumption expenditures for people who live together. But the problem is that there is no agreement about the degree and extent of the saving, and hence various equivalence scales have been proposed and employed.
The equivalence scales under LIM were chosen as a rough mid-point of several scales embodied in the various series of LICOs and administrative/legislative scales implied by the municipal budget guides and provincial social assistance levels. As Table 2 shows, they fall in between the Old Organisation for Economic Co-operation and Development (OECD) scales (also known as the Oxford scales) and scales derived by Poulin (1988) from Statistics Canada’s Income Satisfaction Surveys. These equivalence scales have been employed by Statistics Canada to produce the LIM thresholds since 1991, as well as those extended versions to earlier years. LIM’s equivalence scales are also employed by the MBM line.”
CONCLUSION
For those who doubt the validity of equivalence scales, the following link (pdf/CEPE_Echelles_equiv_en.) provides evidence that equivalence scales do work provided they are constantly tweaked for validity in recognition there is no perfect system and evaluation is required for changes over time.
(This blog is of a general nature about financial discrimination of individuals/singles. It is not intended to provide personal or financial advice).
Pingback: OAS CLAWBACK OUTRAGEOUSLY BENEFICIAL TO UPPER MIDDLE-CLASS MARRIED OR COUPLED SENIORS, BUT FINANCIALLY DISCRIMINATORY TO SINGLES AND POOR | Financial Fairness For Singles
Pingback: SIX REASONS WHY MARRIED/COUPLED PEOPLE ABLE TO ACHIEVE MORE FINANCIAL POWER (WEALTH) THAN SINGLES | Financial Fairness For Singles
Pingback: AFFORDABLE HOUSING FOR VULNERABLE POPULATIONS, SINGLES AND THE POOR | Financial Fairness For Singles
Pingback: CARBON TAX REBATES DONE RIGHT WAY BY NDP FOR FINANCIAL FAIRNESS OF SINGLES | Financial Fairness For Singles
Pingback: GOVERNMENT CPP BAFFLEGAB MORE IMPORTANT THAN FINANCIAL DISCRIMINATION OF SINGLES AND QUALITY OF LIFE | Financial Fairness For Singles
Pingback: SENIOR SINGLES PAY MORE – Part 4 of 4 | Financial Fairness For Singles
Pingback: RETIREMENT INCOME SECURITY FINANCIALLY DISCRIMINATORY FOR EVER SINGLES AND EARLY DIVORCED/SEPARATED PERSONS | Financial Fairness For Singles
Pingback: HOUSING BIGGEST LIFETIME EXPENSE, NOT CHILDREN. IS HOUSING ALLOWANCE THE ANSWER? | Financial Fairness For Singles
Pingback: ‘GASLIGHTING’ (FINANCIAL) OF SINGLES, THE POOR, MILLENNIALS AND OTHER DISADVANTAGED PERSONS | Financial Fairness For Singles
Pingback: FINANCIAL DISCRIMINATION OF SINGLES AND LONE PARENT POVERTY MASKED BY GASLIGHTING | Financial Fairness For Singles
Pingback: REGRESSIVE TAX EXPENDITURE MISCONCEPTIONS INCLUDING GOVERNMENT DIVIDEND CHEQUES | Financial Fairness For Singles