POLITICAL PARTIES HAVE ‘CHICKENSHIT CLUB’ MEMBERSHIPS BECAUSE THEY TAKE THE EASY WAY OUT ON SOCIAL INJUSTICE AND INEQUALITY
(These thoughts are purely the blunt, no nonsense personal opinions of the author about financial fairness and discrimination and are not intended to provide personal or financial advice.)
(Blog author’s comment: The topic of financial discrimination of singles and low income families has been addressed from many different angles in this blog. This particular blog post shows how compounding of benefits on benefits such as Registered Retirement Savings Account (RRSP) combined with a tax free Canada Child Benefit (CCB) allows wealthy families with children who can afford to max out RRSPs to benefit the most from reduced taxes, increased income, and increased wealth. It also shows how governments and politicians fail to right the biggest social injustices and financial inequalities by going after the easiest targets.
WHAT IS THE ‘CHICKENSHIT CLUB’
Jesse Eisinger in his book ‘The Chickenshit Club’ gives a blistering account of corporate greed and impunity, and the reckless, often anemic response from the Department of Justice. He describes how James Comey, the 58th US Republican Attorney (appointed by Republican George W. Bush and fired by so called Republican Donald J. Trump) was giving a speech to lawyers of the criminal division. These lawyers were some the nation’s elite. During his speech, Comey asked the question: “Who here has never had an acquittal or a hung jury? Please raise your hand.” This group thought of themselves as the best trial lawyers in the country. Hands shot up. “I have a name for you guys,” Comey said. “You are members of what we like to call the Chickenshit Club.”
Comey had laid out how prosecutors should approach their jobs. They are required to bring justice. They need to be righteous, not careerists. They should seek to right the biggest injustices, not go after the easiest targets.
This ‘chickenshit club’ has continued to grow. No top bankers from the top financial firms went to prison for the malfeasance that led to the 2008 financial crisis. And the problem extends far beyond finance–to pharmaceutical companies, tech giants, auto manufacturers, and more.
DPAs (deferred prosecution and nonprosecution agreements) have become the norm in the USA (and now is being legislated in Canada) where high crime perpetrators are being given the easiest way out by ensuring prosecution is carried out by paying a nominal fine and agreeing to minor policy changes, but without serving any jail time.
Political parties have joined the ‘Chickenshit Club’ by taking the easiest way out and failing to promote social justice and equality for all therefore ensuring that wealthy households and corporate elites continue to increase their wealth over single person and low income households.
The ‘Chickenshit Club’ of low income and food insecurity and minimum wage
Living Wage and Minimum Wage
It is a known fact that the Canadian minimum wage in all provinces is not sufficient to bring households up to middle class status.
A major failure of Living Wage research is that it usually only identifies three household profiles, a single person, single parent with children and a family comprised of two adults and children. The failure to include a household of two adults no children provides only a partial picture of inequality because it costs a single person household more to live than a two adult persons household.
Review of Living Wage profiles shows that even though living wages are higher than minimum wage, living wages are “no walk in the park”. A living wage which only covers basic needs still leaves low income households, especially those with rent or mortgages, suffering a ‘no frills’ lifestyle with an inability to save for retirement or emergencies or replacement of vehicles.
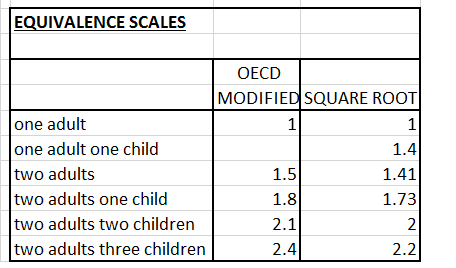
By excluding the two adults no children household profile from Living Wage profiles the single person household is an incomplete profile since it costs more for unattached person to live than the two adults household as shown in cost of living scales like Market Basket Measure (MBM). Example: if single person household has a value of 1.0, lone parent, one child or two adults household have a value of 1.4, one adult, two children 1.7 and two adults, two children 2.0. It costs more for singles to live than couples without children.
Many politicians, married and financially illiterate believe that a living wage is a good income but it only provides the bare necessities of life. The living wage in Calgary is about $18 per hour and in Metro Vancouver is about $19 per hour. There is no saving for retirement or maxing out of RRSP and TFSA accounts on a living wage (see example below for single person household with $50,000 income).
In a recent Conservative meeting, a Canadian Conservative Member of Parliament for Alberta stated he did not think the recent increase in minimum wage helped anybody, not even the poor. When challenged that ‘this was quite the statement’ and ‘what was the answer to low wages?’, he said ‘he didn’t know’. As outlined below, the upside financial chickenshit mess that has been created by government and politicians for single person households and low income families is because more benefits with less taxes and no declaration of assets has been given to the wealthy and the married. To create more financial social justice and equality, a drastic plan along the the lines of “Elizabeth Warren” and “Bernie Sanders” is needed so that the wealthy, married, and corporations pay their fair share.
The ‘Chickenshit Club’ of Single Person Household Poverty
Present day political parties and married/two person households with no children belong to the ‘Chickenshit Club’ when they fail to recognize, through financial illiteracy and financial discrimination, that single person no children households will likely face more income insecurity in their lifetimes.
From “The Affordability of Healthy Eating in Alberta 2015” by Alberta Health Services (affordability-of-healthy-eating):
(Page 3) “In Alberta, more than 1 in 10 households experience food insecurity and more than 1 in 6 children live in a home where at least one member is food insecure. Nearly 80% of Albertan households who rely on social assistance cannot afford to purchase adequate amounts of nutritious food or regularly endure significant worry about access to food. Furthermore, more than 75% of all food insecure Albertans are actively employed yet still are unable to secure enough money to support both their nutrition needs and other indispensable life necessities, such as housing and clothing.”
(Page 9) The above report provides a more complete picture of income inequality because it identifies four household types – 1) a family with two parents and two children because this composition is used most frequently by other social, income and poverty reports across Canada, 2) a female lone parent due to the high prevalence of food insecurity among this household type, 3) a single adult under age 65 since this demographic experiences the highest rate of food insecurity and the least financial support through social policy, and 4) a single senior to highlight the ability of current social policy to effectively reduce the risk of household food insecurity in this population. Unfortunately, the two adults person household is still not represented in these profiles.
Quote from the report (page 18): “Although Alberta remains the most prosperous region in Canada, it also maintains the largest gap in income inequality since the wealthiest 1% earns 18 times more than the average income in the province. Thus, the relative economic power of low income households in Alberta is weaker than low income households in all other regions across the country. Despite a strong economy, the poverty rate in Alberta has remained around 12%, which is only slightly below the national average of 12.5%. Boom and bust cycles, increasing household debt and the high number of temporary, precarious and low-wage jobs put many Albertans at risk of falling into poverty. The Alberta populations at highest risk to experience poverty include: single persons, families with children under 18 years old, families with more than one child, female lone parent families, women (not an inclusive list).
(Page 24 and 27) These statistical data sources also validated several important characteristics of Canadian and Albertan households that are at highest risk for household food insecurity: low income households, individuals who rent their home (rather than own their home), women, lone parents, Indigenous Peoples, individuals who receive social assistance, individuals who work for low wages, unattached (single) people, households with children younger than 18 years of age, recent immigrants and refugees (e.g. in Canada for less than five years), people who have a disability.
(Page 28) Single adult – In Alberta, 40.7% of people aged 15 and older are neither married nor living with a common‑law partner and 24.7% of all households are home to only one person. Unattached persons in Canada experience three times the rate of food insecurity compared to couple households without children. In Alberta, single people represent five times more food bank users than couples without children. The rate of poverty among single adults across Alberta is 28% whereas this value drops to only 6% for all couple families.
(Page 29) Single female – Unattached Canadian women are four times more likely than women in families to live in a low income household. Sixty two per cent of minimum wage earners in Alberta are female. Across Canada, 3 out of every 4 minimum wage earners older than 24 years of age are women.
(Page 30) Single adult 25–30 years old – Of all Canadian age groups, young adults between 20 and 34 years of age have the highest rates of moderate and severe food insecurity. Both males and females between the ages of 20 and 29 have the highest nutrition needs of all adult groups and would therefore need to spend a greater proportion of their income on food to support their health and well-being. By the time Albertans reach age 25, more than 83% are no longer living with their parents, so this age range would best reflect the reality of a young, single person at higher risk for food insecurity in Alberta.
(Page 31) Minimum wage – The percentage of 25–29 year olds who work for minimum wage in Alberta doubled between 2012 and 2014, and this is the largest jump for any working age group across the province. More than 1 in 4 female minimum-wage earners and nearly 1 in 5 male minimum-wage earners are 25 years or older. In Alberta, inflation has quickly eroded the contribution of every small increase to hourly minimum wage rates since the early 1980s.
(Page 39) Unattached persons in Canada experience three times the rate of overall food insecurity and seven times the rate of severe food insecurity when compared to couple households without children or with adult children. Single people represent the largest proportion in Canada, at 27.8% of all households, and they also constitute the largest share of food insecure homes at 38.2%. Single people without children also receive the least amount of government social support, as they are not eligible for the financial support of programs like family‑based tax credits and health benefits.
(Page 40) Single-person household based on the after-tax, low-income cutoff measure (LICO), the rate of low income in unattached male and female households has risen over the past decade while all other household categories have experienced a stabilized or decreased rate of low income. Nearly 1 in 3 unattached people between ages 18 and 64 lives below the LICO in Canada, compared to only 1 in 20 of the same cohort living as part of an economic family. An economic family refers to a group of two or more people who live in the same household and are related to each other by blood, marriage, common-law or adoption. The rate of poverty among single adults in Alberta is 28% but this value drops to only 6% for all couple families. More than 40% of Albertans aged 15 and older are neither married nor living with a common‑law partner and nearly one quarter of all homes in the province are inhabited by only one person. Between 1961 and 2011, the proportion of one-person households in Alberta has more than doubled and now nearly matches the number of homes with families or couples without children. Across the province, single people represent one third of all food bank users, and they outweigh couples without children by three and a half times.
(Page 40) Minimum wage is an important social policy because it intends to help lift low-paid workers above the poverty line so they have adequate income to meet basic needs for overall well-being. However, unlike Canada Pension Plan (CPP) and Old Age Security (OAS), minimum wage is not regularly indexed to inflation through adjustments to match the increase in the Consumer Price Index. This can lead to a hidden erosion in the value of this social policy since the general public tends to be unaware of how governments calculate changes to minimum wage rates over time. In 1965, Alberta’s minimum wage equalled 48.5% of the average provincial income, but by 2010 this proportion had declined to only 35.5%. Alberta’s hourly minimum wage rate had been the lowest of all provinces and territories for several years, but recent increases have raised low-paid workers’ earnings to a minimum of $11.20 per hour as of October 2015.
(Page 41) There is a widespread misconception that most Canadians who earn minimum wage are teenagers who live with their parents, but more than 1 in 4 female minimum wage earners and nearly 1 in 5 male minimum wage earners are actually 25 years old or older. In addition, individuals who are older than 24 years of age are the most likely to live alone while they earn minimum wage.
(Page 42) …. In fact, unattached Canadian men and women between the ages of 18 and 64 are five times more likely to live on a low income compared to their counterparts who live in economic families. Although the probability of living in a food insecure household is higher for females than males across all age groups and household compositions, income-related food insecurity affects unattached men at the same rate as unattached women.
(Page 44) Among all unattached Canadians, there are twice as many single adults younger than 65 years of age living below the after‑tax LICO compared to single seniors who live below this income. In addition, the prevalence of household food insecurity is two and a half times lower for the elderly who live alone than for unattached adults who are younger than 65 years old. However, the likelihood that a single senior will live on a low income is 10 times the rate for seniors who live as part of an economic family. This is significant since 25% of Albertans aged 65 years old and older live alone and unattached individuals are the most likely to rely on OAS and GIS.
“Social assistance soaring in Alberta, even as economy improves”, 2017 – Number of claimants on provincial income assistance programs has climbed to 54,374 in January of 2017, about 20,000 higher than at the start of the recession in 2015. Makeup of claimants include individuals 69%, lone-parent families 24%, couples with children 5%, and couples alone 3%. (Note: Couples with children and couples alone only equal 8% of the total). The Calgary Food Bank served a record 171,000 clients in 2016.
The real truth about the financial lives of unattached (one person) household
A single person household has to make an extraordinarily high income to achieve the same level of wealth as married with and without children households. A minimum wage means they will be living in poverty and with a living wage barely able to meet the financial necessities of life with no ability to max out RRSP and TFSA contributions.
Example of approximate average cost of living for a single person household (easily obtained from Living Wage Research): Rent for bachelor apartment (including water, electricity, tenant insurance) $1,000, food $400, vehicle (gas, repair and insurance) $200, phone/internet $300, clothing/footwear $100, dental/eyecare $100, house tax and insurance if a homeowner $250, contingency saving for emergencies and replacement of vehicle (10%) $300. Total equals $2,650 or $31,800 per year ($16 per hour based on 2,000 work hours). Totals do not include other expenses like bank fees, personal care expenses, household operation and maintenance, pets, vacations, entertainment, computer purchases and expenses, gifts, condo fees and professional association and union fees, etc. Note: this does not include saving for retirement beyond Canada Pension Plan (CPP) contributions. The living wage for Alberta is about $18 per hour based on 35 hour work week or 1,820 hrs per annum. Single person households receive very little income from government transfers (municipal, provincial and federal).
The following three examples, although simplistic, are real life examples for single persons:
- Single person private sector employee with $50,000 income ($25 per hour based on 2,000 worked hours) will pay about $11,000 for taxes, CPP and EI deductions. This results in a only a barely survivable net or take home living wage income of $39,000 ($19.50 per hour based on 2,000 hrs. or $3,250 per month). Using average cost of living of $32,000 from above paragraph, this person only has a reserve of about $600 per month. It is impossible for this person to maximize RRSP ($9,000) and TFSA ($6,000) contributions (about $1,200 per month) even though many financially illiterate believe $50,000 is a good income for unattached individuals. Moreover, as seniors their standard of living will likely be frugal and less equal to that of married/common-law households.
- Single person private sector employee with $60,000 income ($30 per hour and 2,000 work hours) will pay about $14,500 in taxes, CPP and EI contributions. This results in a net income of $45,500 ($22.75 per hour or $3,800 per month). This person will not be able to max out RRSP ($10,800) and TFSA ($6,000) contributions (about $1,400 per month). This still equals a frugal lifestyle (note expenses like vacations and eating out are not included in the average cost of living).
- Single person public sector employee with $75,000 income ($37.50 per hour and 2,000 work hours) will pay about $17,000 in taxes, CPP and EI benefits plus pension plan contribution of $7,500 (10 per cent). Union dues are not included here. This results in a net income of approx. $51,000 ($25.50 per hour or $4,200 per month). This person may be barely able to max out RRSP ($13,500) and TFSA ($6,000) accounts (about $1,541 per month) at the expense of no vacation and eating out expenses and will have a public pension on retirement, but still will not have a standard of living equal to that of married/coupled households since they pay more taxes than married households and will not receive benefits of married persons (spousal RRSP, pension splitting, etc.) Market Basket Measure shows it costs single person household more to live than married households.
Lessons learned: A minimum wage of $15 means single person households will live in poverty and a living wage equals a very frugal lifestyle with no frills.
‘Chickenshit Club of women being paid less for equal work
From the above Alberta Report and Canadian statistics it is evident that a major problem still exists of women being paid less for equal work.
From Global News, report finds that women in Canada earn just 84 cents for every $1 earned by men, a gap similar to the one reported in official statistics. In 2017, Statistics Canada said Canadian women were making 87 cents for every $1 earned by men. [T]he Glassdoor study went one step further, finding a four per cent pay differential between men and women even when factors like education, years on the job, occupation and professional title are taken into account. In other words, Canadian women are making just 96 cents for every $1 earned by men with the same qualifications, job and experience, something Glassdoor is calling the “adjusted pay gap.”
How many years is it going to take before women receive equal social justice on pay equity? Instead of being ‘chickenshit political parties’ which political party is going to take this issue on?
‘Chickenshit Club’ of Canada Child Benefit
The present day ‘chickenshit club’ Canada Child Benefit does help to bring low income households with children out of poverty and food insecurity (this is a good thing), but only during the first eighteen years of the household’s entire lifecycle. When children are grown, low income single parent households are back to ‘square one’ of the adult probability of living in poverty.
The Canada Child Benefit was implemented by Stephen Harper, previous Conservative Prime Minister, and was taxed. Liberal Prime Minister Justin Trudeau made it non taxable.
All political parties have been complicit in perpetuating financial policies that increase middle class wealth to upper middle class status while forcing poor families and single unmarried individuals further into poverty.
Financial Post “Couple needs to cash in rental condo gains to make retirement work” (ditch-rental-condo-to-get-ahead) details a couple age 42 and 43 already having a net worth of $1.8 million, take home pay of $10,936 per month and receiving $286 in Canada Child Benefits for three children.
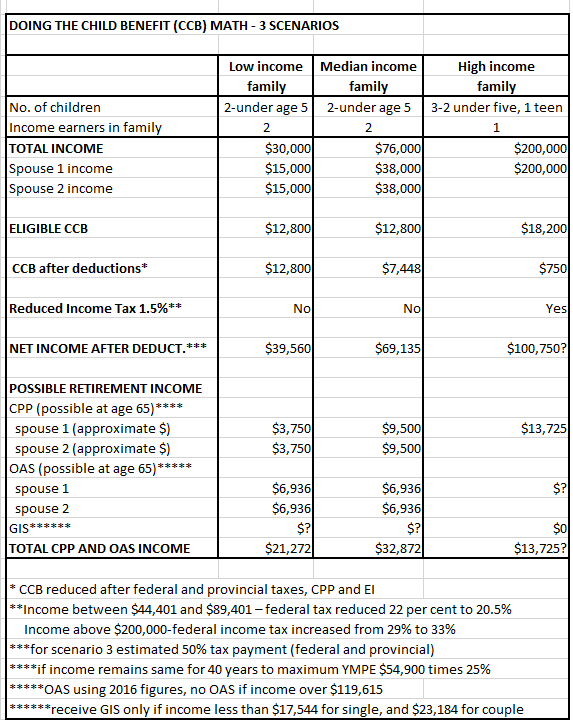
In 2018, Ontario couple with a child under six years of age would stop receiving CCB payments with a net income reaching $188,437.50 without other deductions such as RRSP (canada-child-benefit-is-a-win-for-most-families). $188,000??? This is not an income of poverty.
The inequality of family benefits for the upper middle class and wealthy families is perpetuated even further by the compounding of benefits on top of benefits. The article “Supercharge your Canada Child Benefit by making an RRSP contribution” (supercharge-by-making-an-rrsp-contribution) outlines how RRSP contributions are considered to be a tax deduction; therefore, they lower taxable income and can increase the amount of CCB payments. The example of Ontario family with 3 kids under age 6 years of age and a family net income of $75,000 with full $13,500 RRSP contribution for the year (18% X $75,000) can expect a CCB payment of $13,215 and will pay approx. $11,814 in taxes. Because of RRSP contributions in the previous year, their CCB payments increased by $1,465 for the present year. Additionally, they will save $1,401 in taxes and at a marginal rate of 29.65%, their RRSP contribution will also result in a tax refund of about $4,000. The compounding effects of benefits means they will pay less taxes, get larger CCB payment and increase their RRSP wealth. The total family income with CCB is $88,215 (combined after tax and tax free) and they have increased their wealth by $13,500 RRSP for the year of contribution).
Using turbotax calculator for Alberta family with $250,000 gross income or approx. $160,000 net income ($13,300 per month) they should be able to max out maximum allowable 2019 $45,000 for couple to their RRSPs and $12,000 TFSA for the year. Through compounding effect of benefits, including marital, they will pay approx.$21,000 less taxes, get larger CCB payment, increase their RRSP and TFSA wealth, own their home, and have approx. $181,000 minus TFSA $12,000 contribution or $169,000 ($84.5/hr.) spending capability annually.
It should be noted that there may be other credits and deductions that can be used which will further increase income available for spending.
What would anyone think that unattached individuals with no children don’t deserve to be angry because they know their hard earned money is used to increase the wealth of upper middle class and wealthy families since these families never pay their fair share in taxes because they can avoid taxes through multiple compounded benefits ???
“Ontario woman’s problem is too much debt and too little income” (forced-to-retire) is a very good example of what singles might face (i.e. on $3,750 income per month) when they are forced to retire early due to illness (doesn’t say if she is divorced or widowed).
Solution: As per above example of $50,000 income it is impossible for single person household to have a meaningful financial life equivalent to that of married no children households.
Politicians need to get off their chickenshit politics, stop taking the easy way out, and do the hard thing by including assets and Market Basket Measure calculations in financial formulas so that singles and low income households get financial social justice and equality equal to that of wealthy and married households.
How about implementing legislation where never married no children persons should not have to pay any income tax on incomes below $50,000 so that get a benefit equivalent to that CCB and multiple benefits to families with and without children?
Chickenship Club of Climate Change
The Green Party keeps talking about a climate change plan, but like other plans and environmentalists/protesters it is all talk with very little information. When is the Green Party (they are after all the Green Party) going to come up with a plan, for example, a line graph that shows what will happen in year one, year two, etc. What is going to happen to all the gas combustion vehicles, gas furnaces and water tank heaters. Where are you going to dump them? Apparently some gas combustion vehicles can be converted to electric. What are you doing about that? Are you going to shut very expensive oil refineries down that are still able to be used for another fifty years?
Many green earth technologies use rare earth minerals some of which are very toxic. At the present time China produces 80 per cent of the rare earth minerals. Just how do some extreme environmentalists and politicians think rare earth minerals get to Canada from China to be used in production of wind turbines? The answer is probably by tanker.
The hypocrisy of the tanker ban is that it is only one way? Does the ban on tanker traffic address the tankers coming into Canada?
Elizabeth May was so impressed with India’s climate change plan. However, India has just voted in again an authoritarian government with the help of far right Hindu religious voters. India at present time has no middle class and the highest rate of unemployment in forty five years.
Any plan that is implemented by any country has to provide 100% climate change funds to the poor to convert from gas to electricity instead of excessive compensation of the wealthy who are the highest emitters of energy and the biggest consumers of natural resources.
Elizabeth May since her marriage has upped her membership in the ranks of the wealthy high super emitters of energy and super users of natural resources. Those with multiple properties (examples: second property hop farm owned by Elizabeth’s husband, Arizona and other vacation properties that sit empty for six months of the year and excess travel between these properties, huge motorhomes, etc.) should pay more for this privilege afforded to them by their wealth.
Green Party Reform of spousal pensions for those who have married after the age of 60 or retirement
The Green Party and particularly Elizabeth May belong to the chickenshit club of married/coupled financially privileged households.
From the ‘Surviving Spouses Pension Fairness Coalition’ May states she has lobbied to repeal legislation that denies pension benefits to spouses who have married after the age of 60 or retirement. In one of her letters she states: …The Green Party supports deleting these restrictive clauses in the Federal Superannuation Acts which penalize pensioners who have remarried or married for the first time after age 60 after retiring….these clauses serve to unfairly deny hard earned pension benefits to deserving partners. These….clauses are causing great hardship to the survivor whose spouse gave a life in service to our country.”
Liberal Prime Minister Trudeau in his letter also supports this – “I and the entire Liberal Caucus, believe that Canadian seniors are entitled to a dignified, secure, and healthy retirement. Retirees deserve financial security; they deserve a strong Canadian Pension Plan, and a government who is not only committed to protecting the CPP, but is dedicated to improving its benefits. A secure and comfortable retirement is essential to achieving middle-class success, and Liberals believe that the federal government must do more to fulfill this promise. While the Conservative Government has left Canadians and the provinces to fend for themselves, Liberals support working with the provinces to create legislation that will make retirement security easier, not harder for all Canadians to achieve.” (Shouldn’t the same apply to never married no children senior households?)
Tom Mulcair, NDP letter states – “New Democrats want to acknowledge the debt we owe our seniors and reward the years of hard work and dedication to our country. That’s why we are committed to ending these archaic restrictions on benefits for pensions and their spouses.”
This is not the only pension plan where marriage for only a few years privileges the surviving spouse who hasn’t made any contributions to the pension.
Why, why, why do married persons believe they are entitled to benefits they haven’t earned? These newly married persons never worked for and never made contributions to the pension of their spouses. The reform of all spouses pensions similar to the above promotes the financial discrimination of never married, no children persons. Why do these married persons who never worked for these pensions deserve to have a better lifestyle than never married, no children persons? Never married, no children persons can never access another person’s pensions. As stated above, it has been shown that it costs more for never married, no children persons to live. Why can’t a new widow because of death of the spouse live with the same financial realities as a never married, no children person? Afterall, the widow is now ‘single’.
Solution: A proper financial justice solution would be to pay whatever is left in deceased spouse’s pension to the surviving spouse in the same way that whatever is left in the never married, no children person’s pension is paid to the listed benefactor. If benefit after benefit is given to widows, equal financial remuneration equivalent to these benefits should also be given to never married, no children seniors.
Chickenshit Club of Conservatives Jason Kenney (Alberta) and Doug Ford (Ontario)
Jason Kenney is already showing his true Trumpian values by targeting most vulnerable residents at the lower end of the financial scale. He is doing this by lowering corporate taxes and reducing teen minimum wage instead of making the wealthy pay their fair share of taxes. Just waiting for him to reduce progressive taxes back to a flat tax! Doug Ford continues to do his damage by breaking election promises, attacking healthcare and public sectors and employees of these sectors, and implementing retroactive financial policies on budgets that have already been planned.
Where are the ‘Elizabeth Warren’ and ‘Bernie Sanders’ of Canadian politics that will promote social justice and financial equality by ensuring corporations and upper middle class families and the wealthy pay their fair share of taxes without the compounding of benefits that make them wealthier than single person and low income households?
Chickenshit Club of Liberal Party
The Liberals also belong to the Chickenshit Club of politics as they have done very little to promote social justice and equality where wealthy and corporations pay their fair share. They are promoting ideas for the elderly to receive benefits if they have to work over the age of 65. How nice – make the senior poor work longer while giving benefits to the wealthy and married who have multiple compounding of benefits which allow them to retire at age 55.
Liberals keep talking about helping the middle class – the real truth is they are pushing the middle class up to the upper middle class while keeping unattached persons and low income families at the lower end of the financial scale. With their plans there will be no middle class.
The Liberals have done nothing to mitigate the financial injustice and inequality of Conservative Tax Free Savings Account (TFSA) which benefit wealthy the most.
The following was published in the Calgary Herald as this blog author’s opinion letter on TFSAs – ( Ted Rechtshaffen and Fraser Institute are telling half truths since only child rearing years are discussed on who is paying more taxes. Wealthy Canadians with TFSA accounts pay no tax on investments earned; therefore, someone else is indeed picking up the bill, i.e. those who can’t afford TFSA accounts. Singles pay more taxes throughout entire lifetime).
“TAX LOOPHOLES NEED TO BE CLOSED”
Re: “Trudeau is right, 40 per cent of Canadians pay no income tax, Opinion, Feb. 8, 2019 (someone-else-is-picking-up-the-bill) ”
Ted Rechtshaffen and the Fraser Institute once again tell half-truths about who pays the most income tax. Conservatives have created a TFSA monster at home (not offshore) tax loophole.
“They Want To Spend $50,000 In Retirement, Did They Save Enough?”(did-they-save-enough) outlines how an Ontario couple with large TFSA, RRSP accounts and a $600,000 house can retire at 55 and evade income taxes for 15 years while using benefits intended for low-income persons.
Canada, one of the few countries with TFSAs, has the most generous plan with the only limit being annual contribution amounts. Others (example Roth IRA) impose age, income and lifetime limits on contributions.
Without further addition of TFSA limits, the wealthy will pay less income tax than those who cannot afford TFSAs.
Chickenshit Club of Drug Cost and Advertising
All political parties are lobbying to cut drug costs. Has anyone thought of limiting the amount of advertising drug companies can do? Advertising is very expensive. Surely, this money could be used to decrease drug costs and to promote research for new drugs. Why does one have to listen to advertisements on Peyronie’s disease, hemorrhoids, female and male sexual drive dysfunction, etc. over and over again. Information on benefits of drugs should occur from discussion between the doctor and patient, not from advertisements. One solution would be to limit the amount of times each drug company can advertise in a given time period.
Chickenshit Club of Issues like Tanker Traffic Ban, Money Laundering, etc.
It doesn’t matter which political party it is – Liberal, Conservative, Green Party, BC NDP party, etc., all political parties with their chickenshit politics are trying as hard as they can to harm certain provinces and low income citizens in any way they can. Governments at all levels have failed in controlling ‘dirty money’ and indeed have been complicit in promoting it. Some have hypocritically implemented legislation that negatively impacts only certain parts of the country.
Tanker Traffic Ban – on west coast, but not the east coast while increasing other revenue generating traffic such as cruise ships, ferry traffic and sightseeing boat traffic on the west coast.
Money Laundering in BC and Canada – The money laundering problem is prevalent across Canada but the egregious case of the ‘Vancouver Model’ of money laundering in BC shows how greed of chickenshit government overtakes the moral and ethical logic of doing the right thing. BC governments failed to address the problem because of the huge amounts of money generated for the BC Lottery Corporation to be used for government programs. Since this also apparently involved real estate, housing prices rose to an exponential level. Who is affected most of all? – low income persons who can’t afford housing, be it rental or ownership.
CONCLUSION:
Unless there is a major change to the upside down financial situation of politics and government where the wealthy, married and corporations stand to financially benefit the most (selective socialism for the rich), there is little hope that single person households and low income families will ever reach the middle class status so hypocritically touted by governments, politicians, families, and the elite. They should seek to right the biggest social injustices and financial inequalities, not go after the easiest solutions.
(Updated June 8, 2019)
(This blog is of a general nature about financial discrimination of individuals/singles. It is not intended to provide personal or financial advice.)