
STAGNANT MINIMUM WAGE AND LOW INCOME IMPACT ON CPP ENHANCEMENTS
(These thoughts are purely the blunt, no nonsense personal opinions of the author about financial fairness and discrimination and are not intended to provide personal or financial advice.)
Occasionally there are events or things in life that will ‘rock you to your core’, ‘knock your socks off’, or ‘set you back on your heels’. On writing for this blog, one of these things or events is the minimum wage or low income and what an impact this has on financial lives of the poor and low income regards to proposed CPP enhancements.
From Department of Finance, “Background on Agreement in Principle on Canada Pension Plan Enhancement” (fin.gc) for proposed enhancement of CPP states the following:
‘Today, middle class Canadians are working harder than ever, but many are worried that they won’t have put away enough for their retirement. Each year, fewer and fewer Canadians have workplace pensions to fall back on. To address this, we made a commitment to Canadians to strengthen the Canada Pension Plan (CPP) in order to help them to achieve their goal of a strong, secure and stable retirement……
There will be gradual 7-year phase-in below the Yearly Maximum Pensionable Earnings (YMPE), followed by a 2-year phase-in of the upper earnings limit….
The maximum amount of earnings subject to CPP (from 2023 to 2025) will be increased by 14%. The upper earnings limit will be targeted at $82,700 upon full implementation in 2025…..
In 2023, the CPP contribution rate is estimated to be 1% higher for both employers and employees on earnings up to the YMPE. Beginning in 2024, a separate contribution rate (expected to be 4% each for employers and employees) will be implemented for earnings above the then prevailing YMPE.
All working Canadians will benefit from an enhancement of the CPP. This enhancement will increase income replacement from one-quarter (25%) to one-third (33%) of pensionable earnings.
As the CPP enhancement will be fully funded, each year of contributing to the enhanced CPP will allow workers to accrue partial additional benefits. In general, full enhanced CPP benefits will be available after about 40 years of making contributions. Partial benefits will be available sooner and will be based on years of contributions.’
The following information regarding the middle class has been taken from (theglobeandmail):
‘A 2013 internal government document, entitled “What We Know about the Middle Class in Canada,” draws the lines more precisely, deeming the middle class as those whose after-tax income falls between 75 per cent and 150 per cent of the national median – which, using 2012 figures, would include any family taking home $54,150 to $108,300 a year. “Family,” however, is a catch-all demographic that includes couples of all ages, with or without children, single or double-earners, and single parents. Single people are excluded entirely – one of the fastest growing groups in Canada and a big chunk of the middle class – whose income, using the same government calculation above, would fall between $21,150 and $42,300…..This is one reason why so many millionaires (44 per cent of those who responded to a recent survey by CNBC) outrageously define themselves as middle class when, in fact, once your personal income closes in on $200,000, you leap into the top 1 per cent of earners in Canada….(and top twenty per cent have salaries over $116,000).
Average income (before taxes and transfers) by quintile, all family types, 2013
- Lowest: Up to $13,000
- Second: $13,100-$37,000
- Middle: $37,000-$66,500
- Fourth: $66,500-$111,600
- Highest: $111,600 and up
Source, Income Statistics Division, Statistics Canada
What the numbers say: Income levels have fluctuated over the last four decades, with lasting growth concentrated among the wealthiest. In 2011, the incomes of the bottom three quintiles were still lower than in 1976, adjusting for inflation. The top 40 per cent had jumped ahead, with the largest gains made by the top 20 per cent. Compared with 1976, they were the only Canadian households who saw their share of income rise….
What the numbers say: Between 1999 and 2012, the median net worth of Canadian families rose nearly 78 per cent, from $137,200 to $243,800. Most of this wealth is concentrated in housing, especially for lower-income groups. This new wealth wasn’t evenly distributed, however. Gains were higher, the wealthier the family. While median net worth grew by 107 per cent for the richest families, for the bottom 20 per cent it rose just 14.5 per cent. Within the middle class, richer Canadians also did better – the upper middle income saw their worth grow by 90 per cent; the lower middle income by 60 per cent…..
Baby boomers are working longer than expected, debts are rising, and grandma’s housing bonanza is pricing her grandchildren out of the real-estate market, especially in big cities where the best jobs are increasingly concentrated. Paul Kershaw, who studies generational equity at the University of British Columbia’s School of Population and Public Health, has calculated that Canadians in their late 20s and early 30s will have to save, on average, five years longer to produce a down payment, and work one month a year more than their peers in 1976 to cover their mortgage. And according to a June report from the Canadian Centre for Policy Alternatives, thirty-somethings are the only age group with a lower overall net worth in 2012 than they had in 1999…..’
READER COMMENT on above article:
‘This is the reality of Canadians in their twenties and thirties. They are buffeted on the one hand by a regressive Service Sector (Service Sector-more than fast food outlets- includes banking, insurance, and information technology) senior management style reminiscent of pre industrial revolution feudal management and owners who believe that the 15% federal tax is excessive and should be demolished. On the other hand these all important Canadians under forty years are hopelessly burdened by the same senior management who are responsible for policy that has created unmanageable long term student debt, unconscionable large mortgages with no long term rate matching to amortization and no defined benefit pension plans….the existing Bank Act and Insurance Act as well as Competition Law provides ample power for an enlightened government to bring fairness to our most important asset – Canadians under forty years old’.
MoneySense (middle-class)data based on Stats.Can. 2011 figures – Middle 20% pre-tax income for unattached individuals is $23,357 to $36,859 and for families of two or more $61,929 to $88,074.
In 2013, Stats.Can. data shows median after-tax income for unattached singles over 65 to be $25,700 and under 65 to be $29,800. For female lone parent families $39,400, for two parent families with children $85,000 and senior families $52,500.
Living Wage Dollars (politicians) (a basic wage that keeps poor working Canadians off the streets) for 2013 Guelph, Wellington and 2012 Grande Prairie range from $19,284 to $25,380 for unattached singles and $56,796 to $62,844 for two parent, two children family unit. Living Wage for Guelph/Wellington for 2015 has been set at $16.50 for family unit of two parents and two children. The City of Vancouver employee living wage for 2016 is $20.64. The calculated living wage for Toronto family unit of four for 2015 is $18.52.
Minimum wage in 2015 (minimum) in provinces looked like this – British Columbia $10.25, Alberta $10.20 ($11.20 in Oct. 2015), Saskatchewan $10.20, Manitoba $10.70, Ontario $11.00, Quebec $10.35, New Brunswick $10.30, Nova Scotia $10.60, Prince Edward Island, $10.35, Newfoundland $10.25, Yukon $10.72, Northwest Territories $10.00, Nunavut $11.00. For 2016, provincial minimum wage ranges from $10.65 to $13.00. Very few provinces index minimum wage to inflation. The Alberta NDP party who came into power in 2014 promises to raise minimum wage to $15 by 2018.
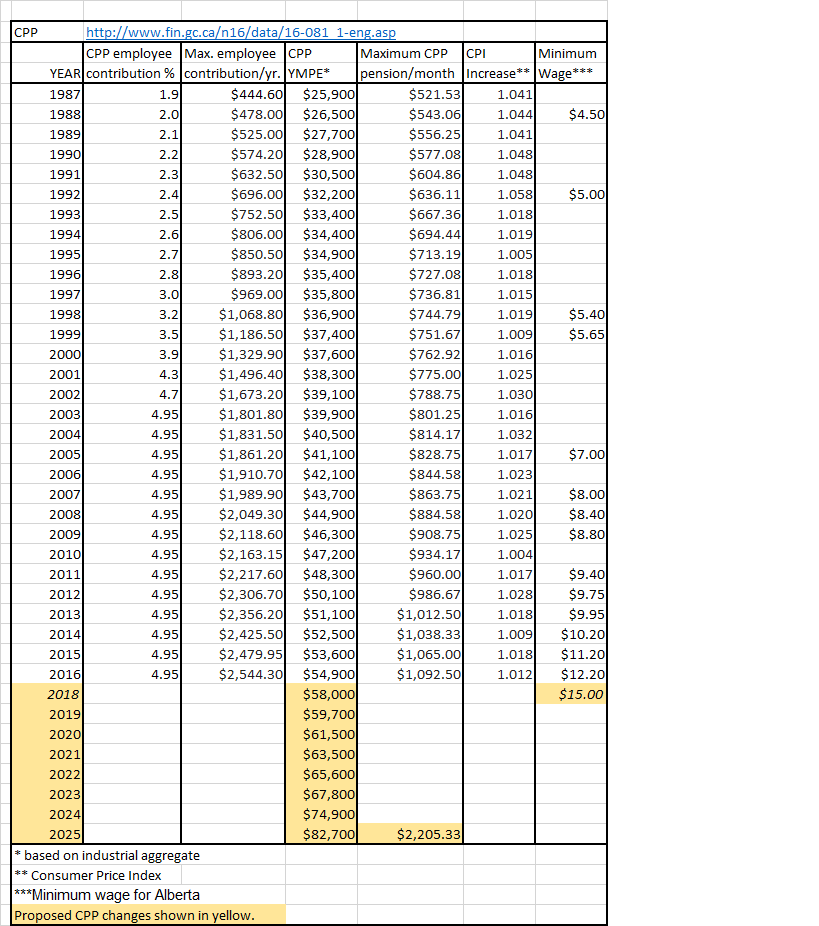
The following table shows CPP contribution and benefit rates from 1987 to 2025. Future proposed rates are shown in yellow. It is interesting to note that the maximum CPP pension payout does not equal 25% of the YMPE. Rather it seems to average around 24%. Where did the remaining dollars go – perhaps for administrative costs? Payout for 2025 has been calculated at 32% rather than 33%.
ANALYSIS
- Minimum wage or living wage in relation to CPP enhancement – A minimum wage averaging between $10.00 and $11.00 in Canada or approximately $20,000 and $22,000 annual wage for 2,000 worked hours per year means these employees working for forty years will receive virtually nothing in CPP payments in comparison to those employees whose maximum CPP YMPE will be $82,700. If the estimated amount of CPP after forty years of contribution for $82,700 maximum YMPE will equal about $2,000 per month, then the CPP benefit for $20,000 annual salary could be estimated to be 25% or $500 per month. Even with a living wage of $20.00 per hour or $40,000 annual salary for 2,000 worked hours will possibly only equal 50% or $1,000 (equivalent to rent or mortgage) CPP benefit per month. Just what incentive is there for the poor and low income to work when the YMPE will rise to a level that is higher than the middle quintile income of $37,000-$66,500 and when one of the criteria is working for forty years? While it is understood that incomes will likely rise over the next forty years, past history has shown that it will repeat itself by not increasing the minimum wage to a living wage equally in proportion to CPP contributions and benefits. Ever singles and early divorced singles without children deserve better when they have worked for forty years, never used EI, never used family benefits like maternity or parental benefits, child rearing dropout credits, child benefits and widowed person benefits along with all the marital manna benefits (pension splitting). Question to be answered: Will the minimum wage along with OAS and GIS rise to same level that CPP YMPE will rise and will they be indexed to same level (33% would be nice) so that CPP, OAS and GIS benefits for the poor and low income will be at least a living wage level throughout their senior lives?
- Upper-middle class will benefit the most while the poor and low income Canadians have been left out of the formula – Politicians and governments continue to coddle the middle class and especially the upper-middle class (so stated by financial government officials themselves in above article “middle class Canadians are working harder than ever”). The Canadians who will benefit the most from the proposed CPP YMPE are the top two quintiles earning $82,000 and up per year (fourth quintile $66,500-$111,600 average income for all family types as shown in above statistics). As the CPP YMPE rises at a level that is exponentially higher than the average income level of the middle class, so will the CPP payouts rise at a level that is exponentially higher for the upper middle class. In the table shown above, the yearly YMPE has risen at a relatively steady rate for each year. Examples: The YMPE rose $600 for years 2000 to 2001, $1,200 for 2015 to 2016 and proposed $1,100 for 2022 to 2023. The YMPE will take a dramatic jump of $7,100 ($67,800 to $74,899) for 2023 to 2024 and $7,800 ($74,900 to $82,700) for 2024 to 2025. The YMPE, which used to be more ‘middle of the road’ middle class, will now rise to upper middle class levels just like all other defined benefit plans in this country, the higher the salary-the higher the benefit. (Widowed persons of higher income deceased spouses also benefit more from these plans, but have not made contributions equal to the pension payouts, even though as widowed persons they are now technically single). It almost certainly can be guaranteed that annual incomes will not increase by that amount for any of the lower income groups and especially for the poor and low income groups. Pension plans in this country have been made schizophrenic and financially upside-down when they are controlled by the federal government, but minimum wages are controlled by the provinces, while ensuring the wealthy will get wealthier and the poor will remain poor.
- Four things that need to happen to eliminate financial discrimination of CPP enhancements – What is the incentive for ever singles, early divorced singles and poor families to work when government, politicians and businesses purposely implement financial policies that work against them?? Four things need to happen – one. raise minimum wage to a living wage with indexing; two, exponentially increase indexing of OAS and GIS to same level of $82,700 CPP YMPE; three, eliminate marital manna benefits that privilege high income families such as pension splitting and revise programs such as OAS recovery tax so they truly do progressively eliminate OAS according to income for the upper-middle class; and four, review all retirement benefits and retirement programs in totality and with each other (both on federal and provincial level) to prevent creation of financial silos that privilege the wealthy few.
SOLUTION
In addition to the above four items, how about adding six years of CPP benefits to total years worked for singles (ever singles and early divorced singles, excluding widowers), equivalent to child rearing dropout credits? (Added Sept. 26, 2016 but then, singles already work forty years so that idea won’t work. So how about applying the equivalence scale of 1.4 to the CPP benefits that singles have earned while working)? It is a known fact that it costs unattached singles more to live (senior-singles-pay-more) than married or coupled family units. The Canada Revenue Agency knows who singles are as they have indicate themselves as such on their income tax submissions. Now, wouldn’t that be a novel idea to eliminate financial discrimination and promote financial fairness for singles?
(This blog is of a general nature about financial discrimination of individuals/singles. It is not intended to provide personal or financial advice.)
 RSS Feed
Pingback: DOING THE MATH ON FAMILY TAX CREDITS SHOW FINANCIAL DISCRIMINATION OF POOR, LOWER MIDDLE CLASS FAMILIES AND SINGLES | Financial Fairness For Singles
Pingback: POOR ALWAYS PLACED AT A DISADVANTAGE | Financial Fairness For Singles