BOUTIQUE TAX CREDITS INCONSISTENT AND FINANCIALLY DISCRIMINATING (Part 2 of 2)

BOUTIQUE TAX CREDITS INCONSISTENT AND FINANCIALLY DISCRIMINATING (Part 2 of 2)

These thoughts are purely the blunt, no nonsense personal opinions of the author and are not intended to provide personal or financial advice.

(The following information is taken from:  Policy Forum: The Case Against Boutique Tax Credits and Similar Tax Expenditures by Neil Brooks (brooks) (abstractwhich show SELECTED TAX EXPENDITURES INTRODUCED OR SUBSTANTIALLY AMENDED FROM 2006 TO 2015 (page 129).  His article states:  

The table that follows lists selected tax expenditures introduced or substantially amended by the Conservative government between 2006 and 2015. These tax expenditures are listed under the headings and in the order shown in the Department of Finance’s Tax Expenditures and Evaluations 2014. To provide some context, a few of the listings have a brief introduction. The year in parentheses following the listing is the year the measure was introduced or enriched. The projected cost for 2014 of new and amended tax expenditures is then given, if it was provided in that year’s tax expenditures and evaluations report.

Where the tax expenditure takes the form of a tax credit, the table indicates the amount of the credit. The actual value of the credit to the taxpayer is almost always 15 percent (the lowest federal tax rate in 2015) of the amount claimed by the taxpayer.  For example, although the maximum amount of the children’s fitness tax credit was increased to $1,000 in 2015, the maximum federal tax saving to the taxpayer is $150 ($1,000 × 0.15).

Some of the costs to the government as outlined in the Brooks article for the Selected Boutique Tax Credit Benefits are as follows:  charitable donation benefits and exemption of capital gains $265 million from 2017 to 2020,  first time donor’s super credit $7 million, children’s arts tax credit $42 million, textbook tax credit for post-secondary education and certified occupational training $34 million-amount claimed by students (not transferred to parents), post-secondary scholarships, fellowships, and bursaries exempt from tax $45 million, Canada employment tax credit $2.145 billion, volunteer firefighters tax credit $17 million, search and rescue volunteers tax credit $4 million, family caregiver tax credit $65 million, age tax credit $2.955 billion 2009 (parliamentary budget officer estimates that the two increases in the age credit since 2006 will have a fiscal impact of $950 million in 2014), registered disability saving plan $8 million, pension income tax credit $1.12 billion, changes to registered retirement savings plans and registered retirement income funds $670 million from 2016 to 2020, first-time home buyer’s tax credit $110 million, home renovation tax credit $2.265 billion in 2009), public transit tax credit $190 million.

(It should be noted that some of these have changed or been deleted since the Liberal party won the 2015 election).

Table – page 1 of 4

boutique tax credit 5

Table – page 2 of 4

boutique tax credit 6

Table – page 3 of 4

boutique tax credit 7

Table – page 4 of 4

boutique tax credit 8

This blog is of a general nature about financial discrimination of individuals/singles.  It is not intended to provide personal or financial advice.


FEE SCHEDULES WHERE FAMILIES PAY MUCH LESS AND FINANCIALLY DISCRIMINATE AGAINST SINGLES

FEE SCHEDULES WHERE FAMILIES PAY MUCH LESS AND FINANCIALLY DISCRIMINATE AGAINST SINGLES

These thoughts are purely the blunt, no nonsense personal opinions of the author and are not intended to provide personal or financial advice.

This post is a reproduction of an article that was put together in 2009.  Even though the examples are several years old, nothing has changed where singles are consistently forced to pay more than families.  Many more examples can be found to replace these examples.

EXAMPLE A:

Fee Schedule

  • Standard Plan: Individual $65 Family $85
    Premium Plan: Individual $100 Family $130
    (Family is defined as two or more people and includes all members of a household)

Does this look like a fair plan?  The following information shows that this fee schedule is for a patient registration form from a local family doctor.  The fee schedule was put into place to cover uninsured services not covered by the provincial medical plan..  The uninsured services included:

  • telephone consultations
  • prescription renewals over the phone
  • completion of insurance forms, sick notes
  • medical supplies,
  • completion of school/camp forms, daycare notes
  • faxing/photocopying and transfer of medical records
  • pre-employment certificate of fitness
  • driver’s medical and physical examination form
  • citizen and immigration report
  • disability tax credit form
  • travel cancellation form
  • referral form for chiropractor and physiotherapy
  • referral note chiropody and massage
  • wart removal

The pay for service fee for any of these items ranged from low of $20.00 to high of $125.00.  The Standard Plan fee covered partial services of sick note, faxing and photocopying of medical records, back to work note, pre-employment certificate of fitness, referral  note for chiropractor and physiotherapy and referral  note for chiropody and massage.  The Premium fee covered all listed services.

THIS FEE SCHEDULE WAS RECOMMENDED BY THE PROVINCIAL MEDICAL ASSOCIATION

  • QUESTION: Why are singles paying more than families in adult to adult person comparison? (note:  assumption being made is that kids are FREE)
  • QUESTION: Who will be using more services such as school/camp forms, daycare notes, sick notes (by virtue of fact there are more members who will be using these forms in a family?  ANSWER:  Families will be using more of these services, so why are singles paying more in proportion than families?
  • QUESTION: Who will be using more of all of the services listed?  ANSWER:  Families will be using more of the services since there are more members in the family unit. So, why are singles paying more in proportion adult to adult in the family unit?
  • QUESTION: Why are couples without kids and alternative lifestyle couples without kids (included under family category, not single category) allowed to benefit (pay less) over singles?  They usually have two incomes, while singles only have one income.

SUGGESTION FOR A FEE SCHEDULE THAT PROMOTES EQUALITY AMONG ALL MEMBERS OF SOCIETY – form a plan that bases the fee on number of adults (kids would be free).

  • Individual $65 – change to $50 for one adult (singles are one unit, only have one income)
  • Family $100 – leave as $100.  (This would ensure each adult in whatever family unit – husband/wife with kids and two incomes, husband/wife with no kids and usually two incomes, alternative lifestyle couples with/without kids and usually two incomes – would all be paying an equal amount per adult.  All kids would be FREE. Singles would not be subsidizing families.
  • Single Parent $50 – add new category (EVEN SINGLE PARENTS WITH KIDS ARE SUBSIDIZING FAMILIES WITH/WITHOUT KIDS AND ALTERNATIVE LIFESTYLE COUPLES WITH/WITHOUT KIDS.  Charging for the adult only would ensure that single parents who usually only have one income would not be subsidizing members of any type of family unit.  SINGLE PARENTS WITH KIDS AND ONE  INCOME SHOULD NOT BE PLACED IN SAME CATEGORY AS FAMILY UNITS WITH MORE THAN ONE INCOME!

EXAMPLE B:

Local family sports center fee for yearly membership fee is :

  • Family – $500 per year
  • Single – $300 per year

Once again singles/single parents with kids and one income are subsidizing all types of family units as described above who usually have two incomes.

A more appropriate schedule would be to charge per adult:

  • Family – $500 per year
  • Individual – $250 per year
  • Single parent with kids – $250 per year

EXAMPLE C:

Local library fee schedule for yearly membership is:

  • Family – $20
  • Adults (18+) – $15

A more appropriate schedule would be:

  • Family – $20
  • Individual – $10
  • Single parent with kids $10

Many more examples can be given where singles/single parents with children are at a disadvantage compared to families.  (I.e., weekly Superstore coupon worth $25 is given when $250 is spent.  How can a single/single parent with kids even begin to spend $250 each week on one income?)

Above examples (just a few!! Out of many) show how the rich keep getting richer and how lower and middle income families benefit the most while individuals/single parents with kids and single incomes are the financial losers!!

The above recalculation of fee schedules did not take rocket science.  It appears government and decision makers won’t or can’t use financial intelligence and simple mathematical statistical formulas to promote the financial rights and privileges for equality of all citizens regardless of marital status.

The irony of this recalculation is that the fee schedules based on adults  may bring in slightly less revenue, and in some cases would even bring in more revenue while promoting financial equality.

This blog is of a general nature about financial discrimination of individuals/singles.  It is not intended to provide personal or financial advice.


EMPLOYMENT INSURANCE FINANCIALLY DISCRIMINATES AGAINST THOSE WITHOUT CHILDREN

EMPLOYMENT INSURANCE FINANCIALLY DISCRIMINATES AGAINST THOSE WITHOUT CHILDREN (‘EVER’ SINGLES)

These thoughts are purely the blunt, no nonsense personal opinions of the author and are not intended to provide personal or financial advice.

There has been much discussion lately about Employment Insurance (EI) in Canada particularly in those provinces who have been hit hard by the crash in oil prices.

There is also much that is unequal in how EI is paid out and the ruling Liberal party has stated that they will be looking at reforming the EI system.  One example is most Albertans need 700 hours of work to qualify for EI in sharp contrast to the 420 hours of work required for most Atlantic Canadians.

With inequities in how EI is paid out, one also needs to look at how much EI is paid out for maternity/paternity leaves.  It is very difficult to find statistics on how much EI is paid out for maternal/paternal leave versus that paid for the rest of the population (those who have lost their jobs).

Current Rules

EI maternity benefits are offered to mothers who cannot work because they are pregnant or have recently given birth. A maximum of 15 weeks of EI maternity benefits is available. The 15 weeks can start as early as eight weeks before the expected date of birth, and can end as late as 17 weeks after the actual date of birth.

EI parental benefits are offered to parents who are caring for a newborn or newly adopted child. A maximum of 35 weeks of parental benefits is available to parents. The two parents can share these 35 weeks of benefits.

Many companies top up their EI benefits for maternal/paternal benefits to one year.

Who pays for EI?

Every employed person pays EI premiums up to maximum of $930.60 per year (in 2015) plus employer contributions.

How are EI dollars used in maternal/paternal leaves?

For maternal/paternal EI leave, all things being equal, it is understood that each working parent will pay EI premiums.

One could say that with the birth of two children, the EI premiums paid by each parent have been used up.  With the birth of each additional child after two children, the parents have not only used up their EI premiums and are now drawing from the EI system that has been paid for by their employers and other Canadians.  In addition, if they are unemployed and have used EI premiums for two children, they again are drawing monies from the EI system that have been paid for by their employers and other Canadians.

Now consider those persons who have paid EI premiums, have never had any children and have been gainfully employed throughout their entire lives without drawing any EI benefits.  These persons are supporting/subsidizing those parents who have taken maternal/paternal leaves for their children.

Singles are forced to help pay for maternity/paternity benefits for not only one generation, but possibly two generations (if single works from age 25 to 65 years, span of 40 years could mean paying for more than one generation).  In addition to being forced to help pay for maternity/paternity benefits, there is the expectation to contribute to wedding/baby shower gifts for fellow generations (again could possibly be for more than one generation), but singles never get anything in return.  (This paragraph was added to post on April 20, 2016).

ANALYSIS

The Liberal party, with the present crash in oil prices, has actually used some outside the box thinking and given extra EI benefits to those older employees who have never used EI benefits in the past.  Long-tenured workers in the 12 regions identified in the budget as suffering the sharpest jumps in joblessness will be eligible for an extra 20 weeks of benefits to a maximum of 70 weeks.

Another outside the box thinking idea should be rebating at least some EI premiums back to senior employees without children who have never used EI benefits throughout their working lives.  They deserve as much for having supported families for many, many years.

LOST DOLLAR VALUE

For a person (‘ever’ single and married/coupled persons without children) who has been gainfully employed for forty years and paid an average of $900.00 per year (which is now at a maximum of $930.60 per year), the Lost Dollar Value would be $36,000 per person.(Updated April 10, 2016 as review of data over a couple of decades reveals EI amounts have been as low of approximately $800.00 to high of over $1000.00.)

ADDENDUM  (April 7, 2016)

For some who have applied for EI benefits this can be a demoralizing process, particularly if the person processing the application on the other side of the table is not very helpful. Families using EI for maternal/paternal  benefits do not have to face these obstacles.

‘Ever’ singles (never married, no kids) are never recognized or thanked for the contributions they have made to support families, one big contribution being EI benefits.  Adding insult to injury, all political parties over the years have used extra EI monies collected from employees and employers to pad budgets not related to EI.

“Ever’ singles in their senior years face huge obstacles in attaining the same financial standard of living as families and married/coupled persons because they are always forced to pay more and get less.  They also are not given the same level of benefits such as pension splitting which can provide thousands of dollars in tax savings for married/coupled seniors.

Financial fairness for ‘ever’ singles requires outside the box thinking.  One idea would be to give ‘ever’ senior singles a $2,000 or $3,000 annual totally refundable tax credit that would provide an extra $200-$300 per month to compensate for the EI monies they have given to families over the years.  (It would be very easy to identify ‘ever’ singles as marital status  is a required piece of information on tax returns.)

This blog is of a general nature about financial discrimination of individuals/singles.  It is not intended to provide personal or financial advice.

HOW MANY MORE DECADES WILL IT TAKE TO ERASE FINANCIAL DISCRIMINATION OF SINGLES?

HOW MANY MORE DECADES WILL IT TAKE TO ERASE FINANCIAL DISCRIMINATION OF SINGLES?

These thoughts are purely the blunt, no nonsense personal opinions of the author and are not intended to provide personal or financial advice.

In the discussion of financial discrimination of singles, it is useful to look at the history of financial discrimination.  Two women who were strong advocates of financial equality were Marie Babare Edwards and Vivien Kellems.

Marie Babare Edwards (January 2, 1919-December 31, 2008) , was a psychologist who helped pioneer a “singles pride” movement in the 1970s through her book (co-author Eleanor Hoover), “The Challenge of Being Single,” and workshops she taught died two days before her 90th birthday.  Her 1974 book included a “A Singles’ Lib Manifesto” and spelled out the unfair costs of being single in taxes, the workplace, insurance, and housing.

Divorced after 11 years of marriage and rearing her 9-year old son alone, Edwards found herself suddenly in sync with a third of the adult U.S. population that was single — then 43 million people.

Edwards became a zealous advocate for equal social status for the never or formerly married.

Kay Trimberger, a sociologist and author of “The New Single Woman” (2005), called Edwards forward-thinking, “a pioneer, writing about the social issues of singles before it was popular. For that reason, her writing sort of got lost.”

Edwards considered the book and seminars through most of the 1970s, “my most significant contribution as a psychologist,” she later wrote, because she helped “individuals and institutions appreciate singlehood as an alternate and viable lifestyle.” (She was an extrovert who came close to remarrying several times.)  (latimes)

Vivien Kellems (1896-1975), tax resister, feminist,  industrialist and runner as a senator, fought for numerous causes during her lifetime. While she believed in equality for women (in the workplace and in the home), and she proved an avid supporter of a woman’s right to vote.  However, some of her most contentious fights were  Kellems’ highly publicized battles with the Internal Revenue Service(IRS).

Already a prominent industrialist in Connecticut, she waded into the fight for the Equal Rights Amendment.  In stating her case, she put forward her own brand of individualist feminism. By contrast, many “social feminists” at the time such as Eleanor Roosevelt opposed the ERA because it would strike down “protective legislation” for women. In 1943, Kellems asked “what are you going to do with all these women in industry? If we’re good enough to go into these factories and turn out munitions in order to win this war, we’re good enough to hold those jobs after the war and to sit at a table to determine the kind of peace that shall be made, and the kind of world we and our children are going to have in the future.”

In the years that followed, Kellems continued to battle the IRS.  Protesting that tax laws unfairly penalized unmarried individuals, Kellems never filled out another tax return. She, instead, signed blank returns every year and sent them to the IRS. She continued her fight for tax law reform right up until her death in 1975. (connecticuthistory and historynewsnetwork)

MORAL OF THE STORY

Kellems’  fight for financial equality covered several decades, notably the 1940s to the 1970s.  Marie Babare Edward’s book in 1974 was published about forty years ago.

So how far have we come in the last sixty to seventy years in eliminating financial discrimination of singles (‘ever’ singles and early divorced)?

In Canada, while we do have equality in taxes being equal for individuals regardless of marital status, we do not have equality in singles receiving benefits equal  to marital  benefits and equal inclusion in financial formulas with married/coupled persons and widowers.

Much work still needs to be done.  The question is how many more decades is it going to take to have true financial equality for singles?

This blog is of a general nature about financial discrimination of individuals/singles.  It is not intended to provide personal or financial advice.

EVALUATION OF MONEYSENSE ARTICLES RE THE COST OF RETIRING WELL: COUPLES VERSUS SINGLES, DECEMBER, 2014 AND JANUARY, 2015.

EVALUATION OF MONEYSENSE ARTICLES RE THE COST OF RETIRING WELL:   COUPLES VERSUS SINGLES, DECEMBER, 2014 AND JANUARY, 2015.

These thoughts are purely the blunt, no nonsense personal opinions of the author and are not intended to provide personal or financial advice.

SOURCES OF INFORMATION FOR THIS BLOG POST

MoneySense, December, 2014, “The Cost of Retirement Happiness” by David Aston (couples) /the-cost-of-retirement-happiness/

MoneySense January, 2015, “Single Retirees: The Power of One” by David Aston (singles) /single-retirees-the-power-of-one/

Kudos to MoneySense-they are one of the few sources of information that identify what it truly costs singles to live in comparison to married/coupled persons.

——————————————————————————————————————–

The above articles for couples and singles were presented in two different timeframes by MoneySense.  financialfairnessforsingles.ca thought it would be an interesting exercise to combine the figures from both articles and complete an analysis of the figures for the married/coupled retirees versus the singles retirees.  (It is important to note that the definition of ‘single’ status by MoneySense is not the same definition used by financialfairnessforsingles.ca and Statistics Canada.  The only person who is truly single in the six profiles is Spencer as an ‘ever’ single person (never married, no children), while Reynolds is divorced and McDonald is widowed.  This is based on and justified by the Canadian Income Tax forms where the status of the tax filer has to be entered re status of married, single, divorced/separated or widowed and Statistics Canada definitions of marital status).

MoneySense Comments on Retirees Incomes

Couples – According to MoneySense author, a couple should be able to have a middle-class retirement lifestyle spending $42,000 to $72,000 a year including income taxes and assuming there is a paid-for home and no debt.  After tax, that will leave about $38,000 to $62,000 a year to spend as couples choose.  The minimum of about $38,000 (excluding taxes) should be sufficient to cover the basics, including operating a car and eating healthy.  Money Coaches Canada advises keeping annual spending on the basics within the $25,000 to $35,000 range, while trying to ensure there is at least $10,000 for extras, (Dec. /14, article).

Singles – According to MoneySense author, a middle class single retiree should count on spending approximately $30,000 to $50,000 a year including taxes and assuming there is a paid-for home and no debt.  This is about 70% of what is required for a couple since it costs about 70% of the couple’s rate for a single to maintain the same lifestyle as a couple.

For $30,000 income, taxes would be about $2,000 to $3,000 for older singles and $3,800 to $5,100 for younger singles below age 65.  After taxes and if budget is tight, singles should allow at least $20,000 to $25,000 a year for the basics (including shelter, groceries, transportation and clothing) and at least $5,000 for the extras like entertainment and travel, (Jan. /15, article).

Detailed Financial Information

Couples

Case #1 – It is stated that the Taylors live frugally but comfortably.  They have a paid-for three-bedroom home in a nice neighborhood and a ten-year old mid-level car. They eat out occasionally and take regular vacations.  They spend just over $25,000 on the basics, which leaves enough left over to spend almost $12,000 on the extras.  They both have university educations and held high-paying jobs in the technology industry while raising one child, who now lives independently.  Their modest spending habits allowed them to build their savings quickly while working, so they were able to retire in their early 50s and have a large nest egg.

Many advisers tell prospective retirees that they need to replace 70% to 80% of the peak income they had while working, but the Taylors live on less than 20% of the $250,000 they earned while working.

Case #2 – The Statscan couple depicts the average spending by senior couple.  (Source: Statistics Canada, Survey of household spending in 2010) plus inflation adjustments using the Consumer Price Index.

Case #3 – The Coopers, both close to 70, have lots of money to do the things they consider important, but don’t live a lavish lifestyle.  They spend modestly on the basics, which leaves plenty for the extras that give them the most satisfaction, like travel.  Their basic spending, at just under $45,000, isn’t much more than that of the Statscan couple.  But by economizing on the basics, they can afford to spend about $36,000 on the extras.  They learned frugality early on in life.  During their working years, they lived on his public sector professional salary while she had primary responsibility for the household and raising three children.  They also benefitted from his pension plan and saved by living well within their means and invested wisely. They have two vehicles (buy them used and keep them well beyond ten years).  Now they have far more money than they need to support their accustomed lifestyle.

The Coopers love to spend money for the benefit of their extended family.  They have a two-bedroom condo in the city as well as a vacation property.  They use their $16,000 travel budget for regular vacations.  They even spend some of their budget to cover the cost of extended family joining them on vacation.  They also contribute to their grandkids’ RESPs.  And while the $6,000 they budget for charitable and personal gifts is not enormous, they have distributed around $500,000 to their kids over the years to give them a good start.

Singles

Case #1 – ‘Ever’ single Spencer is in her early 60s and had to stop working at her physically demanding public sector job over a year ago due to a repetitive stress injury.  She hopes to return to work in some role, but even if she is unable to work again she feels she can live comfortably and sustainably on what she now has in savings, as well as government and employer pensions.  She has a $38,000 budget and pays $5,000 in income tax. Based on having a paid-for home she will spend about $23,000 on basics which leaves about $10,000 left for the extras.  She recently made the choice to move to a small town, mainly for the small town lifestyle, but also for the lower cost of living as well.  Money has been set aside to purchase a modest home.  (She does state that earlier in life she had some bad spending habits; however, she has learned to make careful, purposeful spending choices).

Case #2 – Reynolds in her early 60s (split up with her partner about ten years ago and no children?) is intent on making the most of retirement and has above-average means to do so.  Recently retired after a career in the public sector, she has a budget of $73,000 a year, including about $33,000 for the basics, and a sizeable $25,000 for the extras.  She likes to travel and has about $6,000 a year allocated to it.  In the early years of her career she was fixated on saving, which helped provide the ample nest egg she has today, including a group RRSP.

Case #3 – McDonald, a widower in his late 60s, has an above average budget of about $81,000, including $41,000 for the basics and $21,000 for the extras.  He uses his money to support hobbies, travel and spending on his two grown children and their families.  He is trying to find a balance between spending his money and leaving a large legacy.  He takes two to three trips a year with his $10,000 budget.  His budget also covers some travel for his children and relatives.  He spends quite a bit on groceries and restaurants, including paying for meals with extended family.  He happily spends less than his ample means would allow.

Qualifying Statements by MoneySense about the two articles

The MoneySense author along with Money Coaches Canada notes that the category ‘shelter’ includes property taxes, utilities, maintenance, house insurance, rent and mortgage payments.  Case #3 Statscan figures include a small proportion of costs attributable to a second home.  For the ‘vehicle’ category, $2,000 a year has been added for depreciation.  The category ‘home and garden’ includes cleaning supplies, furnishings, appliances, garden supplies and services.  The category ‘recreation and entertainment’ includes computer equipment and supplies, recreation vehicles, games of chance, and educational costs.

The author also makes the following qualifying statements: “If you are single, you know that retirement planning is tougher for you than it is for couples.  You have no one to rely on but yourself, and you can’t share expenses or split income.  As a result, you can’t just take the cost of retirement for couples and divide it by two. Situations vary, but a single person will need to spend roughly 70% as much as a couple to enjoy an equivalent lifestyle in retirement…The figure for couples isn’t twice the figure for singles–it is only about 40% higher because spouses are able to share costs for things like housing and cars.  The higher per-person income singles need also results in higher taxes”.

Table

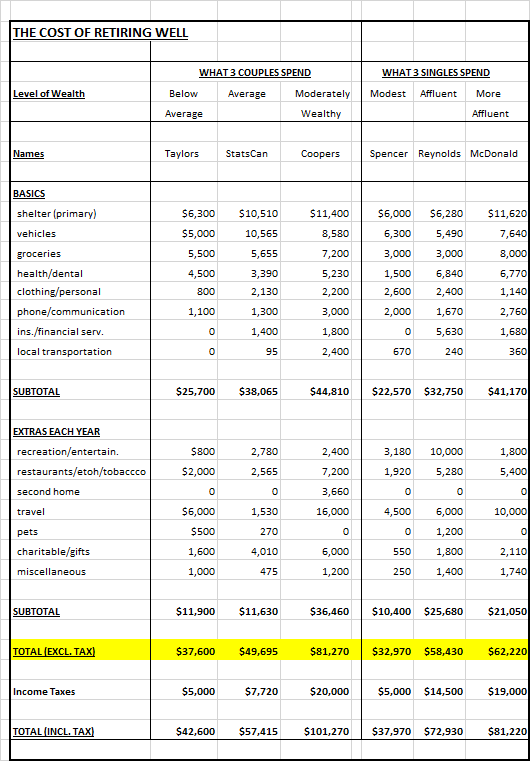
The following table combines the financial profiles of the three couples and three singles from the two articles into one table.

Following the table are financialfairnessforsingles.ca comments evaluating the results of the financial profiles.

moneysense cost of retiring well

Analysis of the Financial Profiles of Couples Versus Singles

Marital Status

First, it is important to get one fact straight.  Couples who divorce/separate and persons who are widowed are not singles.  The only person who is truly single in the six profiles is Spencer as an ‘ever’ single person (never married, no children).  The profile of the ‘ever’ single person shows that she is likely at the bottom of the financial status list in terms of wealth as she is the one with a modest home in a small town where it is cheaper to live.  The separated person likely has a better financial profile because she was able to accumulate wealth as a coupled person for twenty-five or thirty years and was separated later in life (if she had separated earlier in life, she likely would have a financial profile more equal to the ‘ever’ single profile).  All of the other profiles show that they have more wealth and homes in nice neighborhoods and even second homes (Coopers).
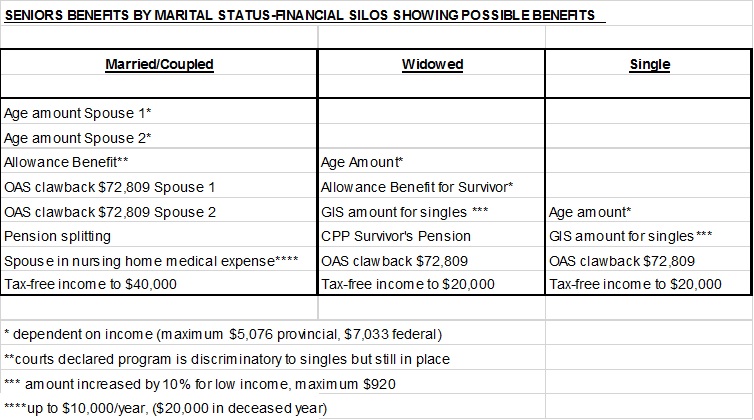
Benefits

Marital status also determines who is likely to have more benefits.  It can be assumed that the couples have the higher financial status simply because they are married or widowed.  The married profiles will most likely pay less income tax than the single profiles because couples receive two of everything, have the ability to pension split and can get survivor benefits when widowed, etc.   As retirees, the two profiles that lose on benefits are the ‘ever’ single person and the person who is separated.

It is stated that most of the couples have lived so frugally that they now have more money than they need, but at same time have three bedroom houses in nice neighborhood, vacation home, and can retire in their 50s and 60s with a very comfortable lifestyles.  This implies, even with frugality, they had plenty of money to spend and save as married/coupled families with children.

The single person is the one that has to move to a smaller town to lower living expenses while others are living in what appears to be substantial housing.

Taxes

On examination of the profiles, it is easy to see that the persons who are paying the most taxes are the ever single person, the separated person and the widowed person.  The Taylor couple pays the same taxes as the ‘ever’ single person (Spencer), but they have approximately $5,000 more in income and appear to have much more wealth in terms of assets (must be the pension splitting).  It pays to be married.  The Statscan couple pays less income tax (almost one half of the amount equal to 13.4%) than the separated Reynolds person (20%), but her income does not come even close to double of the Statscan couple.  The Coopers are paying only $20,000 on $100,000 income (20%).

The widowed person (McDonald) with all of his wealth is most likely receiving survivor benefits.  Did he pay extra for these benefits and why is he portrayed as being single?   If he is now single why should he receive anything more than the ‘ever’ single person and the separated person?

Benefits to Families of Coupled People

The profiles of the coupled persons and the previously coupled person (widower McDonald) blatantly state that they have more money than they can spend and have given generous monetary gifts, paid for the meals of their kids, grandchildren and extended family members, etc.

Married/coupled people or previously coupled people are often able to give exorbitant gifts, inheritances, etc. to family and extended family.  Does this not create a sense of entitlement for family, children and grandchildren who begin to expect this all the time? How does this extravagance teach frugality?

Emergency Monies

Where in any of these profiles has money been set aside for emergencies?  The person most likely to be unable to pay for financial emergencies due to illness, financial issues, etc. is the ever single person with the least accumulation of wealth.

Education, Education, Education!!!

It is beyond comprehension on how governments, families, society and think tanks lack knowledge and are financially illiterate on the true facts of how ‘ever’ singles and divorced/separated retirees are financially robbed to subsidize married/coupled retirees by paying more taxes while getting less benefits like pension splitting and widower benefits in this country.

Singles require 70% of the income/wealth of Couples

How many ways can this fact be stated and how many different sources of information does the government and society need to make changes on how singles are financially discriminated against in this country??  Do Members of Parliament ever think to include singles when making important decisions like pension splitting and benefits that benefit only the married/coupled and families of this country?  Government, businesses, society and media only ever talk about middle class families. Singles meanwhile have been financially discriminated against by their government and society.

 How expensive is it to raise a child?

So how expensive is it to raise one child, two children, and three children and still come out on top in terms of wealth in the personal profiles?  Governments, society and families, think tanks continue to talk about how expensive it is to raise a child, and yet many families are able to leave large legacies/inheritances to their children.  Unfortunately, based on the facts this seems to be based on the half-truths and lies of governments, society, families and think tanks.

Profiling

Singles are often profiled as having excessive spending habits/lifestyles while married/coupled persons are usually profiled as being frugal.  Married/coupled persons in their retired state are still profiled as being frugal even though they can give extravagant gifts (in one case around $500,000) to their children and grandchildren and spend more money on items like vacations.

 Happy, happy, happy!!!!!

In both articles the profiles and the author comments seem to imply that everyone is happy, happy, and happy with their financial status.  ‘Ever’ singles and divorced/separated retirees are blatantly told they should be happy with what they have even though they have been discriminated against financially.

‘Ever’ single persons and divorced/separated persons not so lucky to have achieved equivalent wealth (70%) of married/coupled persons as shown in above examples wish to state they are not happy with being financially discriminated against on every level of government and society.  They are not asking for more than married/coupled people.  They are asking for financial fairness.

FINAL STATEMENT

Governments, businesses, society, families, think tanks all maintain that the middle class is being affected most by poverty.  The real truth is that ‘ever’ singles, singles with kids, persons divorced/separated early in marriage/coupling, and families with low incomes are being affected most by poverty.  Singles (‘ever’ and divorced/separated) in this country are not happy with always being excluded from financial formulas and conversations.  They are human and in their humanity are equal to married/coupled people, and it is time that they are treated with the same financial fairness, dignity and respect as married/coupled people.

This blog is of a general nature about financial discrimination of individuals/singles.  It is not intended to provide personal or financial advice.

INCOMPLETE REPORTING OF NEWS AND MEDIA ARTICLES PROMOTE FINANCIAL INEQUALITY OF SINGLES TO MARRIED/COUPLED PERSONS

INCOMPLETE REPORTING OF NEWS AND MEDIA  ARTICLES PROMOTE FINANCIAL INEQUALITY OF SINGLES TO MARRIED/COUPLED PERSONS

These thoughts are purely the blunt, no nonsense personal opinions of the author and are not intended to provide personal or financial advice.

While it is recognized that news and media articles are limited by space, often what is left unsaid promotes financial inequality of singles in comparison to married/coupled persons.  Also, the misinformation of research and studies is perpetuated by other organizations picking up the misleading information and reprinting it.

Examples are as follows:

“Four Ways Senior Singles Lose Out” by Ted Rechtshaffen (outlined in Dec. 2, 2015 blog post /false-assumptions/).  Rechtshaffen’s article left ‘ever’ singles and early in life divorced/separated persons out by exclusion because the definition of single status was incorrectly used.  Instead, the ‘singles’ he referred to are actually widowers.  He stated how widowed persons financially lose out in tens of thousands of dollars because they are no longer part of a couple.  He suggests that tax systems should be made fairer, but only mentions widowed and later in life divorce/separated persons.  There is no mention of tax systems including ‘ever’ singles and early in life divorced persons.

This article was republished by CARP carp/ (Canadian Association of Retired Persons) and was sited in other news media outlets such as Financial Post financialpost, and National Bank Clear Facts clearfacts.

“An Analysis of the Economic Circumstances of Canadian Seniors” by Richard Shillington of Tristat Resources and the Broadbent Institute (February 28, 2016 blog post continued-financial-illiteracy-of-financial-gurus)  was sited in several news articles as follows:

Huffington Post, Daniel Tencer, February 16, 2016 “Are Canadians Ready for Retirement?  Not Even Close, Broadbent Institute” (huffingtonpost.) states:

‘Half of Canadians aged 55 to age 64 who don’t have an employer pension have less than $3,000 saved up for retirement.


Nearly half (47 per cent) of Canadians aged 55 to 65 without an employer pension and earn $50,000 and $100,000 a year have saved an average of $21,000.


Among those who earn $25,000 – $50,000 and don’t have an employer pension, the average savings is a paltry $250.

Median Income for single seniors-At the same time, the study says social support for retirees has become less generous. Old Age Security (OAS) and the Guaranteed Income Supplement (GIS) have fallen behind over the decades, and now give seniors just 60 per cent of median income, down from 76 per cent in 1984.


The report comes as the federal government launches pre-budget consultation hearings. Though the study doesn’t delve into specific policy options, it says the Liberals’ plans to increase the GIS for singles retirees will make little dent in senior poverty.


The plan “should remove 85,000 senior singles from the poverty rolls — leaving 634,000 seniors living in poverty,” the left-leaning Broadbent Institute said in a statement.’

Globe and Mail, Shawn McCarthy, February 15, 2016 “Many Canadians entering retirement with inadequate savings, study (theglobeandmail) says:

‘Income trends suggest the percentage of Canadian seniors living in poverty will increase in the coming years, especially for single women who already face a higher than average rate, the report said. The poverty rate for seniors will climb at the same time as a sharply rising number of Canadians hit retirement age in the next two decades; more than 20 per cent of the population will be older than 65 within 10 years.


Ottawa’s pledge to increase by 10 per cent the guaranteed income supplement – paid out to the poorest seniors – would cost $700-million and remove 85,000 single people – mostly women – from the poverty rolls.  But that would still leave 634,000 seniors living below the poverty line. And that number will grow dramatically in the coming years.’

Global News, Monique Muise, National Online Journalist, February 16, 2016 “Canadians nearing retirement with ‘totally inadequate’ savings (globalnews):  study” observations are much the same as outlined above.

creb now (Calgary Real Estate Board) February 19 to 25, 2016, “Canadians ill-prepared for retirement”  (crebnow) study  observations are much the same as above, but also adds statement:

‘Already, the spread between the OAS/GIS guarantee levels and the low-income measure for 2015 – the spread that seniors need to fill using the Canada or Quebec Pension plans (CPP/QPP), private pensions and private savings – is about $5,600 for single seniors and $4,700 for couples. The overall median value of retirement assets of those aged 55 to 64 with no accrued employer pension benefits (representing 47 per cent of this age cohort), is just over $3,000.’


Also in big letters ‘Amongst Canada’s single persons without pension income, the median income in under $20,000’.

Not one of these articles mentions from the Broadbent Institute study that when using LIM the poverty rates for singles seniors is nearly 30 per cent.  Also, the proportion of the population receiving the GIS (Guaranteed Income Supplement for Canadians in poverty) is higher for senior singles (including widowed) living alone than couples, and higher for single women (between 44 per cent and 48 per cent) than for single men (between 31 per cent and 37 per cent).  It also does not mention that reliance on the GIS is greater for single seniors that it is for senior couples across all age ranges.

In addition there are 719,000 seniors living below the poverty line.  This total includes 469,000 senior singles and 250,000 living in an economic family.  This is 65 per cent of singles in comparison to 35 per cent living in an economic family!  Sixty-five percent of singles, why is this never reported?  Why is the full information of singles finances never worthy enough to report with same equality as families?

Some of the articles above also mention the the new GIS increase of 10 per cent for single seniors “should remove 85,000 senior singles from the poverty rolls — leaving 634,000 seniors living in poverty.”  Statement with full truth should read:  “should remove 85,000 senior singles from the poverty rolls – leaving 634,000 seniors (384,000 senior singles and 250,000 living in an economic family)”.  This still leaves more senior singles in poverty than those living in an economic family!  ‘Half truths’ reporting sometimes is almost as good as telling a lie!

What also is not mentioned by the media is that the Broadbent Institute study does not treat home ownership as a retirement asset.  The report states:  

‘This analysis has not treated home equity as a retirement asset because the replacement rate analysis has as its objective an income that allows one to enjoy a lifestyle comparable to that which existed pre-retirement. We do not include home equity here because we accept that the pre-retirement lifestyle for many middle- and moderate-income Canadians includes continued home ownership’.

Home ownership is a big factor in determining the standard of living for seniors in their retirement years.  Statistics Canada 2011 shows approximately 69 per cent of Canadians own their own home.  About four out of five (82.4%) married/coupled people own their home, while less than half (48.5 per cent) of singles own their home.  Paying rent will have much more impact on poverty than owning a home outright.

CONCLUSION

To provide the real truth about singles’ poverty all it would have taken is the addition of 10 – 20 words to the articles (719,000 seniors live below the poverty line.  This total includes 469,000 senior singles and 250,000 living in an economic family.  The GIS increase for senior singles still leaves 634,000 seniors  – 384,000 senior singles and 250,000 living in an economic family in poverty).

The GIS increase of 10 per cent for senior singles is a paltry amount compared to all the marital manna benefits that has been given to married/coupled persons like pension splitting.

The sad reality is that by omission of singles from the conversation true facts of singles finances are never fully reported; therefore, there is little understanding on the part of married/coupled persons, families, government, businesses, and decision making bodies on what it truly costs singles to live.  Singles need to be included in financial formulas at the same level as married/coupled persons and families.

This blog is of a general nature about financial discrimination of individuals/singles.  It is not intended to provide personal or financial advice.

MONEY BENEFIT PROGRAMS FINANCIALLY BENEFIT MARRIED/COUPLED PERSONS AND FAMILIES MORE THAN SINGLES

MONEY BENEFIT PROGRAMS FINANCIALLY  BENEFIT MARRIED/COUPLED PERSONS AND FAMILIES MORE THAN SINGLES

These thoughts are purely the blunt, no nonsense personal opinions of the author and are not intended to provide personal or financial advice.

Married/coupled persons and families often receive ‘free money’benefits that financially benefit them much more than singles.

Two very good examples of these benefits are the Alaska Permanent Fund Dividend and the ‘Ralph Klein $400 Bucks’ Program.

Alaska Permanent Funds Dividends

The Alaska Permanent Fund Dividend (PFD) program implemented in 1982 is an annual payment paid to individuals (children as well as adults) rather than households.  It is paid irrespective of any income from other sources and does not require the performance of work or the willingness to accept a job if offered.  Unlike social assistance programs, it is not means-tested.

The book “Alaska’s Permanent Fund Dividend:  Examining Its Suitability as a Model”, edited by Karl Widerquist and Michael W. Howard states the following:

‘…..In 2008, when the PFD reached its highest level at $2,069, the individual  poverty threshold in the United States was approximately $11,000; for a family of four it was approximately $22,000.  Thus, at its highest level, the PFD would have provided less than 20 percent of the income necessary for an to individual to reach the poverty threshold, but almost 40 percent of the income necessary for a family of four to reach the poverty threshold……Thus, on basis of its level alone, the PFD is at best a partial basic income…

Finally, because of its flat and universal nature, the PFD on its own makes a very modest contribution to the reduction of inequality.  But the PFD together with the elimination of the state individual income tax that was part of its founding has an overall regressive effect on income distribution.  To have a significant redistributive effect, the PFD would have to be recouped from wealthy individuals; in the absence of a progressive state income, consumption, or wealth tax, the PF would have to be distributed on a sliding scale with larger dividends given to those with less income from other sources, rather than as a uniform flat payment….

The PFD does serve as an excellent model for the conceptualization of natural resources as commonly owned—an important step along the path to acceptance of the idea of a basic income.  It provides a model of cash transfers to individuals without any stigma of dependence, fraud, waste, or failure—attributes often attached recipients of other government cash transfers.  The PFD’s funding source in natural resources rather than in taxes on individual income or wealth seems to exempt it recipients from any need to justify their use of the dividend, and to exempt the transfer as a whole from the ‘socialist’ label….’

It has been argued that it is preferable to have oil profits distributed broadly rather than end up in the pockets of only a few corporate executives, wealthy shareholders, and political cronies.

Alaska is the only state that does not collect sales tax or levy an individual income tax on any type of of personal income, either earned or unearned.  Every Alaskan, children as well as adults, receives a payment each year from the Alaska Permanent Fund Corporation.  The USA does not have child benefits, although there is a child tax credit system for parents or guardians of children under 17 who meet certain requirements.  (The PFD is taxable by the Federal government).

Further review of information shows that in 2002, the poorest 20% of Alaskans relied on their dividend for 25% of their total income….some Alaskans depend on their dividend for up to a quarter of their yearly income, especially Native Alaskans, who make up 15% of the population. Those in poverty brackets and many of those living a subsistence lifestyle cannot afford to lose the dividend as a source of income.

However, review of articles on this program also states that the sense of entitlement has been established where it is very difficult to reduce state spending in this particular benefit at the expense of politicians losing their jobs, because state residents view these dividends as ‘rights’, not ‘privileges’.

One could argue that monies are being given to children who have not earned that privilege.  They have earned no money and have not paid any taxes.

If one looks at the PFD contributions over a twenty year period (lifetime of a family with children) in comparison to singles /individuals, the financial unfairness becomes apparent very quickly.  From 1996 to 2015,the benefits have ranged from a low of $846 to a high of $2,072 annually.  For a family of four the twenty year total amounts to $113,156 and for a single/individual person the amount is $28,289.  A lot more can be done with $113,000 than $28,000.

Prosperity Bonus (‘Ralph Klein $400 Bucks’) Program

The Prosperity Bonus, also nicknamed Ralph (Premier of Alberta at that time) bucks, announced in September 2005, was the name given to a program designed to pay money back to residents of the province of Alberta as a result of a massive oil-fuelled provincial budget surplus.  This program gave $400 to every citizen of Albertan in the year 2005.

For a family of four, the benefit was $1,600, while a single/individual received $400.

ANALYSIS

‘Free Money’ Benefits allow families to achieve greater wealth than singles/individuals even though the children of these families have not earned any income or paid any taxes. Married/coupled persons without children also achieve greater financial benefits because of accumulated assets times two.

SOLUTIONS

To achieve greater financial equality between singles/individuals and married/coupled persons and families, the following suggestions are submitted:

  • Eliminate children from these programs until they reach the age majority since they have not made any contributions to the coffers in the form of salaries or taxes; rather, they are using resources such as education instead of contributing to them.
  • Top up benefits to singles at rate of 70 percent 1.4 Market Basket Measure to that of married/coupled persons as it costs more for singles to live than married/coupled persons living as a single unit (updated August 31, 2018).

This blog is of a general nature about financial discrimination of individuals/singles.  It is not intended to provide personal or financial advice.


CONTINUED FINANCIAL ILLITERACY OF FINANCIAL GURUS EQUALS FINANCIAL DISCRIMINATION OF SENIOR SINGLES (Part 2 of 2)

CONTINUED FINANCIAL ILLITERACY OF FINANCIAL GURUS EQUALS FINANCIAL DISCRIMINATION OF SENIOR SINGLES (Part 2 of 2)

(These thoughts are purely the blunt, no nonsense personal opinions of the author and are not intended to provide personal or financial advice.)

This blog post is a comment on the Broadbent Institute Report on the economic circumstances of Canadian seniors.  The Broadbent Institute is a left-leaning social democratic think tank founded by Ed Broadbent who was a past leader of the New Democratic Party .  It describes itself as an independent, non-partisan organization championing progressive change through the promotion of democracy, equality, and sustainability and the training of a new generation of leaders.  Its mission is to “Support, develop, and promote social democratic principles for the 21st century”, “Propose new solutions for a more equal society”, and “Equip a new generation of progressive campaigners & thinkers with the tools they need to build a social democratic society through training and education”.

This post addresses excerpts from the report first (Part 1), and then is followed by comments on the report (Part 2).

COMMENTS ON  REPORT – PART 2 OF 2

In February, 2016 the Broadbent Institute in Canada and Richard Shillington of Tristat Resources published the report:  “An Analysis of the Economic Circumstances of Canadian Seniors”.       (analysis_of_the_economic_circumstances_of_canadian_seniors)

The report information is mainly directed towards poverty of seniors without an employer pension plan (roughly 47 per cent) and therefore, many of these seniors have wholly inadequate retirement savings.

(It should be noted in the report that single seniors does not refer to marital status, but the fact that they live alone.  Therefore, single seniors includes ‘ever’-never married, no kids-singles, divorced/separated, and widowed seniors living alone).

Review of the report reveals some points that are very disconcerting.

  • The true facts of what it costs singles to live is under-reported.  Married/coupled persons and, indeed, the author of the Broadbent report do not seem to realize that the widowed (married/coupled persons whose spouses are deceased) are a part of the singles population.  It is a well known fact that it costs singles approximately 70 per cent of what it costs married/coupled persons to live as a single unit.  This fact is never addressed in the report. (Using LIM 11.1 percent of seniors live in poverty–719,000 seniors:  419,000 singles and 250,000 living in an economic family.  The poverty is astonishingly high at almost 30 per cent for senior singles without employer pension plans).  (Widowed persons and the extra benefits they get are discussed later in this post).
  • All the extra benefits that have been given to married/coupled persons are never addressed.  Governments continue to create financial silos where more and more benefits are given to married/coupled persons even though they are able to live with less because of economies of scale, but not to singles resulting in financial inequality.  (Following table was updated on March 8, 2016 with additional information).

financial silos6

  • It is ludicrous that this report does not treat home equity as a retirement asset.  Those who have to rent are at a much greater financial disadvantage than those who own their own home.  Quote from report : “ …..Many of those who argue that there is no looming pension crisis have included home equity as a liquid asset.  This analysis has not treated home equity as a retirement asset because the replacement rate analysis has as its objective an income that allows one to enjoy a lifestyle comparable to that which existed pre-retirement.  We do not include home equity here because we accept that the pre-retirement lifestyle for many middle- and moderate-income Canadians include continued homeownership”, (Page 19).

According to Statistics Canada 2011 articles “Living Arrangements of Seniors” and “Homeownership and Shelter Costs in Canada”:      (statcan.gc.ca) and (statcan)

  • The average household total income for couple-family households was about twice that of non-family households (which were primarily one-person households) and lone-parent households ($101,000 per year versus $43,000 per year and $55,000 per year respectively).  Thus, while lone-parent households and non-family households had a lower cost than couple-family households, the lower household total income results in a higher proportion exceeding the affordability threshold”.
  • Approximately 69 per cent of Canadians own their own home.  About  four out of five (82.4%) married/coupled people own their own home, while less than half (48.5%) of non-family households (singles) own their dwellings.  Just over half (55.6%) of lone-parent households own their dwelling.  (It stands to reason that more senior married/coupled and widowed persons will own their own homes, while senior singles–‘ever’ single and early divorced)–are more likely to have to rent placing them in greater income inequality and a lower standard of living and quality of life). Regardless of housing tenure, the proportion of non-family households and lone-parent households that paid 30% or more of total income towards shelter costs was about twice the proportion of the couple-family households.
  • Quote “approximately 56.4 per cent of the senior population (5 million total seniors in 2011) live as part of a couple and about 24.6 per cent of the senior population live alone (excludes those living with someone else, in senior citizen facilities and collective housing).

Singles are constantly told to ‘go live with someone’ when they have difficulties paying for housing; meanwhile married/coupled and widowed persons may be living in their big houses (enjoying the same lifestyle they had before pre-retirement) and seeking help with paying their taxes while refusing to move to a less expensive dwelling.  (senior-singles-pay-more-part-3-of-4)

  • It is ludicrous for this report to state that seventy per cent  income replacement should be a benchmark in the formulas.  Seventy per cent income replacement is entirely different for those who own their own home versus those who rent.  It is selfish to think that the rich and married/coupled persons should be able to live same lifestyle post-retirement as pre-retirement when singles and early divorced generally will have a poorer lifestyle throughout their entire lives.

An example is the Financial Post financial evaluation “Bright Future Despite Big Debt, Small Income” published in Calgary Herald on February 20, 2016 where Ontario young couple’s after tax income is $4,800 per month and their food budget is $800 and entertainment $160 per month for two people.  Just these two items are 20 per cent of their budget.  Either they live in an area with very high food costs or they are living the high life for one of the necessities of life in Maslow’s Hierarchy of need.  Seventy per cent replacement at retirement would give this couple an unreasonably high style of life for food in comparison to singles.   Reader letter mentioned above in ‘senior-singles-pay-more-part 3-of-4’ link suggested singles should be able to live on just $200 per month for food.

  • It is ludicrous to suggest that persons without employer pension plans cannot save, especially those with incomes over $100,000.

Quote from report:  “For those with incomes in $50,000-$100,000 range, the median value (savings) is only $21,000” (Page 3).

If those with pension plans have forced saving, it it is ridiculous to say that those without pension plans are not able to save.  For example, a $75,000 before-tax income may result in $600-$700 per month being deducted from pay cheque (employer deductions are excluded in this discussion).   It is also ridiculous to say that in this First World country persons with $100,000 plus incomes cannot save.  One of the principles of good finances is to save 10 per cent.  Whole report promotes greed of looking for more benefits and not planning for the future if there is no plan for saving during working years.

  • Reporting false information on marital status is a crime.  Quote from report states:  “Table 7 represents the results of increasing the single and married GIS amounts by the same percentage.  One should keep in mind that there is an incentive for seniors to appear as singles to governments even if they are living as a couple.  This is because the GIS for senior couples is less than twice the amount for singles.  An increase in the GIS for singles only (with no increase for couples) would increase this so-called ‘tax on marriage’ and associated incentives.  This would encourage couples to hide their cohabitation from the authorities for financial reasons”, (Page 21).

GIS for senior couples should, repeat, should be less than twice the amount for singles.  Singles (particularly ‘ever’ and early divorced singles including the author of this blog) have worked very hard to have financial formulas include singles at 70 per cent of married/coupled persons living as a single unit.  The GIS for senior singles is more than married/coupled persons because it costs more for singles (including widowed persons)  to live than it does for married/coupled persons living as a single unit.  Why can’t married/coupled persons understand this?  When married/widowed persons become widowed their living costs will go up.

The statement  “An increase in the GIS for singles only (with no increase for couples) would increase this so-called ‘tax on marriage’ and associated incentives. This would encourage couples to hide their cohabitation from the authorities for financial reasons” is absurd and selfish.  Tax on marriage, why can’t married/coupled persons realize all the extra benefits they receive as outlined in table above???  When is ‘enough’ ever going to be ‘enough’ for them???

The notation (# 28) at the bottom of page 21 states:  “While legislation treats those cohabiting the same regardless of their marital status, it is easier to deceive the government if you are not married”.  This statement is false and backwards.  If it is anyone being deceitful, it is the married/coupled persons.  Can someone explain why it would be easier to deceive the government if you are not married (‘ever’ single)?  The issue with false reporting lies with those who are married/coupled, divorced or separated.  They are trying to ‘milk’ the system by falsely reporting their marital status even though the Canada Revenue income tax rules clearly define the parameters of marital status.

False reporting is a crime.  It would be very easy to track deceit by following income tax declaration of marital status and address of residence over several years.  Deceit of married/coupled persons would incrementally increase the monetary value they would receive from the deceit as it costs them less to live as a couple than it does single persons.

It seems married/coupled persons want it all even if they have to lie about it.  So what will they do when their spouse goes to a nursing home or is deceased?  In order to collect the benefits they are entitled to as one spouse living at home and the the other in a nursing home and widowers, they will need to lie again and change their marital status from single to married/coupled or widowed when filing their income taxes.

‘Ever’ singles (never married, no kids) throughout their entire working lives pay same amount of taxes as each individual (with equal income to the single person) reporting income tax in a married/coupled relationship and have supported/subsidized families who use mom/baby hospital care, EI benefits for maternal/paternal leaves, etc.  They are never recognized for their tax support and for using less resources than families.  Since singles have paid supportive taxes throughout their entire working lives, they deserve to live with the same financial dignity and respect as seniors and as married/coupled persons.  As seniors, ‘ever’ singles deserve to have their own space and their own bathroom and not be forced to cohabitate with other persons.

The real financial lives of singles is revealed when a simple math calculation is used for the targeted tax relief where a single senior can now earn $20,360 and a senior couple $40,720 before paying federal income tax.  This so called tax relief for seniors allows federal tax relief for singles equal to $1,697 per month and for senior couples $3,393 per month.  The tax relief for senior singles hardly covers a rent or mortgage payment of $1,200 and $250 for food per month (Maslow’s Hierarchy of Need), but amply covers this amount for a senior couple.  For a couple $1200 for rent or mortgage and $500 for food leaves $1693 (or 50% of $40,000) for other necessities and maybe even a nice little vacation all tax free.

CONCLUSION

It is incredible how in just a few paragraphs a think-tank can undo the hard work that singles have been trying to achieve in seeking financial equality.  Think-tanks and financial gurus continue to practice financial illiteracy on what it truly costs singles to live.   (false-assumptions-four-ways-seniors-singles-lose outand (financial-gurus-financially-illiterate-about-singles-finances)

Even though the final statement of the report states:  The GIS is the most effective federal mechanism in the short term for reducing the poverty rate and the impact of poverty on seniors, and it can be targeted at senior singles who need it the most”, there are many shortcomings to this report.

This report is encouraging irresponsible financial behavior.  It is morally, ethically and socially reprehensible in a First world country to say that one cannot save with an income over $100,000 and to promote financial inequality and discrimination of singles.

The Broadbent Institute is supposed to be about ‘a more equal society’, so where is the financial equality?

SOLUTIONS

In order to ensure financial equality between singles (including widowers) and married/coupled persons the following measures need to be taken:

    • change financial formulas so that senior singles receive 70 per cent of whatever is given to married/coupled senior persons as it costs more for singles to live than it does married/coupled persons because of economies of scale
    • financial formulas should be revised to include all senior persons regardless of marital status in one financial formula.  To eliminate financial silos that benefit married/coupled persons most, delete benefits already given to married/coupled persons such as pension splitting (benefits the rich most) so that there is a level financial playing field for all regardless of marital status. (It is understood that it is expensive to raise children and  benefits given for children should last for first twenty years of the life of the child.  However, beyond the twenty years of the children, any other benefits given to married/coupled persons should be deleted or should also be given equally to singles at rate of 70 per cent)
    • create a side-by-side list of all possible benefits under categories of married/coupled, widowed and single and analyze the total value of benefits in each category (see table above).  Financial formulas should be created equally for all categories, not just the married/coupled and widowed.
    • delete allowance benefit that has been ruled to be discriminatory by the courts
    • education, education and more education on financial literacy for singles.  Think tanks, financial gurus and married/coupled people need to educate themselves on what it really costs singles to live.

(These thoughts are purely the blunt, no nonsense personal opinions of the author and are not intended to provide personal or financial advice.)


CONTINUED FINANCIAL ILLITERACY OF FINANCIAL GURUS EQUALS FINANCIAL DISCRIMINATION OF SENIOR SINGLES (Part 1 of 2)

CONTINUED FINANCIAL ILLITERACY OF FINANCIAL GURUS EQUALS FINANCIAL DISCRIMINATION OF SENIOR SINGLES (Part 1 of 2)

(This blog is of a general nature about financial discrimination of individuals/singles.  It is not intended to provide personal or financial advice.)

In February, 2016 the Broadbent Institute and Richard Shillington of Tristat Resources in Canada has published the report:  “An Analysis of the Economic Circumstances of Canadian Seniors” http://goo.gl/HNP2Ee

The report information is mainly directed towards poverty of seniors without an employer pension plan (roughly 47 per cent) and therefore, many of these seniors have wholly inadequate retirement savings.

Using LIM (low-income measure) senior poverty has increased from a low of 3.9 per cent in 1995 to 11.1 per, or one in nine, in 2013.  The poverty rates for single seniors, particularly women (at nearly 30 per cent), are very high and need to be addressed, (Page 2).   (LICO, or Low Income Cut Off, is not used here because it is not a true income poverty indicator as it was set in 1992 where families spend 20 per cent more of their income on necessities than was typical and has not been reset since.)

(It should be noted in the report that single seniors does not refer to marital status, but the fact that they live alone.  Therefore, single seniors includes ‘ever’ singles, divorced/separated, and widowed seniors living alone.)

In Canada, the income-tested OAS (Old Age Security) and GIS (Guaranteed Income Supplement) benefits together provide a regular minimum economic guarantee and are used to supplement regular income (from CPP-Canadian Pension Plan, private pensions and private savings) to lift seniors out of poverty.

Some of  the key findings of the report include:

  • The proportion of the population receiving the GIS is higher for senior singles than couples, and higher for single women (between 44 per cent and 48 per cent) than for single men (between 31 percent and 37 per cent), (Page 3).
  • ‘Roughly half of those aged 55-64 with no employer pension  benefits….. have savings that represent less than one year’s worth of the resources they need to supplement OAS/GIS and CPP.  Fewer than 20 per cent have enough savings to support the supplemented resources required for at least five years, (Page 3)…..For those with incomes in $50,000-$100,000 range, the median value is only $21,000…..(Page 3).
  • The overall median value of retirement assets of those aged 55-64 with no accrued pension benefits is just over $3,000.  For those with annual incomes in the range of $25,000-$50,000. the median value is just over $250.  For those with incomes in the $50,000-$100,000 range, the median value is only $21,000, (Page 3).
  • Only a small minority (roughly 15-20 per cent) of middle-income Canadians retiring without an employee pension plan have saved….enough for retirement.  The vast majority of those families with annual incomes of $50,000 and more will be hard pressed to save enough in their remaining period to retirement (less than 10 years)…..(Page 3).
  • The seniors’ poverty gap is $2.5 billion in aggregate annually, due to the 719,000 poor seniors (469,000 singles and 250,000 living in an economic family.)  A 10 per cent benefit increase in the GIS to address this gap would cost $1,628 million, and would reduce the number of poor seniors (married/coupled and singles) by about 149,000, (Page 3).
  • In the recent election, the Federal Liberal Party promised to increase the GIS by 10 per cent for single seniors.  (NOTE:  this does not include coupled seniors).  A simulation using Statistics Canada’s Social Policy Simulation Database and Model (SPSD/M) suggests this would cost $700 million and remove about 85,000 single seniors from the poverty roles, with a reduction in the singles poverty rate of 5.7 percentage points, (Page 3).  (Singles poverty rate of 5.7 percentage points from approximately  28 per cent for senior single females, and 24 per cent for senior single males, that’s all???)

Factors Affecting Seniors Poverty

As of July 2015, the income-tested maximum annual OAS/GIS benefits for seniors aged 65 and over with no other source of income were $15,970 for singles and $25,746 for couples…..The GIS is phased out as income rises and is reduced to zero above an annual income (thus calculated) of $17,136 for single seniors and $22,068 for senior couples, (Page 9).

Reliance on the GIS is greater for single seniors than it is for senior couples across all age ranges…..  For example, 41 per cent of all seniors over 85 receive the GIS, while only 30 per cent of seniors aged 66-69 receive it. (Page 9).

Pension Coverage (Page 12)

The difference in incomes at retirement between those seniors with and without a pension income is stark…..The difference is not all due simply to the presence or absence of an employer pension plan.  Those who have had an employer pension plan are more likely to have had better paying jobs, and jobs with health and other benefits.  As well, it is possible for those who seek out jobs with a pension are more likely to be those motivated to save for retirement.  But certainly, participating in a pension offers advantages that make it easier to have a higher income at retirement, (Page 12).

For couples, those without pension income have significantly lower total incomes ($52,000) to compared to those with pension income ($68,000).  This is despite their higher income from earnings ($19,100 for those without pension income, compared to $7,200 for those with pension income).

For individuals, the story is very different:  They are more likely than couples to be over the age of 70, and much less likely to be employed.  For single women, the median incomes are $18,000 for those without a pension and $30,400 for those with a pension  For men, the medians are $19,000 and $37,300, respectively.  These gaps are significant, (Page 12).

LIM (Low Income Measure) is used in this report and is based on after-tax income to assess poverty of seniors.  This measure shows what proportion of persons have after-tax incomes that are less than half of the median or midpoint to comparable families.

Two criterion to assess adequacy of income at retirement are:  1)  poverty criterion, and 2) replacement rate concept, (Page 13).

Generally,  the median incomes for those without pension income is just over half for those with pension income, (Page 13).

The report goes on “to suggest that a significant proportion of those without an employer pension plan will not have saved adequately for retirement and will suffer a major loss of income”.

Retirement savings without employer pension (Page 14-16)

Report states that from Survey of Financial Security for 2012 about half of families (what is the definition of family here?) aged 55-64 without an employer pension have virtually no savings; indeed 78 per of them have less than $100,000 in retirement savings.  Lower-income families eligible for OAS/GIS along with CPP may still have little or no drop in income, however inadequate that income might be, (Page 14).

….Vast majority of these families with annual incomes of $50,000 and more will be hard pressed to save enough in their remaining period of retirement (less than 10 years) to avoid a significant fall in income.  It appears that at least 25 per cent have very limited retirement assets despite incomes of $50,000-$200,000, (Page 15).

The report does state that ‘analysis presented in tables is somewhat simplistic because it ignores the impact of public benefits (OAS/GIS and CPP) on the amount that future seniors need to save.  It is also accepted that many seniors need less income in retirement in order to maintain the standard of living that they had pre-retirement.  The actual replacement rate required-the ratio of post-retirement to pre-retirement income-varies by how it is measured (pre- or post-tax).  Seventy per cent is commonly used, although it varies by individual circumstances and tastes; higher values are more appropriate for the poor, and lower values are more appropriate for the very wealthy’, (Page 15-16).

Retirement savings compared to income (Page 16-20)

Tables show widespread under-saving using calculations of 70 per cent pre-tax replacement rate…

Some do not need to save for retirement to get 70 per cent replacement because their income is quite low (below $21,429 for singles and $35,714 for couples).  These individuals and couples were deleted from table 5…..,(Page 16).

To illustrate, a family with an income of $100,000 (pre-tax) is assumed to need $70,000 (70 per cent of $100,000), and will get roughly $25,000 in public support.  Thus, they will need to make up $45,000 per year from their private savings, (Page 16).

Even those with an income of more than $100,000 are unlikely to have more than five years worth of the required supplemental income in their retirement savings; only 21 per cent meet this criterion……(Page 17).

In summary, regardless of income, few of these families have enough savings to supplement their income for even one year.  Only 15-20 per cent have enough for five or more years. (Page 17).

…..Many of those who argue that there is no looming pension crisis have included home equity as a liquid asset.  This analysis has not treated home equity as a retirement asset because the replacement rate analysis has as its objective an income that allows one to enjoy a lifestyle comparable to that which existed pre-retirement.  We do not include home equity here because we accept that the pre-retirement lifestyle for many middle- and moderate-income Canadians include continued homeownership, (Page 19).

One Option:  Reducing seniors poverty with GIS

The report then makes suggestions for decreasing poverty rate. One option is reducing seniors poverty with short term changes to GIS.  One of the paragraphs is as follows:

Table 6 presents estimates of the poverty gap using Statistics Canada’s SPSD/M microsimulation model. The poverty gap is the total amount of money that would be needed to raise the incomes of all poor seniors to the LIM poverty line-ignoring any  behavioral impacts of the transfer programs used to achieve that goal…..The poverty gap is $2.5 billion in aggregate, which is due to the 719,000 seniors:  419,000 singles and 250,000 living in an economic family.  The average gap is $2,400 for singles and $5,500 for seniors in a family, (Page 20-21).

Table 7 represents the results of increasing the single and married GIS amounts by the same percentage.  One should keep in mind that there is an incentive for seniors to appear as singles to governments even if they are living as a couple.  This is because the GIS for senior couples is less than twice the amount for singles.  An increase in the GIS for singles only (with no increase for couples) would increase this so-called ‘tax on marriage’ and associated incentives.  This would encourage couples to hide their cohabitation from the authorities for financial reasons, (Page 21).

The notation (# 28) at the bottom of page 21 states:  While legislation treats those cohabiting the same regardless of their marital status, it is easier to deceive the government if you are not married.  (Really???  How is this so when single status needs to reported on income tax returns; lying about marital status is a felony?).

Taking one example (from Table 7) of the tabulated results, a 10.0 increase is estimated to increase the cost of the GIS by $1,628 million to yield a poverty rate of 10.5 per cent and to reduce the number of poor seniors by about 149,000, (Page 22).

The (Federal) Liberal Party’s proposal in the recent election was to increase the GIS by 10 per cent for single seniors.  The SPSD/M simulation suggests that this would cost $700 million and remove about 85,000 single seniors from poverty, with a reduction in the singles poverty rate of 5.7 percentage points.  While a reasonable starting point, clearly much more can be done to reduce the poverty rate, (Page 22).

Conclusions

Poverty rates for seniors have been trending up since 1995.  Rates remain unacceptably high for single seniors-particularly women-and the worsening trends in pension coverage point to further increases in poverty in the future.  The GIS is the most effective federal mechanism in the short term for reducing the poverty rate and the impact of poverty on seniors, and it can be targeted at senior singles who need it the most, (Page 23).

(This blog is of a general nature about financial discrimination of individuals/singles.  It is not intended to provide personal or financial advice.)


FAMILY: INCLUSIONARY OR EXCLUSIONARY TERM AND FINANCIAL DISCRIMINATION

FAMILY:  INCLUSIONARY OR EXCLUSIONARY TERM AND FINANCIAL DISCRIMINATION

(These thoughts are purely the blunt, no nonsense personal opinions of the author and are not intended to provide personal or financial advice.)

Today, February 15, is designated Family Day in Canada and was originally created to give people time to spend with their families, but also provides a day off between New Year’s Day and Good Friday as they are approximately three months apart.

The word ‘family’  can have many different meanings.  One definition is “a fundamental social group in society typically consisting of one or two parents and their children.” While this definition is a traditional definition, there are other family units excluded by this definition, such as couples without children or other variations on the family unit. Another definition is “two or more people who share goals and values, have long-term commitments to one another and reside usually in the same dwelling.”  In addition to a more universal family definition, there are many who consider a group of friends to be family, and adults who consider pets also to be members of the family unit.

The Statistics Canada definition of ‘family’ indicates there must be two persons legally living together to be defined as a family.  When census information is collated, the population is called:  “Census families and persons not in census families”.  Singles are included in the “persons not in census family” category.

For Canada Revenue Agency income tax purposes, singles are persons who have never married or whose marriage has been legally annulled.  (Those who  live with a common-law partner are not included in this category).

The word ‘family’ can be inclusionary or exclusionary depending on the closeness (or distance) of the relationship of the persons in the family unit.

It is interesting to note that present political discussions both in Canada and the USA talk about the financial decline of the ‘middle class family”.  Singles and low income are left out the discussion.  Many benefits have been given to the married/coupled persons and family units with children, but singles are generally left out of the benefits or receive less in benefits.

An example of financial discrimination in Canada is the targeted tax relief for seniors where senior singles pay no tax on $20,000 and married/coupled seniors pay no tax on $40,000.  For single seniors this amounts to only $1,700 per month, but for married/coupled seniors this amounts to approximately $3,400 per month.  Living costs are inadequately covered for singles, but are more adequately covered for married/coupled seniors.  It is a well known fact that singles require approximately 70% of living costs for married/coupled persons living together as a family unit.

The mentality of government, decision makers, businesses and families in this country is to serve only the rich and middle class families while generally ignoring singles, low income and no income individuals and families.   Families will often talk about how important the family unit is for them in regards to maintaining close ties to friends and families.  They talk about about how their ‘hearts are eternally and inexplicably changed’ when bearing their children, but same hearts appear to become ‘hearts of stone’ when these same children become adult singles, low income or no income persons and families.  These disadvantaged persons are tossed out or are less important in financial  formulas and decision-making processes.

CONCLUSION

The definition of family as to whether it is inclusionary or exclusionary is in ‘the eye of the beholder’ and depends on which ‘side of the fence’ is beholder is on.   An exclusionary example is the one given above on targeted tax relief.  The financial ‘family’ by devaluing singles and low income takes on a ‘Dr. Jekyll and Mr. Hyde’ persona, or also could be said to take on an ‘about-face’ persona or doing the exact opposite where the greed of business and personal gain takes on more importance than treasured family values.

Financial fairness of singles, low income and disadvantaged would be better served if they were financially treated as equal family members instead of being financially categorized as ‘worth less’ or ‘worthless’ to the rich and married/coupled persons in financial formulas. This would give more truth to why Family Day is celebrated on this day of February 15.

This blog is of a general nature about financial discrimination of individuals/singles.  It is not intended to provide personal or financial advice.