POLITICAL STATEMENTS AGAINST THE NDP PARTY ARE BLATANTLY FALSE AND FINANCIALLY DISCRIMINATORY

POLITICAL STATEMENTS AGAINST THE NDP PARTY ARE BLATANTLY FALSE AND FINANCIALLY DISCRIMINATORY

(These thoughts are purely the blunt, no nonsense personal opinions of the author about financial fairness and discrimination and are not intended to provide personal or financial advice).

A recent opinion letter in a local newspaper prompted this blog post.  The letter again targets the Alberta NDP party for socialism of the rich instead of the Conservative party.  “Westhead must be too busy to read history books” (since) he states: ‘Albertans do want to return to the past; but not to this misfit ideological premise about socialism for the rich and austerity for everyone else that the NDP conjured.  While Mr. Westhead mistakenly believes there was socialism for the rich in Conservative Alberta, his solution is a failing socialist ideology for all.  Your government has downloaded a debt, taxes and policies that are a burden to families….voting Conservatives in again in 2019 – Alberta will return to the free enterprise, socially reliable province it once was”. He is referring to many Harper oil pipelines (good) and NDP carbon tax (bad).

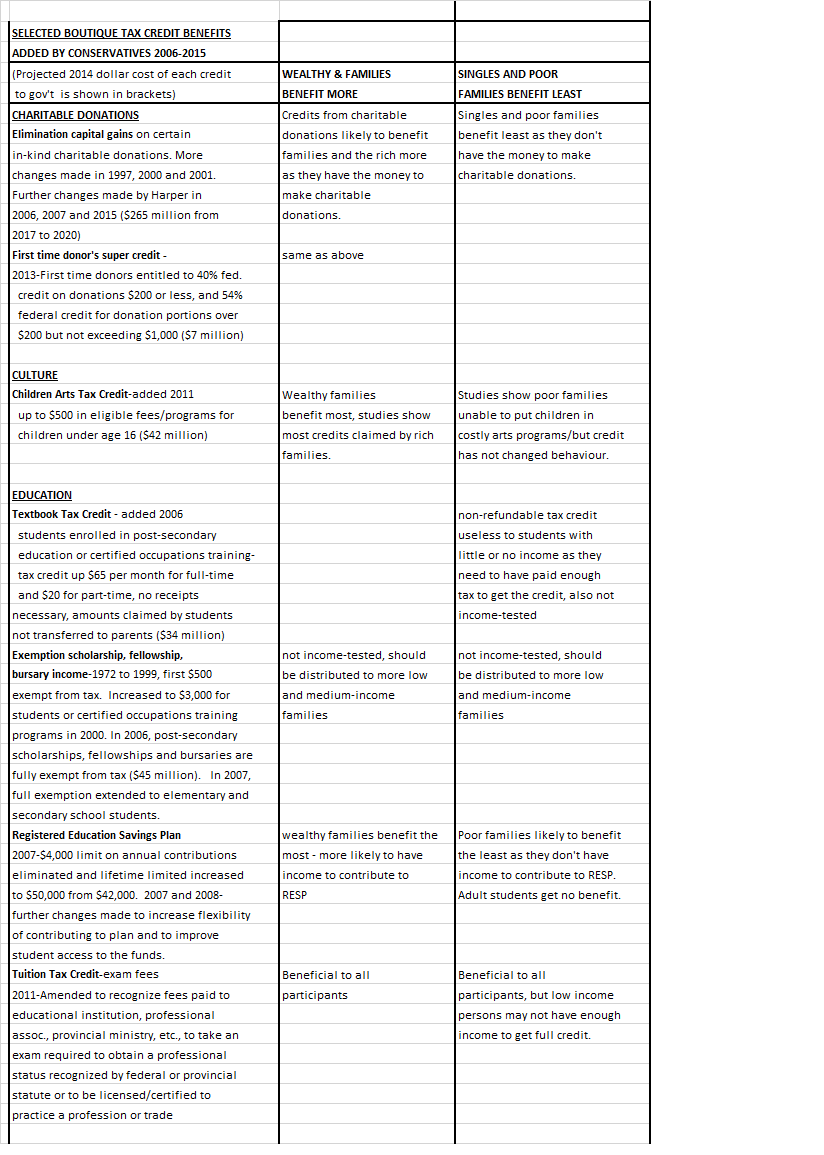
Re statements on socialism and left-wing politicians, analysis shows federal and provincial Conservative and Liberal policies surreptitiously and purposefully eliminate the middle class, thus practising selective social democracy (socialism).  Advertently or inadvertently, future class system will consist mainly of the poor, upper-middle class and wealthy while favouring married or coupled family units with multiple ‘marital manna benefits’.

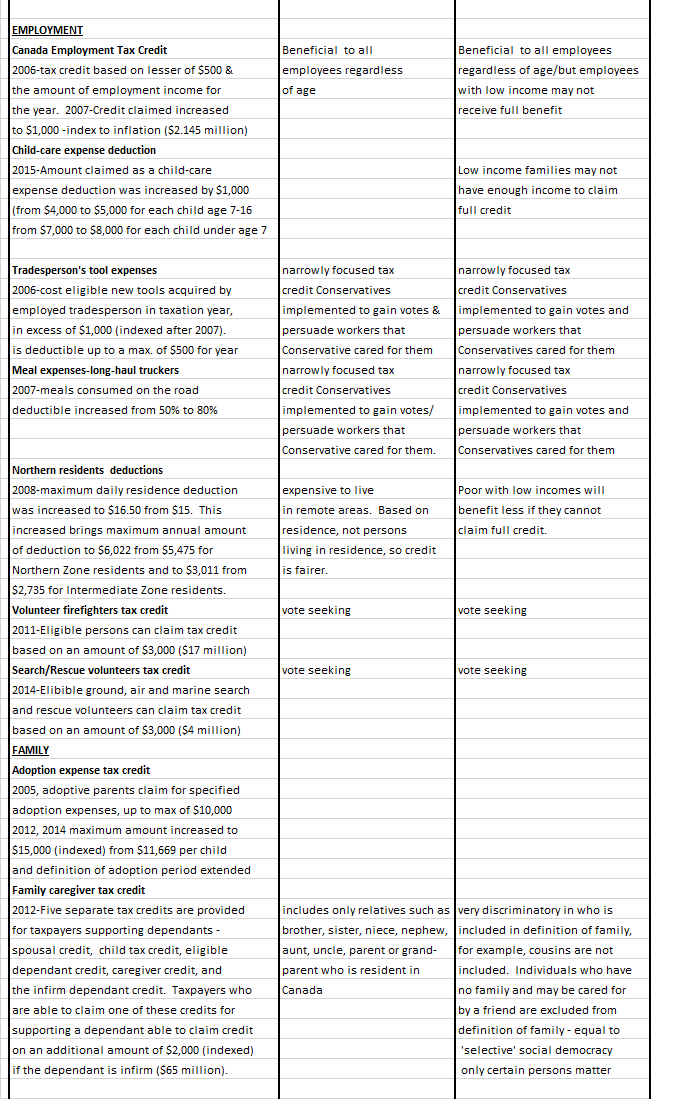
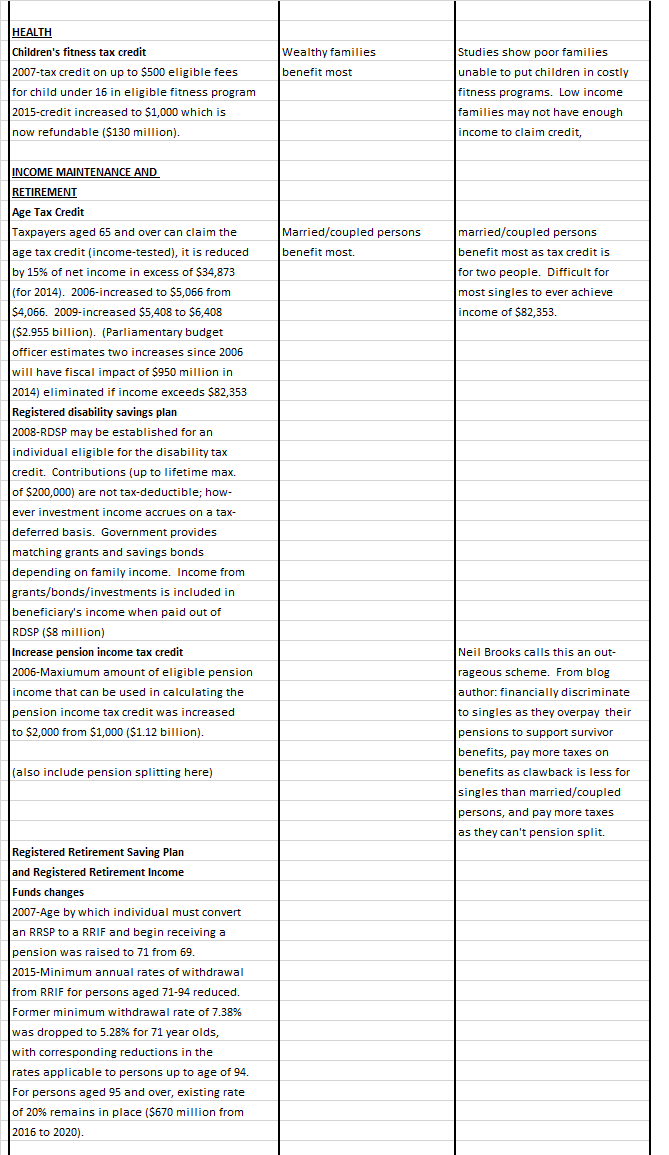
During federal Conservative and Liberal party reigns, even while reducing social programs helping vulnerable populations of aboriginals and veterans, introduced programs like TFSAs (Harper 2009) pension splitting (Harper 2007) and OAS clawback (Harper 2011) particularly benefit the wealthy and married or coupled family units.  In OAS clawback only about five percent of seniors receive reduced OAS pensions, and only two percent lose entire amount.  Why should married or family units who have never had children (double income, possible double TFSA and RRSP) be able to ever use pension splitting, no OAS clawback plus tax avoidance schemes for couples while singles get nothing comparable?

During provincial Conservative party forty year reign and oil boom, just 1,048 new affordable housing units in Calgary were built over the past 14 years.  Two thirds of shelter beds in Canada are filled by people who make relatively infrequent use of shelters and are more likely forced into shelters by economic conditions (due to structural factors, the state of housing and labour markets that destine the very poor to be unable to afford even minimum-quality housing).  In 2001, Alberta Conservatives brought in 10% flat tax, raising the tax rate from 8% to 10% for lowest income Albertans.  There never has been an Alberta Advantage for the poor.

Federal Liberals have continued Conservative benefit programs like Canada Child Benefit in perpetuity which is based on income and number of children, but not net worth and assets, so families may receive large tax free child benefits and continue increasing wealth even while already having huge assets.

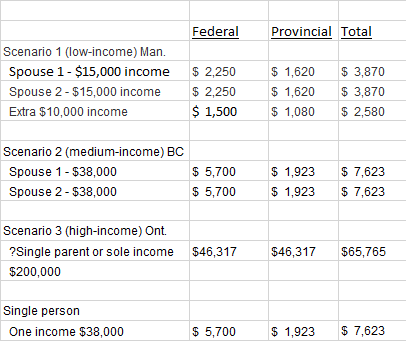
Elimination of the middle class is also evident in Liberals’ proposed Canada Pension plan enhancements without an increase in minimum wage (canada-pension-plan).  Persons with highest YMPE of $82,700 (massive jump from 2016 $54,900) and forty years of contributions may receive 33 percent CPP benefit or about $2,300 per month, while those making a minimum wage of $15 per hour, $30,000 annual income with forty years of contributions may receive about $800 per month. CPP pensions are dependent on salaries.  CPP contributions are not collected on boutique tax credits.  Low salary equals low CPP retirement pensions.

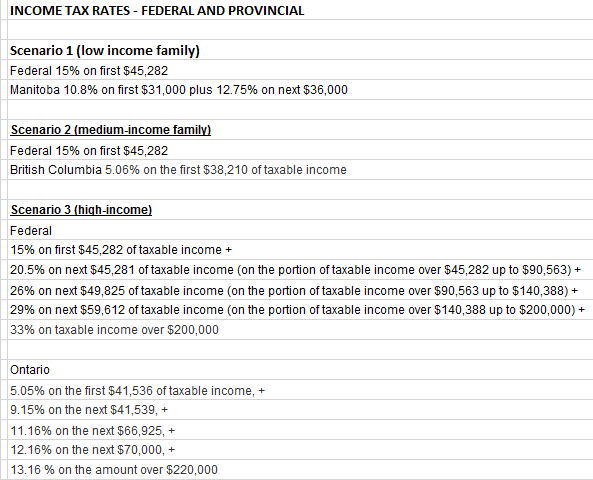
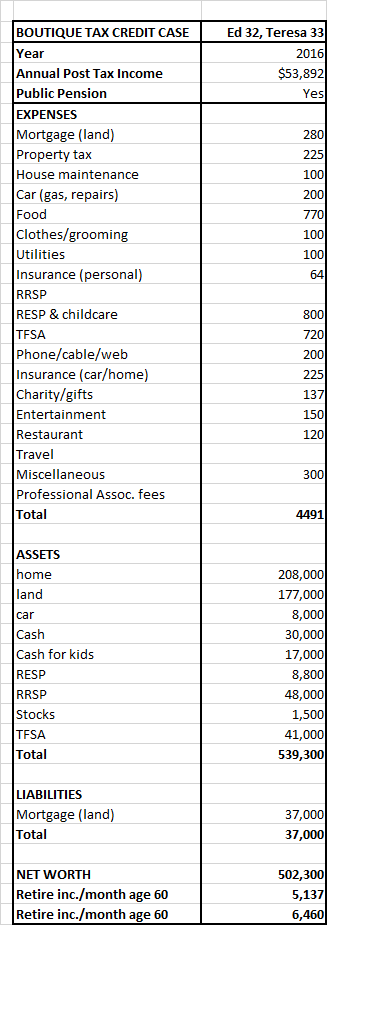
Calculations of a simplistic nature on $10 minimum wage and 2,000 hours shows that Alberta family with two children and each spouse earning $20,000 without any other deductions or benefits will pay about 15% Federal tax and 10% AB tax for a total of $5,000 each and receive full Canada Child Benefits (CCB) of $12,800.  Family income will equal about $42,800.  CPP pension at age 65 in 2016 dollars may equal about $5,000 per person annually.  If $15 minimum wage or $30,000 each  is applied, total Federal tax and AB tax will be $7,500 each.  Family income will equal $57,800 with full CCB $12,800 benefits since reductions only begin at $30,000.  CPP pension might equal about $7,500 per person.  

Above calculations easily show increased minimum wage income for a poor family benefits everyone through collection of increased taxes, less dependency on government handouts, greater financial well being and CPP retirement benefits for the income earner, and the economy through increased spending on goods and services.

Schizophrenic political systems exist where CPP pension enhancements are controlled federally, but minimum wages are controlled provincially.  The continued unwillingness of government and business to promote minimum wage increases to indexed living wages means the poor will remain in poverty even with pension systems that are supposed to improve financial quality of life as seniors.  The new NDP childcare program is the right thing to do, but it should be balanced by reductions of other boutique credits.  However, this is impossible, again because of provincial versus federal control.  Continuing to add monetary programs for select family groups will continue to drain the financial system if boutique tax credit programs and tax avoidance schemes where upper-middle class and wealthy benefit the most are not eliminated in their entirety.  Net worth and assets need to be included in any financial program so that the poor and lower class benefit the most from these programs.

The effects of this ‘income redistribution’ and ‘culture of dependency’ that the right claims they are not guilty of will result in future generations being ridden with high taxes because of high debt level to service these programs.  Where are the economists and financial advisors for the government so that outside the box solutions for financial equality of Canadians regardless of marital  status and using a balanced approach so that all financial programs are reviewed against each other for financial validity and fairness?  Canadians deserve much better financially from their political parties.

Upside-down financial systems and marital manna benefits have created a nanny state where families want it all and once these benefits are in place, it is very difficult to eliminate them because of voter entitlement.  Upper middle class and wealthy married/coupled persons have been made irresponsible by their own politicians and government.  The right keep talking about overspending, but they fail to mention that their boutique tax credits have resulted in upper-middle class and wealthy not paying their fair share of taxes.

Financial silos (tax-credit) are filled to the brim for families and married persons, but remain empty for singles and the poor.  Pipelines and boutique tax credits without steady rise of minimum wage and greedy oil salaries without tax avoidance capabilities means less tax revenue to fill financial coffers, less food on the table and demeaningly low CPP pensions in retirement for the poor.  Every political party has been guilty of vote getting tactics.  Canadians are fed up and disheartened by the divisive nature of politics which seems to serve only the political parties and their wealthy constituents.

(This post was updated on November 30, 2016).

(This blog is of a general nature about financial discrimination of individuals/singles.  It is not intended to provide personal or financial advice).

DOING THE MATH ON FAMILY TAX CREDITS SHOW FINANCIAL DISCRIMINATION OF POOR, LOWER MIDDLE CLASS FAMILIES AND SINGLES-Part 2 of 2

DOING THE MATH ON FAMILY TAX CREDITS SHOW FINANCIAL DISCRIMINATION OF POOR, LOWER MIDDLE CLASS FAMILIES AND SINGLES-Part 2 of 2

(These thoughts are purely the blunt, no nonsense personal opinions of the author about financial fairness and discrimination and are not intended to provide personal or financial advice.)

Part 2 of 2 of ‘Doing the math…’ provides further discussion on the comments of the financial analysts in Part 1 of 2.  Regarding the Canada Child Benefit, it is difficult once again to understand the financial intelligence of politicians and government and whom they consult when formulating their policies.

Repeated again from part 1 of 2 are the following scenarios from “Doing the child benefit math” by Jamie Golombek (financialpost), Financial Post, September 30, 2016 showing financial evaluation performed by Jay Goodis from Tax Templates Inc.  This evaluation shows the impact of CCB on various levels of income in 2016, the after-tax cash they would keep along with their effective tax rates.

‘Scenario 1 – Low-income family

A Manitoba family has two kids under five and two working parents, each earning $15,000 of employment income. They are eligible for the entire CCB of $12,800; after paying CPP, EI, and a bit of tax, they net $39,560 of cash.

What would happen if one parent was able to work more, or was to get a higher paying job, such that she now made $25,000 — an increase of $10,000?  While she’s still in the lowest federal and Manitoba tax brackets, once you factor in the loss of CCB, the additional tax, CPP, and EI, her take-home extra cash is only $5,563, resulting in an effective marginal tax rate of a whopping 44 per cent (39 per cent if you ignore the additional CPP and EI contributions.)

As Goodis observed: “The CCB skews the progressive tax system and imposes a high effective tax on low income earners with children.”

Scenario 2 – Median-income family

A British Columbia couple has two children under the age of five. Their family’s income, consisting solely of employment income, is $76,000 split equally between each spouse. Their $12,800 of CCB is reduced to $7,448; and after federal and provincial taxes, CPP, and EI, the family nets $69,135 of cash. In other words, even with the clawback of some of their CCB, the couple has kept 91 per cent of their earned income.

Scenario 3 – High-income earner

Finally, consider an Ontario professional with three kids, two under five and one teen, earning $200,000 annually.  His CCB will be about $750 for the year.  If he were to earn an extra $1,000 of income, he would keep only just under $400 of it, resulting in an effective marginal tax rate of just over 60 per cent once loss of CCB is taken into account.’

DISCUSSION

Several points of interest will be discussed in regards to the Canada Child Benefit:  1)  income tax and marginal tax rates with increased income, 2)  CPP contributions and pensions, and 3) the effect of minimum wage and Canada Child benefit on the economy and future entitlements like the Canada Pension Plan (CPP).

NOTE:  The marginal tax rate is the tax rate paid on last dollar of income and rate likely to be paid on next dollar of income-it is usually more than what is actually paid in tax because basic exemptions like CPP contributions and EI, and other benefits on provincial level, GST rebate, etc. have not been taken into consideration.

  1. INCOME TAX RATES FEDERAL AND PROVINCIAL (cra)

The following shows the likely actual federal and provincial tax rates shown in the three scenarios (the federal and provincial rates used in the calculations are shown at the end of the post).

Taxes paid do not show other possible deductions taken off (CPP and EI), non refundable tax credits and additional benefits (GST rebate) added on to income:

income-tax-rate-scenario-1-to-3

In scenario 1 (low-income family), the financial analyst makes the statement that if one spouse earned an extra $10,000 she would pay an effective marginal  tax rate of a whopping 39 per cent factoring in the loss of the CCB and without additional CPP and EI contributions.  Her take-home extra cash is only $5,563.  However, with calculation of possible additional actual tax rate of $2,580, and reduction of $12,800 CCB by $896, her take home income with the additional $10,000 would be $10,000 minus $2,580 minus $896 for CCB for total extra cash of $6,524.  Whether it is an additional $5,500 or $6,500 why is this not considered to be a good thing, when even though she has more income tax deductions and small decrease in CCB, she has much more money to spend on her family while benefitting the Canadian economy through additional use of goods and services and additional income tax to be used for public services?

In scenario 2 (middle-income family), the financial analyst states that ‘ even with the clawback of some of their CCB, the couple has kept 91 per cent of their earned income’.  That is a very good rate of return all because of tax-free CCB.  Another reason why they are able to keep such a large per cent of their earned income is that Province of BC has a 5.06% tax rate on first $38,210 while Manitoba in Scenario 1 has a provincial rate of 10.8% on first $31,000.

In scenario 3 (high earner) the financial analyst states that with just an additional $1,000 income the person will only take home an extra $400 using the marginal tax rate.  For poor people, the reaction might be “so what?” when take home income is already at level of $8,000 to $10,000 per month plus he has been able to use Liberal reduced income rate of 1.5% for income between $44,401 to $89,401 that scenario 1 and 2 have not been able to use.

For single person, income after tax would be approximately $30,377 or about $15 per hour.  This does not equal living wages to prevent homelessness for singles, examples of which are usually greater than $15 per hour (singles-finances).

  1.  CPP CONTRIBUTIONS AND PENSIONS

In scenario 1 (low-income family) it has been estimated that this family will have about $7,500 annual CPP benefits.  With the addition of just $10,000 income (and YMPE), resulting extra CPP contributions and reduced $896 CCB annual benefits, the CPP (using 2016 rates) annual benefits will jump from about $7,500 to $10,000.  This should be viewed as a good thing as the extra CPP benefits outweigh the reduced CCB benefits and will reduce poverty in retirement.

  1.  THE EFFECT OF MINIMUM WAGE AND CANADA CHILD BENEFIT ON THE ECONOMY AND FUTURE ENTITLEMENTS LIKE CPP
  • The more poor are taken out of poverty, the greater the benefits to everyone because the poor will be using less government boutique tax credits and handouts (CCB).
  • Increased minimum wage benefits income earners in retirement years through increased CPP contributions during working years.
  • Increased minimum wage benefits everyone through collection of increased taxes, financial well being of income earner, and the economy through increased spending on goods and services, thereby, increasing value to the economy.
  • Boutique tax credits that benefit only certain segments of society (families and married or coupled persons) and failure to increase the minimum wage are financially discriminatory and detrimental to low income persons and singles.

CONCLUSION

Why do we continue to allow politicians and governments to make bad financial decisions like forever increasing boutique tax credits,  increasing the wealth of the rich and not increasing the minimum wage when it can clearly be shown that increasing the minimum wage benefits everyone?  The creation of financial silos (financial-illiteracy) where one financial decision is made (example:  CPP enhancements) without looking at how this impacts other financial processes makes for very bad financial decisions.  ‘Selective’ social democracy (selective) where some family groups benefit more than other family groups only produce financial discrimination while benefitting the upper-middle class and the wealthy most.

The upside down financial decisions where boutique tax credits are brought in by one political party, eliminated or changed on election of another political party and increasing CPP benefits, but not increasing the minimum wages at the same time does nothing to provide financial stability for Canadian families, married or coupled persons and singles.

Outside the box and critical thinking like tri-partisan (all political parties) cooperation in financial decisions for all Canadians would create better decision making across the board and prevent schizophrenic political processes like CPP increases being controlled by federal governments and minimum wage increases being controlled by provincial governments.  All Canadians deserve better from their politicians and governments in financial decision making.

INCOME TAX RATES by FEDERAL AND PROVINCE (cra)

income-tax-rates


(This blog is of a general nature about financial discrimination of individuals/singles.  It is not intended to provide personal or financial advice.)

CAUSE AND EFFECT OF FINANCIAL POLICIES PROMOTING FINANCIAL DISCRIMINATION OF SINGLES AND THE POOR

CAUSE AND EFFECT OF FINANCIAL POLICIES PROMOTING FINANCIAL DISCRIMINATION OF SINGLES AND THE POOR

(These thoughts are purely the blunt, no nonsense personal opinions of the author about financial fairness and discrimination and are not intended to provide personal or financial advice.)

This blog has attempted to describe some of the many government, politician, business and family financial policy decisions that lead to financial discrimination of singles and the poor.

The question that can be asked is:  “Is there a  cause and effect relationship to these decisions?”

From Wikipedia and other online sources (study) the definition of ‘cause and effect’ is follows: – Causality (also referred to as causation, or cause and effect) is the agency or efficacy that connects one process (the cause) with another process or state (the effect), where the first is understood to be partly responsible for the second, and the second is dependent on the first. In general, a process has many causes, which are said to be causal factors for it, and all lie in its past. An effect can in turn be a cause of many other effects.

A cause-effect relationship is a relationship in which one event (the cause) makes another event happen (the effect). One cause can have several effects. Cause-Effect Criteria – In order to establish a cause-effect relationship, three criteria must be met. The first criterion is that the cause has to occur before the effect. If the causes occurred before the effects, then the first criterion is met.  Second, whenever the cause happens, the effect must also occur.  Consequently, if the cause does not happen, then the effect must not take place. The strength of the cause also determines the strength of the effect when criterion two is met.  The final criterion is that there are no other factors that can explain the relationship between the cause and effect.

A cause is why something happens.  An effect is what happens.

While no scientific ‘cause and effect’ relationship (i.e. fishbone diagrams) has been applied in this blog, certainly many of the financial discriminatory effects of policy decisions (or causes) have been described.  Some of these effects are listed below.

Boutique tax credits

  • Every political party has introduced tax credits to give financial benefits to certain members of the population more than others. June 16/16 (credit)

Business policies

  • Financial decisions by businesses such as not wanting to have minimum wage increase and not wishing to pay proposed increase of CPP employer contributions continue to help disintegrate the financial well being of singles and the poor. Sept. 12/16 (canada-pension-plan)

CPP

  • Financial discrimination of the CPP plan.  Aug 31/16 (plan)

CPP enhancements

  • Financial discrimination of CPP enhancements includes higher income earners only paying 8 percent instead of 11 percent CPP contributions on earnings between $72,000 and $82,700. Sept 12/16 (canada-pension-plan)

Family tax credits

  • Marital manna and family tax credits given over the years have continually increased the financial discrimination of singles and the poor.  Many of these benefits have been implemented by the Federal Conservative government over the last decade and perpetuated by the Federal Liberal party since coming into power in 2015 as well as provincial parties.  Aug 2/16 (credits)

Housing Affordability

  • Just 1,048 new affordable housing units in Calgary have been built over the past 14 years; the need for affordable housing was great in 2002 and it remains so today (most of these years were under provincial forty year reign of the Conservative party). July 17/16 (housing)
  • Homelessness – Two thirds of shelter beds in Canada are filled by people who make relatively infrequent use of shelters and are more likely forced into shelters by economic conditions (due to structural factors, the state of housing and labour markets that destine the very poor to be unable to afford even minimum-quality housing)…attacking housing affordability from the other side, by reducing housing costs, would also be effective….vast majority of homeless shelter users are single. May 23, 2016 (homelessness) and July 17/16 (housing)

Housing Upside Down Pricing and Financing

  • Upside down pricing of housing where purchasers of smaller units pay more per square foot means they will proportionately pay more house taxes, education taxes, mortgage interest and real estate fees on less house and less take home pay. Nov. 19/15 (upside-down)

Income tax privileging for the middle class and the wealthy

  • Tax cuts on both federal and provincial levels have targeted the middle class and the wealthy while making poor pay same amount or more in taxes.
  • Alberta flat tax of 10 percent increased from 8 percent for low income. May 23/16 (homelessness
  • Federal tax by federal Liberal party decreased by 1.5% for those earning between $45,282 and $90,563. Aug. 23/16 (family)

Lost Dollar value

  • Lost dollar value list was created to show lost dollars experienced by singles because married or coupled persons are able to achieve more financial benefits.  Some of these include pension splitting, reward programs and Employment Insurance (EI). April 10/16 (value)

Marital manna benefits

  • 1% spousal lending rate, spousal RRSP, TFSAs times two with no cap on total amounts accumulated over years are all within legal limits of financial laws – Six Reasons….(six)

Marrying for money pays off

  • Study shows persons who marry and stay married accumulate nearly twice as much personal wealth as a person who is single or divorced.  Jan. 17/16 (pays)

Maternity and parental benefits

  • Studies have shown that middle class and wealthy families benefit more from maternity and parental benefits.  Many poor families cannot afford take full maternity and parental leave.  August 23/17 (family)

Minimum wage/living wage

  • Decisions and arguments to not increase minimum wage or implement living wage have a dramatic impact on financial well being of singles and the poor.  May 4/16 (discriminatory) and Sept. 12/16 (canada-pension-plan)

Net worth and assets

  • When net worth and assets are not included in family benefit formulas, benefits are often given to those who need these benefits less (middle class and the wealthy) than the poor who have less net worth and assets.  August 17/16 (assets)

OAS recovery tax (OAS clawback)

  • OAS clawback benefits wealthy couples and some widows the most.  OAS for couples only begins at net income of $145,618 ($72,809 per person) thus allowing them to receive full OAS of $13,760 as a couple.  Not many senior singles (except some widowed persons) who could ever hope to achieve a net income of $72,809. Aug. 29/16 (oas)

Pension splitting

  • Pension splitting benefits only wealthy married or coupled family units.  Singles don’t get to pension split. Jan. 31/16 (government) and May 4/16 (selective).

Reward programs, company perks, money benefit programs, and fee schedules benefit families the most

‘Selective’ social democracy

  • There has been much that is good about democratic socialism, but there also has been some negative outcomes .  One outcome is ‘selective’ democratic socialism where certain members of society receive more social benefits than others. May 4/16 (selective)

Senior singles pay more

  • Senior singles often ‘pay more, get less’ because they are not included equally in financial formulas.  Singles also help support widowed persons and survivor pension plans. Dec. 22/15 (senior) and June 2/16 (retirement)

Singles not included or improperly identified in family definition

  • Ever singles (never married, no kids) are often not properly identified in family definitions.  Widowed persons and single parents are not ever singles.  Widowed persons and single parents are afforded some benefits that ever singles do not receive.  Dec. 2/15 (false) and Aug. 7/16 (definition)

CONCLUSION

It is very clear from the many examples above that government, politician, business and family financial policy decisions are often made in isolation and in financial silo fashion.  Continuation of these practises without a clear path to proper evaluation of all ‘across the board’ financial formulas and their ‘cause and effect’ on each other will only lead to perverse financial privileging of the middle class and wealthy while continuing financial discrimination of ever singles, early in life divorced singles, single parents and the poor.

(This blog is of a general nature about financial discrimination of individuals/singles.  It is not intended to provide personal or financial advice.)

FINANCIAL POST PERSONAL AND FAMILY FINANCIAL PROFILES STAR RATINGS-Part 2 of 2

FINANCIAL POST PERSONAL AND FAMILY FINANCIAL PROFILES STAR RATINGS-Part 2 of 2

(These thoughts are purely the blunt, no nonsense personal opinions of the author and are not intended to provide personal or financial advice.)

(six-reasons-why-married-coupled-persons-are-able-to-achieve-more-financial-power-wealth than singles)

(Andrew Allentuck from the Financial Post oversees the personal and family finance profile evaluations.  Anyone can submit their financial profile to the Financial Post for analysis by a financial planner.  Some of these cases have been used in this blog.  It is helpful to know the background behind these financial analyses.  In Part 2 of 2 the following information outlines the top ten questions that the Financial Post receives regarding these financial profile evaluations.  The blog author’s comments re questions are entered below some of the questions.)

Financial  Post, December 22, 2012 “THE TOP 10 FAMILY FINANCE QUESTIONS OF 2012 (financialpost)

‘….In hundreds of letters to Family Finance requesting assistance and commenting on the problems folks face in paying their bills, 10 top issues emerged:

  • Debt…a 1.0% interest rate increase on a home equity line of credit will turn a $100,000 interest-only loan floating at 3.5% or $3,500 to a heftier $4,500 a year…

  • Tax shelters Inability to make the most of RRSPs, RESPs, TFSAs and, for those who qualify Registered Disability Savings Plans (RDSPs) spurred many readers to ask how they could sock away more money and which choices in the alphabet soup of these plans would be most tax efficient.  

  • Downsizing Family transition from children to empty nests and the need to raise cash for retirement spending came up in more than half of our cases.  The amount of money that can be raised or the amount of debt that can be liberated depends on the market price of home or cottage.  Where prices are very high – think Vancouver, Victoria, Calgary and Toronto – readers sensed that they could  take a profit over cost, especially if they had owned the home for many years, pay debts and have cash left over for a smaller home or for renting….’

Comment:  The unfortunate truth is that many seniors (married or coupled and widowers) living in their expensive big homes do not want to downsize.  Many financial assistance programs have been implemented included house tax assistance and renovation assistance.  Many singles and poor families, however, do not have the ability to own big expensive homes.  Singles are told they can move or go live with someone if they have problems  with housing.  It is primarily only wealthy families that have cottages or second properties, motorhomes and other expensive toys.

  • ‘Children Couples and those expecting a first child wrote in dozens of cases to ask what is the cost of raising a child.  A 2011 study by the Manitoba Department of Agriculture suggested that a child born in 2010 would set its parents back by $191,665…..’

Comment:  Some statistics give a figure of $250,000.  To 18 years of each child, this amounts to $13,889 per year and $1157 per month.  It is difficult to understand why parents (beyond replacing themselves with two children) would have three, four, five children when they know they won’t be able to support themselves and their children within the parameters of their budgets and salaries. When it is known that there is a world population explosion and the earth will not be able to sustain this population explosion, why would responsible parents have more than two children?

  • ‘Boundaries It is one thing to know the statistics of child-rearing expense and another to  manage it.  Readers asked many times how much they could afford to give their kids for RESPs and for activities while at home.  It was common to find cases in which parents, strapped for money, spent $400 to  $500 a month for sport yet could have cut down on hockey and put enough money into RESPs to qualify for maximum government grants.  Indulgences included foreign travel with parents and money for cars for teenagers.  When the parents wound up strapped for cash, it was clear that they had failed to set boundaries on what they would spend and what they might ask their older children to earn to support their sports, hobbies and travel.’

Comment:  Straight from a financial person’s mouth-married or coupled families with children often don’t set boundaries in reality to what they can afford.  However, singles are often told they spend too much and are selfish even though they don’t have the same financial income and assets as married or coupled families with children.

  • ‘Limits to portfolio growth

  • Understanding risk

  • Insurance Virtually every reader has insurance for his home and car, but life insurance is another matter.  A third of  our readers need more insurance than they have to cover to risk that the single breadwinner in a family could die prematurely.  Another third have inappropriate coverage with costly whole life that builds cash value slowly, or universal life they (and many financial analysts) can’t understand.  The remainder need to adjust their coverage up or down with how their lives have changed.  The math within life insurance is complex, the tax breaks that life insurance can afford are valuable, and the protection against many creditor claims life insurance can provide are precious, but few readers  understand how intricate a product life insurance is.’

Comment:  Life insurance should be made mandatory for all married or coupled family units, just like home and car insurance.  Life insurance should replace all boutique tax credits directed towards widowers as they are now technically ‘single’.  Ever singles and divorced persons do not get benefits that widowers get and are, in fact, helping to support widowers with these benefits. Also, education on term insurance as the most cost effective insurance needs to be promoted.

  • ‘Retirement age A generation of readers grew up aspiring to retire at age 55.  Two-thirds of the letters to Family Finance raise the question of how they can get enough money to retire then or a little later.  Today, the mid-50s goal is so 1980 – before the crashes of the dot-coms, 9/11 and the 2008 debt crisis.  In fact, few readers have sufficient capital to make it to 55.  Instead, working another decade to 65 or even 67….is necessary.  Working longer not only allows more savings, it postpones the time that retirees have to start drawing down their capital.  Working longer also provides a reason to get up in the morning, maintains associations, and even sustains credit ratings.  Full retirement at age 55 is an idea whose time has come and gone for most.’

Comment:  Again, straight from a financial person’s mouth-married or coupled family units seem to believe they can retire early after having received multiple family tax credits, and then be able to pension split without paying very little for these credits.  Many singles have to work longer while paying to help support married or coupled family units and the multiple tax credits they receive.  Singles receive very little of these tax credits.

  • ‘Make a budget Many requests to Family Finance ask for help making a budget.  Readers regard having a set of rules as a key to meeting savings goals for their kids and retirement.  Where cash is tight, a set of rules for the road is surely a good  idea.  Just thinking about what categories of spending should have various allocations each month is helpful.  Mundane it may be, but writing a budget can be a first step to sound family finance.’

Comment:  Everyone should have a budget.  In addition to family budgeting, parents need to teach their children about budgeting, the Rule of 72 and what the real costs are for items like expensive sports activities.  If singles are thought to be spendthrifts and selfish, maybe it is because their parents never taught them anything about finances.  Or, maybe it is because married or coupled family units with children don’t even to try to understand what it costs single persons to live once they leave  home.  More married or coupled family units with children need to educate themselves on all the benefits they receive, how little they are paying for these benefits and what it is costing other family units like singles to support these benefits that they, themselves, do not receive.

CONCLUSION

It would be helpful if all citizens learn to take responsibility for their own financial well-being instead of looking to others to support them in the form of government tax credits. The present upside down financial situation of giving to the wealthy (particularly married or coupled or family units with children) while making them pay less needs to be reversed so those who truly need assistance receive this assistance (poor singles and poor families with children).  It is absurd that the wealthy are accumulating huge inheritances like TFSA accounts without paying taxes on these accounts.  It is absurd that the wealthy parents want to leave huge inheritances for their children, but do not wish to give up assets like big houses while receiving tax credits such as house tax financial assistance and pension-splitting.  It is absurd that governments do not take into accounts assets as well as income when handing out tax credits.

(This blog is of a general nature about financial discrimination of individuals/singles.  It is not intended to provide personal or financial advice.)

BOUTIQUE TAX CREDITS PUSHING SINGLES INTO POVERTY-Part 2 of 2

BOUTIQUE TAX CREDITS PUSHING SINGLES INTO POVERTY-Part 2 of 2

These thoughts are purely the blunt, no nonsense personal opinions of the author and are not intended to provide personal or financial advice.

six-reasons-why-married-coupled-persons-are-able-to-achieve-more-financial-power-wealth

(The last two posts discussed how detrimental boutique tax credits can become to the financial well-being of a country and its citizens.  These were based on ‘Policy Forum:  The Case Against Boutique Tax Credit and Similar Expenditures’ by Neil brooks (abstract).

This post itemizes four personal finance cases showing how certain family units may benefit far more  than other family units like ever singles and singles with children).

CASE 1 – Financial Post Personal Finance Plan, June 11, 2016 – ‘Farm Plan Risky for Couple with 4 Kids’ (financialpost)

Ed age 32 and Teresa 33 have four children ages 5, 3, 1 and newborn in British Columbia. Ed works for a government agency, Teresa is a homemaker.  At age 32 and 33, already have a net worth of $502,000 ($208,000 home not in the Vancouver area fully paid and $177,000 land with $37,000 (21%) mortgage.  They would like to sell their house, move out of town and set up a small farm.  Ed would give up his government job and secure income by selling eggs and produce.  Would like to retire with about $4,000 in present-day dollars and after tax.

Ed brings home $2,680 per month plus tax-free Canada Child Benefit (CCB) $1,811 for their four children, all under the age of 6 for total family disposable income to $4,491 per month (CCB is about 40 per cent of take-home income.  (When all four children are ages 6 to 17, the CCB will be $1,478 a month based on 2016 rates).

Financial Planner’s Recommendations – Maximize Registered Education Savings Plans (RESP), so they can capture Canada Education Savings Grant (CESG) of $500 per beneficiary for total of $7,200 (three per cent annual growth after inflation would generate about $270,000 or about $67,500 per child for post secondary-education).  Advice is that Ed continue working until the age of 60 and when the youngest child is 18.  Advice is also given for purchase of the farm, details of which will not be discussed here.  Each spouse would add $5,500 to their TFSAs for every year until Ed is age 60.

At retirement, if Ed retires at age 60 and Teresa continues as a stay at home spouse, in 2016 dollars they would have a total pre-tax income of $68,495, or $5,137 per month to spend after 10 per cent tax and no tax on TFSA payments.  At age 65, they would have total income of $86,163 with no tax on TFSA payouts and pension and age credits or $6,460 a month to spend.

If they follow financial planner advice for retirement at age 60 and maxed out contributions of RESPs and TFSAs, rough calculations show they will have received approximately $339,000 child benefits, $308,000 tax free TFSA savings  and $28,800 RESP government grants for total $675,800.  This does not include all possible benefits from other sources such as provinces, GST/HST credits and interest generated from investments.  If Ed is deceased before Teresa, as a widower Teresa will receive even more benefits as a survivor with survivor pension benefits.

All things remaining the same their assets at age 60 with farm/house $485,000, RRSP $48,000, and TFSA $349,000 will equal a total of $882,000.  So, at age 60 they will have assets close to millionaire status while paying very little in taxes.  (Financial Post rating – two stars out of five).

CASE 2 –  Financial Post Personal Finance Plan, March 24, 2016  ‘Couple sick of existing like college student are living below their means, but could still use a financial tuneup’ (financialpost)

Ontario couple Mark 45 and Cathy 43 have two kids 9 and 12 and bring home $8,670 per month ($7,000 from jobs and net rent income $1,670 from two rental properties that produce good income  in North).  At ages of 45 and 43 they already have assets of $1,480,272 including RRSPs of $300,322, liabilities of $536,315 for net worth of $943,957. Their two cars are 10 and 15 years old.  They feel like they are living like college students. Mark’s job is not secure and produces a lot of stress. They have not contributed to children’s RESP and 130 year old house requires repairs.

Financial planner advice is to restructure their finances, put money into RESPs for children and maximize RRSPs.  Both spouses have defined benefit pension plans from past employment..

At retirement pensions, RRSP, rental income and CPP/OAS at age 65 would generate  pre-tax income of $105,672.  After age and pension splitting, after-tax income at 16% tax would be about $7,400 a month.  Financial planner states they would have surplus income for travel and pleasure which they now forego, (plus they will still have assets of home and rental properties). (Financial Post rating – four stars out of five).


CASE 3 – Financial Post Personal Finance Plan, May 21, 2016 ‘Home Ownership Possible but Tight’ (financialpost)

Jessica, age 54 lives in Ontario and has three grown children.  She would like to buy $150,000 house in small town Ontario.  Assets are $40,000 LIRA, $2,400 in TFSA, $10,000 RRSP and $19,000 in company defined contribution pension plan, car $10,000 and debts of $10,700 for $70,400 net worth total.  Her take home pay is $3,315 per month. She puts $240 in TFSA, $100 in RRSP and $300 in non registered account per month. “Her outlook is to retire in 10 years, but that will be struggle.  She has to make a middle income (so stated) go a long way”.

Financial planner advice is to pay off debts in nine months.  Advice is given for purchase of a home with three per cent twenty five year mortgage and saving for retirement but it will be on a financial shoestring.  At retirement and after age and pension credits and 10% tax, she should have take home pay of $2,300 per month.  Final comment:  “her retirement will be hostage to unexpected expenses.  But she will have the security of a home of her own”.  (Financial Post rating two stars out of five).

CASE 4-Public Service Canadian employees

In same job/wage categories with 2013 annual income around $67,000 for never married singles, no children (calculations may vary slightly in provinces regarding tax and other deductions) approximate payroll deductions include income tax $11,000, CPP and EI $3,200, union dues $900, public pension contributions $5,300, RRSP deductions $3,500, parking $1,200, health premiums and insurance $600, for total of $25,700.  This leaves $41,300 take home yearly income or $3,441 per month.

personal finance cases 1

personal finance cases 2

CONCLUSION

The above four cases show four distinctly different cases, two family units with children, one single parent family unit with children and one family ever single family unit.

  • It is astounding how two parent family units with children can accumulate wealth while single parent and unattached person family units struggle to live on on $3,300 and $3,400 after tax dollars per month or $39,600 and $40,800 annually while working and into their retirement years.
  • It is absurd that tax credits should comprise 40 per cent of a family’s income when  they have the ability to become wealthy enough to not have to pay mortgage or rent. In some provinces, singles cannot have assets of more than $7,000 to get affordable housing, so why should families have assets of half a million dollars and still get full child tax credits?
  • It is absurd that a family unit never pay full taxes at any time during child rearing years only to have the ability to retire early at age 60 and have more retirement income than they had during child rearing years  and have paid little or no taxes.
  • It is absurd to claim poverty because of what it costs to raise children when in age thirties and forties family units with children already have assets of half a million dollars and higher.
  • It is absurd that married/coupled family units with children in retirement pay less than 20 per cent in taxes on very healthy retirement incomes because of pension spitting and other credits.  Where is fairness when they pay same or less level of taxes as singles on lower incomes?
  • Financial planner calls Jessica’s income middle class, but she has difficulties living on it.
  • Married or coupled family units possibly have a much better retirement life than singles in family units with and without children.  (Singles with children generally have the greatest financial struggle).
  • Life during working years is just as difficult for singles as it is for married or coupled family units.
  • Government, politicians and families need to consider all family units in financial formulas.  These should be based on equivalence scales to provide financial fairness for all family units.  Financial fairness should include not only income, but also assets.
  • It should also be stated that when examining many of the Financial Post profiles for divorced persons with children, particularly those beyond child rearing years, many appear to have assets beyond $750,000.  How is this possible?  One reason might be inherited wealth.  Second reason which has been stated over and over again in this blog is the ability for married/coupled persons with children family units to gain wealth and, therefore, already have considerable wealth when they are divorced later in life.

LESSONS LEARNED

IT IS INHERENTLY WRONG FOR GOVERNMENTS TO NOT INCLUDE ASSETS AS WELL AS INCOME WHEN DOLING OUT TAX CREDITS.  THESE CREDITS SHOULD BE GIVEN TO THE POOR, NOT THOSE WITH LOW INCOME AND WEALTHY ASSETS.  BETTER YET,  TAX CREDITS SHOULD  BE COMPLETELY ELIMINATED AND REPLACED BY TAXES WHICH ARE BASED ON  INCOME AND ASSETS.

(This blog is of a general nature about financial discrimination of individuals/singles.  It is not intended to provide personal or financial advice).

BOUTIQUE TAX CREDITS PUSHING SINGLES INTO POVERTY-Part 1 of 2

BOUTIQUE TAX CREDITS PUSHING SINGLES INTO POVERTY-Part 1 of 2

These thoughts are purely the blunt, no nonsense personal opinions of the author and are not intended to provide personal or financial advice. (six-reasons-why-married-coupled-persons-are-able-to-achieve-more-financial-power-wealth)

(The last two posts discussed how detrimental boutique tax credits can become to the financial well-being of a country and its citizens.  Boutique tax credits once they have been implemented are very hard to repeal because of voter sense of entitlement.  These were based on ‘Policy Forum: The Case Against Boutique Tax Credit and Similar Expenditures’ by Neil brooks).  This post was updated on July 8, 2014.

This post itemizes a personal finance case showing how certain family units benefit far more from boutique tax credits than other family units like ever singles.  One could say this case is totally bizarre in how benefits can be doled out in excess while recipients pay little or no tax).  This post was updated on June 24,  2016.

CASE 1 – Financial Post Personal Finance Plan, June 11, 2016 – ‘Farm Plan Risky for Couple with 4 Kids’ (financialpost)

Ed age 32 and Teresa 33 have four children ages 5, 3, 1 and newborn in British Columbia. Ed works for a government agency and Teresa is a homemaker.  At age 32 and 33, they already have a net worth of $502,000.  Their $208,000 home is not in the Vancouver area and is fully paid for.  Their land is valued at 177,000 with $37,000 (21%) owing on the mortgage.  They would like to sell their house, move out of town and set up a small farm.  Ed would give up his government job and they would get income by selling eggs and produce, hopefully at a profit.  Their plan is to retire comfortably and securely with about $4,000 in present-day dollars and after tax.  At age 32 and 33, they also already have a net worth of half a million dollars ($502,000).

 Ed brings home $2,680 per month.  They will receive the new, non-taxable Canada Child Benefit (CCB) (brought in by the ruling Liberal Party to replace the Conservative Universal Child Care Benefit) at $1,811 for their four children, all under the age of 6.  This brings their total family disposable income to $4,491 per month.  The CCB makes a huge difference by contributing about 40 per cent to take-home income.

(When all four children are ages 6 to 17, the CCB will be $1,478 a month based on 2016 rates).


boutique tax credit case 1

Financial Planner’s Recommendations – Apply $17,000 cash already reserved for kids to Registered Education Savings Plans (RESP), so they can capture the Canada Education Savings Grant (CESG) of the lesser of 20 per cent of contributions or $500 per beneficiary.  Using the children’s present ages of 5, 3, 1, and one month, subsequent annual contributions of $2,500 per child plus the $500 CESG (to a maximum of $7,200 per beneficiary) with a three per cent annual growth after inflation would generate a total of about $270,000 or about $67,500 per child for post secondary-education.

Re job, advice is that Ed continue working until the age of 60 and when the youngest child is 18.  Advice is also given for purchase of the farm, details of which will not be discussed here.  Each spouse would add $5,500 to their TFSAs for each year until Ed is age 60.

Re retirement, if Ed retires at age 60 and Teresa continues as a stay at home spouse, in 2016 dollars he and Teresa would have his $26,208 defined benefit pension and the $7,200 bridge, Registered Retirement Savings Plan (RRSP) payments of $5,727 a year and Tax Free Savings Account (TFSA) payments of $29,360 for a total pre-tax income of $68,495, or $5,137 per month to spend after 10 per cent tax and no tax on TFSA payments.  At age 65, Ed would lose the $7,200 bridge but gain $11,176 in annual Canada Pension Plan (CPP), plus Old Age Security (OAS) payments of $6,846 each spouse, for total income of $86,163 with no tax on TFSA payouts and pension and age credits.  After tax, they would have $6,460 a month to spend.  Both before and after 65, they would have achieved beyond expectations their goal of $4,000 monthly income.

The unknowns of this plan are the cost of farm and whether it will make a profit.  The financial  planner states:

 “As a retirement plan, it is a wonderful goal.  As a financial endeavour, it is speculative.”

ANALYSIS

All calculations in 2016 dollars and assumes there is no wage increase for Ed and Teresa will remain stay at home spouse and all federal benefit plans and credits will remain the same.

Child benefit non taxable:

All four children up to and including age 5 – $1,811 per month times 12 months times 5 years (not fully calculated for age)  =  approximately $108,000

All four children age 6 up to and including 17 –  $1,478 per month times 12 months times 13 years = approximately $231,000

Total benefit for eighteen years = approximately $339,000

TFSA contributions in after-tax dollars and tax free and not including interest earned $5,500 times two persons times to sixty years of age (Ed) $11,000 times 28 years = $308,000

RESP contributions $2,500 per child per year times four equals $10,000 per year plus $500 up to maximum $7,200 grant per child will generate with three per cent growth a total of about $270,000 education savings for children.

$7,200 grant per child times four = $28,800.

Retirement – they want to retire at age 60, will pay only 10 per cent tax on $68,495 pre-tax including tax-free TFSA income or $5,137 per month.  At 65 they will have total income of $86,143 and  with pension splitting will have $6,460 after-tax monthly income (not able to calculate total benefits received).

These calculations do not include other possible GST/HST credits and tax credits offered by the provinces (example: BC Low Income Climate Action Tax Credit even though this family unit of six will use far more resources affecting climate change than a family unit of one person).  These calculations also do not include benefits of reduced fees, etc. that families get, but ever singles do not.

If Ed retires at age 60, when his youngest child is age 18, he will never have worked a year where full taxes were paid.

All things being equal, this couple will receive benefit upon benefit from present year to when they retire at age 60 and beyond age 65.  If Ed is deceased before Teresa, as a widower Teresa will receive even more benefits as a survivor with survivor pension benefits.

In reality,  they likely will receive approximately $1 million dollars in benefits which is essentially the cost of raising their children and their children will have healthy education accounts.   The parents will retire with even more income than they had while raising their children, and have accumulated a healthy sum in assets.  With assets and value of assets remaining same at age 60 retirement, parents will  have $485,000 in farm, $48,000 in RRSPs and $349,000 in TFSAs for total of $882,000.  So, they will essentially be close to millionaire status while receiving multiple benefits and paying almost no taxes.

This couple from the time they are married until one spouse is deceased will have received shower, wedding, baby gifts, possible maternity/paternity leaves, child benefits times four children, TFSA benefits times two, reduced taxes, pension splitting, possible survivor pension benefits, and retirement before age 65.

While it is understood that is expensive to raise children, it is bizarre that  parents believe they can raise children, retire before age 65 and pay very little in taxes to support the benefits they believe they are entitled to.  Why should these families get benefits beyond raising their children like pension splitting when they have huge TFSA tax free accounts including other assets?   (Neil Brooks calls the pension splitting tax credit outrageous).  The plethora of benefits given to parents with children is what the blog author calls ‘selective’ social democracy or situation where benefits are given to one segment of the population so they can achieve more wealth at the expense other segments of the population such as ever singles and divorced persons without children.

CONCLUSION

So who is paying for all of this?  One group of Canadian citizens subsidizing families as in case above are ever singles (never married, no kids) and divorced persons without children.  They will never achieve a monthly income of $4,500 per month unless they are making a very good income.  They don’t have the money to max out TFSA amounts like this couple has.  The only benefits ever singles and divorced persons without children will ever receive is if they are in an abject state of poverty.  They also will never be able to accumulate the retirement and other assets that this couple has.  They are never likely able to retire at age 60 unless they have equivalent income to the above couple (at least $60,000 per year).  A middle quintile income for unattached singles is $23,357 to $36,859.  At $55,499 income an unattached single is considered to be in top quintile of income for the country (moneysense), but they have problems living on this income as has been shown in previous posts.

Ever singles and divorced persons without children with before-tax income equivalent to this couple will pay much more tax, for (example $60,000 to $70,000 income).  If one calculates the income tax contributed by an ever single at $15,000 per year time 40 years of employment total contributed to Canadian coffers is $600,000 over working life. Employment insurance deductions (used in large part for maternal/paternal leaves) at $1,000 per year adds another $40,000 to  the total.  Ever singles never get any of this back because they pay more taxes, can’t pension split and are not considered to be part of the financial family by politicians, government and even their own families and married/coupled siblings..  All political parties are guilty of excluding ever singles from financial formulas.  Ever singles have very little financial and voting power because they are a minority in a society where parents and children rule.

Ever singles and divorced persons without children are being pushed into a state of poverty by the plethora of tax credits given only to families, but for which ever singles and divorced persons without kids have to pay without getting equivalent of same benefits.

This blog is of a general nature about financial discrimination of individuals/singles.  It is not intended to provide personal or financial advice.

BOUTIQUE TAX CREDITS INCONSISTENT AND FINANCIALLY DISCRIMINATING (Part 2 of 2)

BOUTIQUE TAX CREDITS INCONSISTENT AND FINANCIALLY DISCRIMINATING (Part 2 of 2)

These thoughts are purely the blunt, no nonsense personal opinions of the author and are not intended to provide personal or financial advice.

(The following information is taken from:  Policy Forum: The Case Against Boutique Tax Credits and Similar Tax Expenditures by Neil Brooks (brooks) (abstractwhich show SELECTED TAX EXPENDITURES INTRODUCED OR SUBSTANTIALLY AMENDED FROM 2006 TO 2015 (page 129).  His article states:  

The table that follows lists selected tax expenditures introduced or substantially amended by the Conservative government between 2006 and 2015. These tax expenditures are listed under the headings and in the order shown in the Department of Finance’s Tax Expenditures and Evaluations 2014. To provide some context, a few of the listings have a brief introduction. The year in parentheses following the listing is the year the measure was introduced or enriched. The projected cost for 2014 of new and amended tax expenditures is then given, if it was provided in that year’s tax expenditures and evaluations report.

Where the tax expenditure takes the form of a tax credit, the table indicates the amount of the credit. The actual value of the credit to the taxpayer is almost always 15 percent (the lowest federal tax rate in 2015) of the amount claimed by the taxpayer.  For example, although the maximum amount of the children’s fitness tax credit was increased to $1,000 in 2015, the maximum federal tax saving to the taxpayer is $150 ($1,000 × 0.15).

Some of the costs to the government as outlined in the Brooks article for the Selected Boutique Tax Credit Benefits are as follows:  charitable donation benefits and exemption of capital gains $265 million from 2017 to 2020,  first time donor’s super credit $7 million, children’s arts tax credit $42 million, textbook tax credit for post-secondary education and certified occupational training $34 million-amount claimed by students (not transferred to parents), post-secondary scholarships, fellowships, and bursaries exempt from tax $45 million, Canada employment tax credit $2.145 billion, volunteer firefighters tax credit $17 million, search and rescue volunteers tax credit $4 million, family caregiver tax credit $65 million, age tax credit $2.955 billion 2009 (parliamentary budget officer estimates that the two increases in the age credit since 2006 will have a fiscal impact of $950 million in 2014), registered disability saving plan $8 million, pension income tax credit $1.12 billion, changes to registered retirement savings plans and registered retirement income funds $670 million from 2016 to 2020, first-time home buyer’s tax credit $110 million, home renovation tax credit $2.265 billion in 2009), public transit tax credit $190 million.

(It should be noted that some of these have changed or been deleted since the Liberal party won the 2015 election).

Table – page 1 of 4

boutique tax credit 5

Table – page 2 of 4

boutique tax credit 6

Table – page 3 of 4

boutique tax credit 7

Table – page 4 of 4

boutique tax credit 8

This blog is of a general nature about financial discrimination of individuals/singles.  It is not intended to provide personal or financial advice.


BOUTIQUE TAX CREDIT INCONSISTENT AND FINANCIALLY DISCRIMINATING (Part 1 of 2)

BOUTIQUE TAX CREDIT INCONSISTENT AND FINANCIALLY DISCRIMINATING (Part 1 of 2)

These thoughts are purely the blunt, no nonsense personal opinions of the author and are not intended to provide personal or financial advice.

Revisions were applied to this post on June 19, 2016.

(Preface:  Every political party has introduced tax credits to give financial benefits to certain members of the population more than others.  However, during the reign of the Conservative party under Prime Minister Stephen Harper, a plethora of tax credits were introduced.  This led to coining of the phrase ‘boutique tax credits’.  Much of the following information has been taken from the ‘Policy Forum: The Case Against Boutique Tax Credits and Similar Tax Expenditures by Neil Brooks’ (brooks).  The Neil Brooks discussion provides an excellent overview of why boutique tax credits are so wrong and discriminatory.  While many families, especially poor families do not benefit from boutique tax credits, ever singles also do not benefit from most of the tax credits.  If there are any negatives to the study it is that financial discriminatory impact of tax credits and expenditures for ever singles and to some extent single parent with children family units is not fully recognized).

The author of this blog has long thought that boutique tax credits are financially discriminatory to singles.  However, we cannot even begin to articulate what Neil Brooks has so eloquently stated in his article.  The entire article is worth a read including the footnotes which provide excellent information on many commentaries and studies of this topic.  For this post, we attempted to condense the PDF from 68 pages to 8 pages, for example, by eliminating the many footnotes – see condensed version at the end of this post.  Blog author’s comments have been highlighted in blue).

This has been a very difficult post to write in terms of length as there is so many excellent points that have been made by Neil Brooks in his study, so be forewarned that the condensed version of the Brook;s article is eight pages long).

PROBLEMS WITH BOUTIQUE TAX CREDITS (AS IDENTIFIED BY BLOG AUTHOR)

SUMMARY OF TAX PROBLEMS:

Problem 1 – Conservative boutique tax credits purposely target traditional family values (single income families). Boutique Tax Credits initiated by the Progressive Conservative Party under Stephen Harper purposely target traditional family values. The party never gives a definition of traditional family values or who is included in the traditional family.  They talk about the family unit as ‘essential to the well-being  of individuals and society’.  A reflection of their belief in the importance of the role of the traditional family in society, another objective was to privilege single-earner families through the tax system (page 76).   (Blog author’s comments:  Ever singles are generally not included in these boutique tax credits).

Problem 2 -tax expenditures introduced by the Conservatives of Boutique Tax Credits were targeted at relatively narrowly defined groups of potential Conservative voters (page 67).  Finance Minister’s budget moved to put the finishing touches on building a new Conservative coalition through a series of tax cuts, rebates and other subsidies aimed at select segments of the voting population  (page 73).   By enacting these tax expenditures, as opposed to across-the-board tax cuts, the Conservatives were able, at a much lower cost, to favour middle-class families with children, middle-income and well-to-do seniors, and other much more narrowly targeted groups ( page 77).   (This is what this blog author calls ‘selective’ democratic socialism).

Problem 3 – Tax Credits and Expenditures ignore traditional tax criteria that apply to technical tax provisions, namely, equity, neutrality, and simplicity (page 69).

Problem 4 Conservatives were “pleasing their electoral base with . . . dollars in pockets for boutique programs rewarding wealth and socially conservative values  (page 69).  An example is pension splitting where wealthy married/coupled persons benefit the most, poor and married or coupled persons with equal incomes benefited to a lesser extent.(Blog author’s comment:  Ever singles and divorced/separated persons are not able to use this tax credit).

Problem 5Tax Expenditures Can Serve as a Bribe to Potential Voters (page 77)    By enacting these tax expenditures, as opposed to across-the-board tax cuts, the Conservatives were able, at a much lower cost, to favour middle-class families with children, middle-income and well-to-do seniors, and other much more narrowly targeted groups.

In 2011, the average taxpayer with an income between $100,000 and $150,000 paid $3,633 less in taxes.  The average taxpayer with a very modest income of between $20,000 and $25,000 saw only $475 back in the same period.  These numbers are before the impact of the new Family Tax Cut and the doubling of the Child Fitness Tax Credit – both of which are likely to accelerate the same trend.  (/canada2020).   (Blog author’s comment:  Poor families and ever singles including seniors are least likely to benefit (senior-singles-pay-more).

Problem 6 –  It is very difficult to get rid of tax expenditures or tax credits once they are  implemented.  Political parties are reluctant to eliminate them even if they are discriminatory for fear of losing votes.  Also, tax expenditures are extremely hard to repeal, even the truly awful ones, since eliminating a tax expenditure will be framed as a tax increase (page 78).   (Blog author’s comments:  Will it ever be possible to eliminate the pension splitting from which wealthy families benefit the most?  And, who is paying for this?)    Neil Brooks calls pension splitting an “outrageous pension income splitting scheme that should be repealed and the revenue used to enrich, or reduce the clawback, of the old age security pensions” (page 122).   Reducing clawback will not solve problem of inequality if clawback is not increased for singles and reduced for married or coupled persons through income-testing.

Problem 7 Tax expenditures that are relief measures transfer income from one group of individuals to another.  (Blog author’s comment:  Instead of these relief measures targeting lower income individuals and families, many have benefited wealthy families the most.  Ever singles benefit the least).

Problem 8Psychological impact of tax credits or expenditures (The Public Appears to Favour Policies Framed as Tax Breaks-page 83).  people’s psychological biases predispose them to favour tax expenditures, certainly over direct spending programs……label—tax relief versus direct outlay—matters.”  These studies are also consistent with other survey results in which respondents admit to have benefited from tax expenditures and yet deny ever having used a government social program.(Blog Author’s comments:  The reverse effects of Tax Credits and Expenditures are often not discussed, that is, the anger and financial despair that some citizens feel towards those that are receiving more of the benefits without, for example, application of income-testing  principles).

Problem 9 – Tax Expenditures Reduce the Political Pressure for Public Programs (page 84)  One of the Conservatives’ major political goals has been to resist the public provision of social programs. Hence, another explanation for the popularity of tax expenditures under the Conservatives is that they were a step forward in implementing a broader political project, a private-sector welfare state.Tax credits for private caregiving work reduce the political pressure for publicly provided long-term care facilities.. …. Supplementing the wages of low-income workers with a tax credit reduces the pressure to offer public service jobs to the unemployed…..The tax subsidization of tuition fees, textbooks, and interest on student loans reduces the political pressure for more direct government support for universities.

Problem 10 – Tax Expenditures Make the Tax System Less Transparent (page 94) and Tax Expenditures Divert the Resources of the CRA and Create Administrative Problems That Damage Its Reputation (page 94)

    • Complexity and number of tax credits make them very difficult to interpret and lawyers and accountants become intimately involved in their implementation.  As a result attention is directed towards interpretation of these credits instead of tracking abuse of the tax system.
    • Many are badly designed (page 96)
    • Tax Expenditures Often Do Not Serve Important Objectives of Government Policy (page 97)
    • Tax Expenditures Often Do Not Achieve Their Objectives Equitably (page 104)
    • upside-down effect of tax deductions
    • all tax credits should be refundable.

(Blog author’s comment:  Past posts have talked about upside-down financial effects (housing),  and tax credits should be refundable and income-tested.  To have someone else confirm these facts is reassuring.  It would be nice if political parties and governments also realized these facts.)

Problem 11 Education – Conservatives completely exempted certain scholarships and fellowships from tax in their first budget in 2006.  The exclusion of a $10,000 scholarship for a low-income student who has no other income provides that student with no implicit subsidy. However, the same exclusion will provide an implicit subsidy of $2,200 to a higher-income student in the 22 percent tax bracket. If the point of the exclusion was to benefit needy students, this upside-down effect is perverse (page 104)

Problem 12 – Low income individuals and families benefit the least.   A credit that can be offset against a taxpayer’s tax liability is of no value to a low-income person who has no tax liability because his or her income is less than the amount of the basic personal tax credit, for example. Hence, all tax credits should be refundable (page 106)…..In terms of delivering subsidies equitably through the tax system, if the primary purpose of a tax credit is to incentivize or assist low- or middle-income individuals, entitlement to the credit should be income-tested so that it vanishes when a taxpayer’s income reaches a certain amount (page 108).  Income-testing so that it vanishes when income reaches a certain amount should vanish quicker for for married or coupled persons than singles as it costs more for singles to live than married/coupled persons as a family unit.

Neil Brooks has also stated that analysis of  financial formulas such as distributional tables should show beneficiaries by income class, gender, household type, age cohort, and geographical region.  This is based on known facts that females and disadvantaged persons based on race likely benefit least from tax credits (page 111). (Blog author’s comments:  Analysis of household types is important as ever singles and early divorced singles are likely to benefit the least from all tax credits).

Problem 13 – The proliferation of tax expenditures, such as the boutique tax credits, gives rise to significant rent-seeking social costs. (page 114) and encourages relevant interest groups to lobby for analogous tax expenditures. (page 114).  (Blog author’s comments:  Powerful lobby groups such as families and seniors often lead to tax credits and expenditures targeting these groups.   Ever singles do not have this kind of financial and lobbying power.  As a result they are likely to receive less of these benefits).

Problem 14 – Boutique tax credits are useless when they target everyone in a group, for example, seniors.  Giving age credit to all seniors benefits wealthiest seniors more as poor seniors do not have enough income to apply tax credits (page 122).

Problem 15 – This problem as been added by the blog author, that is there is a compounding effect to tax credits when they are applied one on  top of another for specific groups.  An example is when child tax credits are given to married or coupled family unit, who then are also able to use pension splitting credits as seniors.  As a result, married or coupled persons with children are able to gain more wealth than ever singles who are not able to use any of these credits.

Problem 16 –  This problem has been added by the blog author,  that is the so called ‘merry go round credits and expenditures which disappear and reappear.  Some citizens can never  get on the merry go round because their place in line keep getting pushed back or they are kicked out of the line or they excluded from the lines.  For example, there are some parents who have never benefited from any the child tax credits because they had no children during implementation of some tax credits only to have these tax credits abolished when they do have children.

CONCLUSION

(Blog author’s comments: it would seem that a solution to the elimination of Tax Credits and Expenditures with fairness, equality, neutrality and simplicity for all, perhaps, should be to provide three government funded basic rights: healthcare, college/university education, and universal day care).

THECASEAGAINSTTAXCREDITSANDOTHEREXPENDITURESCONDENSED

This blog is of a general nature about financial discrimination of individuals/singles.  It is not intended to provide personal or financial advice.