TAX SYSTEMS ENSURE FINANCIAL DISCRIMINATION OF LOW INCOME FAMILIES AND SINGLES


(These thoughts are purely the blunt, no nonsense personal opinions of the author about financial fairness and discrimination and are not intended to provide personal or financial advice – financialfairnessforsingles.ca).

It is a known fact, as presented by the experience of this blog author, that present tax systems benefit the wealthy and married while compromising low income families and singles.  However, most political parties fail to acknowledge this and/or fail to do anything about it.

The following two excellent articles describe different aspects of the Canadian tax system problem.  In addition as to why tax systems disparage certain groups, particularly low income families and singles, it may be that political parties unknowingly leave out certain groups because they don’t do the necessary work or have tunnel vision about including, for instance, singles in their financial formulas.


Article #1:  ‘Panel process obscures what need to be done’ by Joel French, Executive Director of Public Interest Alberta (panel-gives-political-cover-to-public-service-cuts

“With much fanfare, Alberta’s UCP (United Conservative Party) government has appointed the Blue Ribbon Panel on Alberta’s finances to recommend a path to balance its budget. Unfortunately, the entire project is compromised from the outset because the panel’s mandate ties one of its hands behind its back.

Budgets have two components: revenue and expenses. However, the panel’s mandate specifically excludes any consideration of changes necessary to the way our government generates revenue — which means that its job is restricted to recommending cuts to Alberta’s public services…..

The panel is designed to provide a rigged rationale for making big cuts to public services, by not even considering the better alternative of paying for our public services through the kinds and levels of taxation that all other provinces use for that purpose…..(Alberta is the only province without a provincial tax)…..

The Kenney government’s plans….. have already adopted a massive tax cut for Alberta’s largest and wealthiest corporations, making our government’s significant shortage of tax revenue even worse. Our tax system was already by far the least effective in the country at raising revenue, to the extent that adopting the tax system of any other province would raise between $11.2 and $21.5 billion in additional revenue every year, which would more than cover our current deficit of $6.7 billion and allow for much-needed quality improvements to health care, education and other services…..

The inescapable truth is that this panel is nothing but a political gimmick to give the UCP government a pretext to make deeply unpopular, ideological cuts to the public services we all need and value.

Obviously, more services will be turned over to the whims of private corporations. Other services and programs will disappear from public budgets altogether, but we all know the real costs never disappear. Instead they are shifted to the pocketbooks of Alberta families and paid for individually rather than collectively through our tax system.

How our government decides to handle its budget situation is a choice. They can fix our deficient revenue system so we can properly fund our services, or they can make deep cuts. The mandate of the panel makes it abundantly clear that the UCP government has already decided on the latter and simply appointed the panel to tell it what it wants to hear.

Albertans should reject this panel’s biased mandate, hold Premier Kenney to his word that more funding — not less — will be allocated to the front lines of our public services, and demand a process that fairly considers the alternative of revenue reform to properly support and enhance our public services.”


Article #2:   ‘This election campaign, let’s own up to Canada’s two-tiered tax system’ by Norm McKee (this-election-campaign-lets-own-up):

“Why is no political party talking about the Panama Paper and Paradise Paper tax disclosures?

“Because something is legal does not mean it’s not a scandal.”

If there is a serious problem, and no one acknowledges it, does the problem really exist? And why is no political party talking about the Panama Paper (2016) and Paradise Paper (2017) disclosures in this federal election campaign, which is only 10 weeks away?

All political parties are mute about the thousands of affluent Canadians who continue to legally use tax havens to avoid paying their fair share of taxes. The estimated $5 billion annually, or $25 billion over five years in lost revenues through “individual” tax avoidance practices, are staggering amounts. When affluent Canadians do not pay their share of taxes, as per Revenue Canada’s published tax schedules, Canadians must make up the difference.

It’s important to be clear. The use of tax havens by individuals to avoid paying taxes is not about greed or any person breaking the law. Despite what our federal government says, it has nothing to do with tax evaders, complex tax scams, tax audits or the CRA getting more money to combat tax cheats.  This is a political issue about Canada’s two-tier tax system that benefits the rich while doing immense financial harm to other Canadians, and that diminishes the quality of life for all.

Silence by political parties should not be an option. Canadians should demand that political parties engage in a frank and open discussion about “individual” tax avoidance prior to the October election. The cost to Canadians is too high to wait four more years until the next federal election.

We did not have the benefit in the 2015 federal election of the Panama and Paradise Paper disclosures that identified thousands of Canadians who used tax havens. We have this information now. The 2019 election is an opportunity for Canadians to realize tax reform that prohibits affluent Canadians from using tax havens to avoid paying their fair share of taxes.

Failure to address this issue now will mean four more years of great disparity in Canada’s tax system.

It’s worth noting that U.S. citizens cannot legally use tax havens for the purpose of avoiding taxes. In the U.S., “individual” tax equality is sacred.  This is not the case in Canada, where past governments have encouraged Canada’s financial élite to legally use tax havens to avoid paying taxes.

No one has anything good to say about tax avoidance, specifically tax havens used by affluent Canadians. Yet no political party or politician is doing anything about it. This can only change if “average” Canadians link the federal election with the funding of Pharmacare, economic, environmental and social initiatives, with new monies via tax reform. We need to pressure all political parties to address this scandal.

Historically, tax avoidance has been a taboo subject for all political parties.  No political party was pleased by the Panama and Paradise Paper disclosures. Instead of changing tax laws to abolish Canada’s two-tier tax system, the government response is increased funding to the CRA to address tax evaders, tax cheats and tax scams. Although these actions should be applauded, they do nothing to fix the root problem.

Canadians don’t like to think current and past government favour the financially privileged. That would be a serious violation of trust. But the evidence is clear that this is happening, and will continue, unless we make our voices heard before the October election.

The goal of The Grassroots Coalition for Tax Reform, http://www.betteroutcomes.ca, is to pressure political parties to address tax avoidance in their election platforms, specifically affluent Canadians who use tax havens to avoid paying taxes.”

CONCLUSION

What the above two articles do not convey is the anger and despair that certain Canadian groups feel about the tax avoidance that the wealthy and married can carry out within legal limits of the law and financial formulas.  Those disadvantaged by tax avoidance are damn tired of subsidizing the wealth of the elite and the married.  The following is an opinion letter by this blog author that may or not be published in a local newspaper.

“POLITICAL PARTIES DON’T CARE ABOUT SOCIAL JUSTICE AND FINANCIAL EQUALITY

Recent opinion letters in local newspapers talk ad nauseam about faults of one political party over the other.

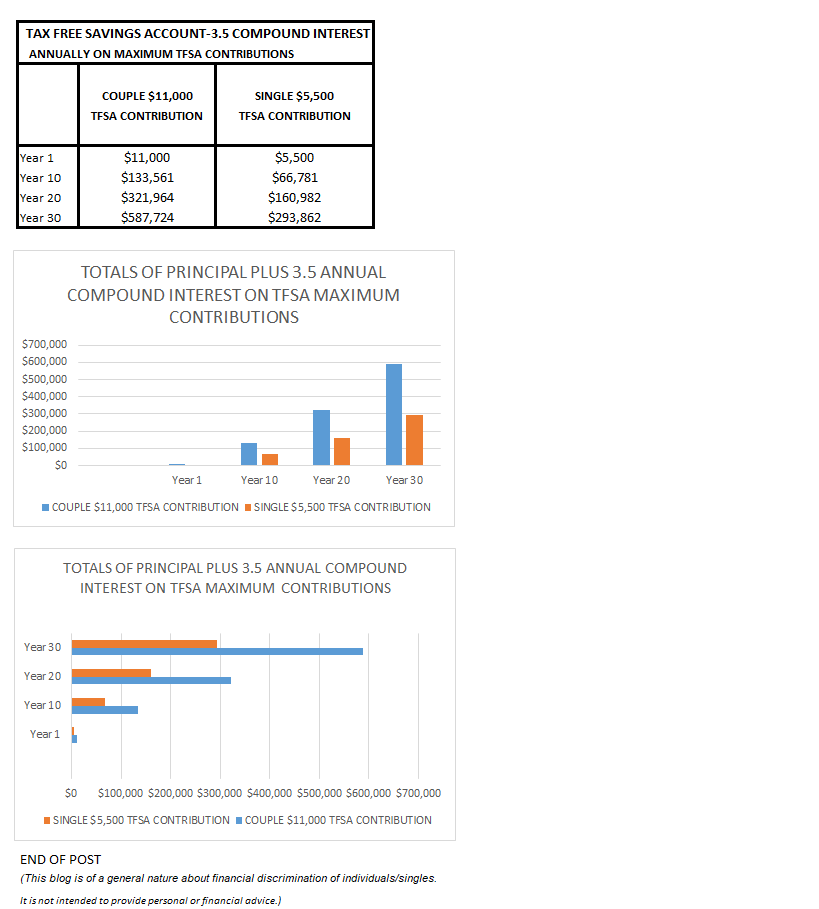
Politicians are only interested in vote getting.  Far right wing Conservatives and Christian right  ‘sell their souls to the Devil’ so they can get their agendas passed even if it is not the will of the majority.  Liberals play their ‘one upmanship’ over Conservatives by continuing unfair Conservative financial formulas such as TFSAs (TFSA ABUSE OF THE PLAN) by not making changes to the formula so that financial abuse of TFSAs cannot occur.  Libertarians talk about personal financial responsibility but never unfair financial practices.

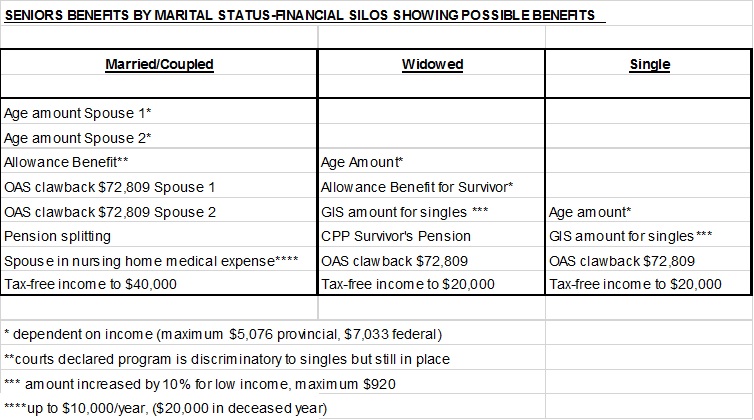
Conservative Jason Kenney attacks lowly wage earners (teens) and reverses anything and everything Rachel Notley put in place including replacing Notley merit based appointees with his cronies.  Conservative Stephen Harper TFSAs benefit wealthy to point where they may be able to claim GIS intended for low income persons because TFSA investments are not declared as income.  Conservative Blake Richards has initiated Motion 110 as a proposed financial reprieve for parents who lose infant to death, but other parents, siblings and persons who experience tragic deaths such as losing someone to gunshots, etc. don’t get an equivalent benefit.

Conservative Andrew Scheer has proposed tax free EI maternity benefits but families already receive tax free CCB benefits and likely have one spouse working.  Seriously, you want to give tax free EI maternity benefits but jobless singles and single parents have to pay taxes on their EI benefits????

Liberals line wealthy family pockets by calculating tax free CCB benefit clawback for $30,450 to $65,976 net income portion and two children at 13.5%, but only 5.7% for portion over $65,976 and up to approx. $188,000.

Elizabeth May, Green Party applauds social justice but has lobbied to repeal legislation that denies pension benefits to spouses who have married after the age of 60 or retirement even though these newly married spouses haven’t contributed one dollar to that pension plan.

Major theme of the above is that all political parties have implemented ‘gaslighting financial formulas they say help the middle class’ but instead promote socialism for the wealthy and married (LOST DOLLAR VALUE) while pushing low income families and singles further towards poverty, ensure young persons likely will never be able to leave their parents’ homes with home ownership being a major obstacle.

This blog author’s federal vote will be submitted as a spoiled ballot as there is not one political party who gives a damn about social justice and financial equality.”

(This blog is of a general nature about financial discrimination of individuals/singles.  It is not intended to provide personal or financial advice).

TAX FREE SAVINGS ACCOUNT (TFSA) DESIGNED TO MAKE MARRIED AND WEALTHY EVEN RICHER

TAX FREE SAVINGS ACCOUNT (TFSA) DESIGNED TO MAKE MARRIED AND WEALTHY EVEN RICHER

(These thoughts are purely the blunt, no nonsense personal opinions of the author about financial fairness and discrimination and are not intended to provide personal or financial advice.)

Tax Free Savings Accounts (TFSA) have been previously been addressed in this blog (boondoggle). However, what has not been addressed is how financially discriminatory TFSAs are to senior single person (never married) and poor family households in terms of benefits like Old Age Security (OAS) payouts and surviving spouse benefits. Discussions of financial benefits by media and think tanks for TFSAs usually only occur as a single entity unto themselves, but not TFSAs impact on total financial formulas.  Assessment of OAS benefit payouts and surviving spouse (widowed) benefits need to include assets such as TFSAs since wealthy do not need and do not deserve OAS support.

History of TFSAs

The Federal Conservative Party brought in TFSAs in 2009 beginning with $5,000 maximum contribution per eligible person per year.  In 2015, the Conservatives raised maximum contribution to $10,000.  The Federal Liberal Party, when they came into power dropped maximum contribution to $5,500.  Withdrawals from TFSA do not affect the total TFSA maximum contribution amount.  TFSA can be topped to maximum contribution amounts even with withdrawals.  (Thank goodness, $10,000 contribution limit was dropped to $5,500-maintaining $10,000 amount would have meant married/coupled household contribution limits rising to $120,000 to date, $240,000 in twenty years and $360,000 in thirty years-single person households would be half of these amounts).  

Also, many TFSA holders with modest incomes have a spouse with higher income. Their family’s total income can be much higher, and TFSA rules permit a high-earning spouse to contribute to both their own and their lower-income spouse’s TFSA-each up to the $5,500 annual limit, for a total of $11,000 per couple.

As expected, TFSAs benefit married/coupled households and wealthy over single person households and poor families since they do not have the same financial ability to maximize contributions.  Also, less tax revenue will be generated by governments as a result of TFSA implementation since TFSAs are not considered to be income.

“Why TFSA doubling will exacerbate income inequality” article states: (tfsa-inequality)

‘Using Statistics Canada’s Survey of Financial Security for 2012, a radically different picture emerges of the TFSAs tilt toward higher incomes. This survey provides a revealing view of TFSA patterns at the level of family incomes rather than individual incomes, and it also reflects the increasing size of account balances with family income.While households including unattached persons with total incomes below $60,000 constituted 52 percent of all families, they held only 31 percent of all TFSA balances in late 2012-less than half the share of TFSAs based on individual incomes. At the other end of the income spectrum, only 4.4 percent of families had incomes of $200,000 and higher-but they held more than triple that share of all TFSA balances at 15 percent.Upper-income families enjoy TFSA tax savings to an even more unbalanced degree than those statistics might suggest: they typically generate higher investment returns on their TFSA assets than lower earners, and they avoid the higher personal tax rates that would otherwise apply on the income from assets shifted into their tax-free accounts.’

TFSAs maximum contribution amounts to date:  Every eligible Canadian got $5,000 of new contribution room each year from 2009 to 2012.  For the years 2013 and onwards, the amount is $5,500 except for year 2015 when the limit was $10,000 per person.  To 2017, the total eligible amount per single person household is $52,000.  For married/coupled household total eligible amount is $104,000.

The above information only deals with TFSAs as a single entity of financial formulas for households.  What is not mentioned is the impact TFSAs (not counted as income) have on other income sources for single person versus married/coupled households.

TFSA Benefits Married/Coupled Households and Wealthy Most for OAS and Total Income

Contributions to a TFSA come from after tax income and are not deductible for income tax purposes. Any amount contributed as well as any income earned in the account (for example, investment income and capital gains) is generally tax-free, even when it is withdrawn.  When withdrawals occur, contributions can still be made up to maximum TFSA contribution room.  Therefore, it is possible to have huge TFSA accounts and still receive full Old Age Security (OAS) supplements without OAS clawbacks (oas-clawback-outrageously-beneficial addendum) and oas-clawback-outrageously-beneficial).  The clawback of OAS benefits in 2016 starts with a net income per person of $73,756 (couple $147,512) and completely eliminates OAS with income of $119,615 (couple $239,230).  OAS is supposed to support those with low incomes, not the wealthy.  Furthermore, even while receiving OAS times two for married/coupled family unit, each spouse can still contribute $11,000 per year to TFSA accounts and pay less tax because they can pension split.  

TFSA Benefits Surviving Spouse over Singles

A TFSA holder can name a spouse or common-law partner as the “successor holder” in the TFSA contract.  On the death of the holder, the spouse becomes the new holder, keeping the tax exempt status of the TFSA.  This will not affect the TFSA contribution room of the spouse.  The Income Tax Act only allows the tax exempt status of the TFSA to be passed on to a spouse or common-law partner who is a successor holder, which differs from a beneficiary.  If some other person is named as a beneficiary of the TFSA, the account will no longer be a TFSA.

If a surviving spouse/common-law partner receives proceeds from the TFSA, the proceeds can be used to make an exempt contribution to the survivor’s TFSA, and not affect the contribution room of the survivor, as long as it is done before the end of the first calendar year following the holder’s death (rollover period), and it is designated as an exempt contribution in the survivor’s income tax return for the year the contribution was made (taxtips).

So, if spouse is deceased in 2017, in future years surviving spouse (widowed) through exemption can:

  • keep all of previous TFSA proceeds achieved as a married/coupled household
  • accumulate investment income on total TFSA achieved as a couple
  • continue to make full TFSA contributions as single person household.

Potential Investment Income

If one considers that earning potential for the wealthiest occurs for thirty years between ages of 30 to 60, then in 2017, the TFSA potential principal for married/ coupled household is $100,000+, in 2027, $200,000+, and in 2037, $300,000+ not including investment income.

Using the ‘rule of 72’, a simple calculation of possible investment income is as follows: money invested at 7% will double in 10 years, if invested at 10% it will double in 7 years.  A modest and achievable interest of 3.5% annually means money will double in about twenty years.

If $11,000 TFSA is invested for one year at 3.5% annual interest, it will double in about twenty years to $22,000.  If $11,000 is invested every year for 30 years at a 3.5% return, it will be worth $568,893.  These simple examples show the potential TFSA principal and investment asset for a surviving spouse whose partner is deceased after thirty years, all of which is tax free and will not affect OAS if income is less than $73,756 per year as the survivor spouse.

CONCLUSION

There can be no doubt TFSAs benefit widowed,  married/coupled households and the wealthy over single person and poor family households.  To correct the financial inequality and discrimination, a cap needs to be placed on total monies in TFSA accounts.  Clearly, financial formulas need to be revised to include assets such as TFSAs before OAS payouts are allowed.  To compensate for huge TFSA assets for widowed, married/coupled households and the wealthy, OAS payouts should be reduced or eliminated from these households, and transferred to single person and poor family households below certain income thresholds.  Regardless of marital status (single, divorced, widowed, or married) all retirement security programs such as OAS should include assets, not just income as determination of eligibility for OAS.

GRAPHS SHOWING PRINCIPAL AND INTEREST ON MAXIMUM TFSA CONTRIBUTIONS FOR MARRIED/COUPLED HOUSEHOLDS VERSUS SINGLE PERSON HOUSEHOLDS

See next page.

tfsa principal and interest 30 yrs

TAXES: FLAT VS. PROGRESSIVE AND DEBUNKING “THE TAX SYSTEM EXPLAINED IN BEER”

TAXES:  FLAT VS. PROGRESSIVE AND DEBUNKING “THE TAX SYSTEM EXPLAINED IN BEER”

(These thoughts are purely the blunt, no nonsense personal opinions of the author about financial fairness and discrimination and are not intended to provide personal or financial advice.)

Prelude:  Yet again, the tax system explained in beer story is used to ludicrously and simplistically explain the tax system, and no less by the USA White House.  We have been wanting to do a blog post on flat and progressive tax systems comparisons, so here it is. 

The story about “The tax system explained in beer” (democratic) has been flitting around the internet since 2001.  Apparently no author can be identified for the article. The analogy makes the argument that since wealthy people pay the most in taxes, they will also receive the most benefit from a tax cut. It also suggests that wealthy people will leave the US if they are made to pay more in taxes.

It appears that how the reader interprets the article is based on ‘right’ or ‘left’ political thinking, flat versus progressive taxation systems and social democracy or not.

On October 30, 2017 Sarah Huckabee Sanders, USA White House Press Secretary began her daily press briefing pitching USA Trump tax cuts by reciting the article.  Then she said,  “And that, ladies and gentlemen, is how our tax system works,” Sanders continued. “The people who are being paid the highest taxes will naturally benefit from a tax reduction but not the largest benefit. Taxing them too much and they might start drinking overseas where the atmosphere is somewhat friendlier. This is a silly story but it illustrates a very important point. Our tax cuts and reforms will create a fair system that works better for everyone. It will make our country the friendliest in the world for American families trying to build a better life for their children. And for American companies seeking a competitive edge. I will be happy to get that story to everybody so you can get those numbers later. Again, I know that may be an oversimplification but it paints a very good picture of the tax system.”

From the analogy the information is condensed as follows, ‘the premise is every day ten men go out for beer and the bill for all ten comes to $100.  If they paid their bill the way we pay our taxes, it goes something like this…’ (first four people are the poorest).  Based on their incomes, the ten men would pay:

  • The first four men (poorest) would pay   $  0
  • The fifth would pay                                  $  1
  • The sixth would pay                                $  3
  • The seventh would pay                           $  7
  • The eighth would pay                              $12
  • The ninth would pay                                $18
  • The tenth man (richest) would pay          $59  (for a total of $100)

Everyone is happy with this arrangement, until the owner throws them a curveball. Because they are such good customers, he reduces the bill to $80.  It is decided it would be fair to reduce each man’s bill by a higher percentage the poorer he was, to follow the principle of the tax system they had been using, so each man would now be paying:

(Blog author comment:  Truly funny, the totals add up to $79, not $80, so it appears the bar tender will be short changed by $1.)

  • First four persons        $  0
  • Fifth person                 $  0 (100% saving on prior payment)
  • Sixth person                $  2 ( 33% saving)
  • Seventh person           $  5 (28% saving)
  • Eighth person              $  9 (25% saving)
  • Ninth person                $14 (22% saving)
  • Tenth person                $49 (16% saving) for a total of $79

However, the men begin to compare their savings with those who get the least in percentage of savings complaining the most.

The wealthy get all the breaks. Wait a minute, yelled the first four men, we didn’t get anything at all. This new tax system exploits the poor. The nine men yelled at the tenth and made him feel bad so the next time the tenth man didn’t show up for drinks and the nine sat down and had their beers without him. When it came time to pay the bill, they discovered something important. They no longer had enough money between them all to even cover half of the bill.

For those who understand, no explanation is needed. For those who do not understand, no explanation is possible.’  (End of analogy).

Reader comment:  ‘Yes, the perilous story of the wealthy person who will leave it all behind if the taxes go a percentage point too high…all his businesses, his customers and his suppliers, all his family, his home, his social networks, his local culture, his kids schools, why he’ll just pick up all of that and magically whisk it away to some other place with a lower tax burden for free.  The only thing the story is missing to start with is “Once upon a time…” like all fairy tales’.


ANOTHER EXPLANATION OF THE ABOVE ANALOGY

Taken from the following article:   “SA Tax System Explained Through Beer” (based on South African Rand) tax-system-explained-through-beer

‘Economies are not one-liners. We’re talking about systems here – and you can’t talk about taxation and spending without talking about “where did the money come from”.

So let me attempt to re-tell that parable.

Ten Men Walk Into A Bar…And One Of Them Owns The Brewery.  Suppose that every day, ten men go out for beer and the bill for all ten comes to R100.  If they paid their bill the way we pay our taxes, it would go something like this:

  • The first four men (poorest) would         R  0
  • The fifth would pay                                 R  1
  • The sixth would pay                                R  3
  • The seventh would pay                           R  7
  • The eighth would pay                              R12
  • The ninth would pay                                R18
  • The tenth man (richest) would pay          R59 (for a total of R100)

So, that’s what they decided to do.

There are many reasons why the richest man agreed to pay the bulk of the bill, but the important one is that he owned the only brewery in town, and the barman would buy all the beer from him.

The seventh, eighth and ninth men all worked in the brewery, and earned salaries according to their skill level. The sixth and fifth men owned farms which supplied the hops – although they didn’t earn particularly well, because the brewery was the sole buyer and it negotiated quite stiff rates.

The remaining four men were farm labourers who earned enough to eat, but not enough to drink.

The way that the brewery man saw it: the drinks must flow in order for the barman to be in business and sell the beer that the brewery produced.

The ten men were also very protective of their beer industry, and would run any newcomers out of town. This meant that the ten men were the only real regulars at the bar, and the only real source of its income.

So to keep the bar in business and the town happy and the drinks flowing, the richer men would pick up most of the tab. And happily, most of the bill would end up back in the brewery man’s hands anyway.

So the ten men drank in the bar every day and seemed quite happy with the arrangement, until one day, the barman threw them a curveball. “Since you are all such good customers,” he said, “I’m going to reduce the cost of your daily beer by R20”. Drinks for the ten men would now cost just R80.

What he didn’t say is that there had been a bumper season of barley, so the brewery had produced its beer fairly cheaply that month – and the brewery owner had offered the barman a substantial discount on the beer in order to get rid of it.

The group still wanted to pay their bill the way we pay our taxes. So the first four men were unaffected. They would still drink for free. But what about the other six men? How could they divide the R20 windfall so that everyone would get his fair share?

They realized that R20 divided by six is R3.33. But if they subtracted that from everybody’s share, then the fifth man and the sixth man would each end up being paid to drink his beer.

So, the bar owner suggested that it would be fair to reduce each man’s bill by a higher percentage the poorer he was, to follow the principle of the tax system they had been using, and he proceeded to work out the amounts he suggested that each should now pay.

And so

  • The fifth man, like first four, now paid           R  0 (100% saving)
  • The sixth instead of R3 now paid                 R  2 (33% saving)
  • The seventh instead of R7 now paid            R  5 (28% saving)
  • The eighth instead of R12 now paid             R  9 (25% saving)
  • The ninth instead of R18 now paid               R14 (22% saving)
  • The tenth instead of R59 now paid               R49 (16% saving) for total of R79

Each of the six was better off than before. And the first four continued to drink for free.  But, once outside the bar, the men began to compare their savings.

“I only got a dollar out of the R20 saving,” declared the sixth man. He pointed to the tenth man,”but he got R10!”

“Yeah, that’s right,” exclaimed the fifth man. “I only saved a rand too. It’s unfair that he got ten times more benefit than me!”

“That’s true!” shouted the seventh man. “Why should he get R10 back, when I got only R2? The wealthy get all the breaks!”

“Wait a minute,” yelled the first four men in unison, “we didn’t get anything at all. This new tax system exploits the poor!”

In their rage, the nine men decided to boycott the bar.

The next night only the tenth man showed up for drinks so he sat down and had the beer on his own. But when it came time to pay the bill, he discovered something important. 90% of the beer had gone unsold, and the barman was threatening to return the stock to him in the morning.

And if the situation remained unchanged, then the barman was planning to shut up shop, and the brewery would have to close, and then everyone would be without jobs.

And that is how our economy works. The people who already pay the highest taxes will naturally get the most benefit from a tax reduction, but the wealthy also have a vested interest in keeping consumers at the table.

That consumption drives the economy and gives value to the businesses that they own. And the hard truth is: if anyone decides to leave the table, then it’s likely that everyone will lose. And it’s really hard to keep everyone happy.

It’s complicated.’ (End)

EXAMPLE OF PROGRESSIVE FEDERAL AND PROVINCIAL 2017 FOR ALBERTANS

For this blog author, the initial article is based on true stupidity and over simplification of the tax system.  In this blog article, an example is used to explain the Canadian and provincial tax system based on a progressive tax system versus a flat tax system. These calculations are examples only.  Also, final taxes will vary based on personal deductions, other deductions, tax credits and loopholes not included here.

The following information outlines the 2017 progressive tax system for Canadian and Alberta families of two or more using 2011 Stats Canada information on incomes for Quintile 1 to 5.  For the tax calculation, the highest income for Quintile 1 to 4 rounded off was used plus an arbitrarily assigned income of $350,000 for Quintile 5.

CANADIAN DISTRIBUTION OF INCOME (from MoneySense 2015 All Canadian Wealth test (moneysense.ca/save/financial-planning/the-all-canadian-wealth-test-2015/)


  • Quintile 1 up to $38,754
  • Quintile 2 $38,755 to $61,928
  • Quintile 3 $61,929 to $88,074
  • Quintile 4 $88,075 to $125,000
  • Quintile 5 $125,001 and over

Upper income point of quintiles

  • Quintile 1 $  39,000
  • Quintile 2 $  62,000
  • Quintile 3 $  88,000
  • Quintile 4 $125,000
  • Quintile 5 $350,000 (arbitrarily assigned value)

tax


ANALYSIS

First, it must be stated that all persons identified in the quintiles will not pay the full tax shown in the table since personal deductions, other deductions and tax credits have not been applied.  Also, the ability to use tax loopholes and credits, (more likely to benefit wealthy the most) have not been applied.  Examples are TFSAs (no tax savings on principal amounts, but savings are realized on tax free investments and interest earned on principal) and RRSPs (reduced taxes on employment income for yearly RRSP amounts, but will pay taxes on withdrawals from RRSP, for example, in retirement when income is likely to be less than when employed).  Combined principal amounts for TFSAs for couples now totals almost $100,000 (tfsa-boondoggle-for-singles-and-low-income-canadians).  It is almost 100% certain that couple earning $39,000 will not be able to contribute to TFSAs and RRSPs.

Also, calculations are based on the combined total income for one or two earners in family of two or more.  Taxation will vary based on income earned by each spouse and tax rules for family income.

It is interesting to note percentage of after tax income without application of any other deductions for Quintile 1 to 4 families of two or more persons averages between 70% and 75%, while percentage of after tax income for the richest Quintile 5 $350,000 arbitrarily assigned income for family of two or more is about 60%. The 60% after tax income, however, will increase substantially with the deductions, and tax avoidance, loopholes and credits that wealthy are able to use.

After tax income with no deductions for family of two or more earning $350,000 will be at least $211,078 or $17,590 per month (as compared to only approximately $2,400 per month for Quintile 1 family of two or more persons).  Families earning $39,000 with equal incomes between the spouses at 2,000 annual worked hours each works out to about $10/hr.

If 2015 old flat tax rate of 10% for Alberta is applied to Quintile 5 person earning $350,000 the total tax would only be $35,000 instead of $43,383.  What a difference a progressive tax makes!  The average person does not understand that the first dollar earned is taxed lower than the last dollar earned in the progressive tax system.  The person earning $350,000 pays the exact same tax on the first $125,000 of pay as the person making only $125,000.  That is what makes progressive taxes fair.

From MoneySense article the top income for unattached individuals for Quintile 1 is $18,717 (as compared to $38,754 for family two or more persons), Quintile 2 $23,356 ($61,928 for family two or more persons), Quintile 3 $36,859 ($88,074 for family two or more persons), Quintile 4 $55,498 ($125,000 for family two or more persons), and Quintile 5 $55,499 and over (over $125,000 for family two or more persons).  Analysis shows incomes of families of two or more are at least double or more to that of unattached individuals.  It is almost 100% certain that unattached individuals in Quintiles 1, 2 and 3 will not be able to save by contributing to TFSAs and RRSPs (unless RRSP is a forced contribution through employer).

Income does not include assets that the upper class and wealthy might have such as paid for $600,000 and up housing, investments, etc.

CONCLUSION

Michael Lewis, author of “The Undoing Project” book, describes how a Nobel Prize-winning theory of the mind altered our perception of reality.   Two Israeli psychologists, Daniel Kahneman and Amos Tversky’s work created the field of behavioral economics which revolutionized thinking of how the human mind works when forced to make judgements in uncertain situations.  An example is outcomes of surgery where there might be a 5% chance of death versus 95% chance of surviving the surgery.  When patients are presented with 95% chance of survival rate rather than 5% death rate, they are more likely to go through with the surgery.  The same judgement should apply to tax system based on beer analogy.

For upper class and wealthy, please don’t ‘cry me a river’.  Wealthy need to look at what they have left after taxation instead of what is being taken from them in taxation.  Only when all the tax loopholes, offshore tax havens, and privileging through tax credits like Tax Free Savings Accounts TFSAs that benefit wealthy the most are eliminated so that there is a level playing field and fairness between poor and wealthy, only then can the wealthy ever complain that they are being taxed unfairly.

The wealth gap between the rich and poor needs to be lessened by increasing the minimum wage to an indexed living wage and eliminating the tax deductions, loopholes and tax credits that benefit the wealthy the most (selective-democratic-socialism).

Regarding the ‘The Tax System Explained in Beer’ analogy, we will take the South African Rand analogy as being the more accurate of the two analogies, thank you very much!

Postscript: For those who wish to read more on the debunking of tax system explained in beer analogy, the following online article and reader comments is a great one – (Reality) Check, Please:  Why the Restaurant Analogy Doesn’t Work (Restaurant-Analogy-Doesnt-Work).

UPDATE OCTOBER 31, 2018 – We are very grateful to a reader who pointed out that an error was made in the calculation of information in the table.  The table has been updated.  The update decreases the tax that is paid in the $350,000 Alberta income category.

(This blog is of a general nature about financial discrimination of individuals/singles.  It is not intended to provide personal or financial advice.)

INCOME SPRINKLING PROMOTES FINANCIAL DISCRIMINATION OF SINGLE MARITAL STATUS ENTREPRENEURS

INCOME SPRINKLING PROMOTES FINANCIAL DISCRIMINATION OF SINGLE MARITAL STATUS ENTREPRENEURS

(These thoughts are purely the blunt, no nonsense personal opinions of the author about financial fairness and discrimination and are not intended to provide personal or financial advice.)

Opening statement:  Here we go again, yet another financial program that financially discriminates against singles.  Most singles, especially those who are not entrepreneurs, would not be aware that married entrepreneurs with and without children are able to do this type of tax manipulation.  The article “What the new ‘income sprinkling’ rules mean for tax planning” has been reproduced in its entirety to educate the reader on what ‘income sprinkling’ is all about.  “Income Sprinkling’ has been added as an example to Marital Manna Benefits and Marital Privileging section outlined in the feature post of this blog SIX REASONS WHY MARRIED/COUPLED PEOPLE ARE ABLE TO ACHIEVE MORE FINANCIAL POWER (WEALTH) THAN SINGLES (financial-power)

WHAT IS INCOME SPRINKLING?

“What the new ‘income sprinkling’ rules mean for tax planning” by Jamie Golombek (new-income-sprinkling-rules)

Small business owners, including incorporated professionals such as doctors, lawyers, accountants and others, will likely face a higher tax bill in the years ahead as a result of (Liberal) Finance Minister announcement this week targeting several common, and until now, perfectly legal, tax strategies used in conjunction with private corporations.

The strategies under attack can be categorized into three main areas: income sprinkling, earning passive investment income in a corporation and converting a corporation’s ordinary income into tax-preferred capital gains.

Among these changes, it’s the first one — income sprinkling — which is perhaps deemed the most offensive of the three and the one that will likely have the broadest financial impact on small business owners and incorporated professionals.

While there are various legal and government-sanctioned forms of income splitting, the most common one being the splitting of pension income or RRIF withdrawals (after age 65) with a spouse or partner, the Finance Minister chose the term “income sprinkling” rather than income splitting to describe how some families use private corporations to sprinkle income among family members. In a typical example, dividends that would have been received by the primary owner/manager of the private corporation, say, mom or dad, would instead be paid to the spouse, partner or kids of the primary shareholder, who are often in lower tax brackets than the primary owner/manager and thus the family’s total tax bill would be reduced.

This result stems from the fact that Canada taxes us on an individual basis, rather than as a family unit and imposes progressively higher tax rates on each individual, such that the higher your personal income, the higher your rate of tax. Canada also allows each individual a basic personal amount (equal to $11,635 in 2017) which effectively allows every Canadian to receive at least the first $11,635 tax-free.

Private corporations can pay dividends to family members who, if they have no other income, can use their basic personal amounts to shield such income from tax. For example, in Ontario, an individual with no other source of income could receive about $51,000 in eligible dividends without paying a cent of federal or provincial tax. In many corporate structures, it’s typical for the common shares to held by a family trust in which the spouse and the kids of the owner/manager are the beneficiaries and the trustee has discretion as to which beneficiary receives dividends each year and how much each receives.

As the government noted in its discussion document, “The income distributed to the family member may exceed what would have been expected, having regard to the family member’s labour and capital contributions to the business, in arrangements involving arm’s-length investors.”

Of course not all private corporations are engaged in income sprinkling as it typically only provides meaningful benefits when the family member that receives the “sprinkled” income is either in a lower tax bracket than the owner/manager or has tax deductions or credits, including the basic personal amount or tuition carryforwards, which otherwise would go unused.

In addition, the tax savings achieved through an income sprinkling plan must be material enough to justify both the initial and ongoing transaction costs associated with most income sprinkling arrangements, which often involve the setup and maintenance of a discretionary family trust and in some cases, multiple classes of shares.

When it comes to income sprinkling of salary income, the current tax rules are quite strict in that the Income Tax Act only permits “reasonable” amounts to be deducted from the corporation’s income when salary or management fees are paid to employees, including family members. This rule is meant to prevent a parent who owns a corporation from paying his spouse or child an annual salary when he or she doesn’t actually perform any work or provide services to the business.

When it comes to dividends, however, there is no reasonableness test in that anyone who owns share of the corporation may receive dividends. There is, however, a special tax known as the “kiddie tax” which came into place in 1999, to prevent income splitting with minor children (i.e. kids under the age of 18). Prior to this tax, known formally as “tax on split income” (TOSI), it was quite common for private companies to pay tens of thousands of dollars in dividends to toddlers, which would effectively be received tax-free as the kids would use their basic personal amount to shelter this income from tax.

The TOSI regime killed this planning nearly two decades ago by subjecting dividends from private company shares paid to minor kids to top, highest-rate taxation and denying the use of personal tax credits (other than the dividend tax credit) to shelter such amounts.

However, as the government noted, the current TOSI rules do not fully respond to income sprinkling involving adult family members. In its paper, the government took a close look at the age of individuals who reported non-eligible dividends on their tax returns. (Non-eligible dividends are generally dividends paid on private company shares from income eligible for the small business rate.) The government found that in each year reviewed, the amount of non-eligible dividends reported by those aged 18-21 exceeded both the amounts earned by the 22-25 and 26-29 age groups. As the government wrote, “this anomaly in the distribution suggests the presence of dividend sprinkling, because the tax benefits of income sprinkling are higher, on average, when adult children of high-income filers are younger and have lower income.”

As a result, this week the government announced proposed changes, to be effective in 2018, to extend the TOSI to certain adult individuals. Under the proposed new rules, an adult family member will be expected to contribute to the business, either in labour or capital, in order to be exempt from the TOSI on income received. In other words, the amount received by such adult family members must be “reasonable.” There is a stricter test for 18-24 year olds. In a nutshell, if the amount isn’t reasonable, then a top rate of tax will apply, putting an end to current strategy of dividend sprinkling among non-involved family members.

OPINION LETTER SUBMITTED BY AUTHOR TO MAJOR LOCAL NEWSPAPER – NOT PUBLISHED

Tax fairness proposals always stir up hornet nests for tax manipulators.

Fact check:  married or partnered persons with and without children have financial power to gift money to spousal RRSP, loan money to spouse at CRA 1% rate, contribute to and compound RRSP and TFSAs times two and pension split while singles never married or partnered, no kids get nothing comparable.  Plus incorporated married/partnered entrepreneurs can ‘income sprinkle’ to avoid taxes.

Journalists like the one who published “Big government has small business in its sights” malign unions, but incorporated business persons may have spouses who are union employees.  Union employees cannot tax manipulate.

Since singles in their financial circle are basically financially responsible to themselves (no spouse, no children),‘Income sprinkling’ is of likely of little benefit to single marital status entrepreneurs so they will pay more tax.  Tax fairness needs to be ensured regardless of marital status and how income is earned.

COMMENTS

Financial discrimination example of singles before retirementIncome sprinkling as outlined above.  Excerpt from above article states:  ‘The government found that in each year reviewed, the amount of non-eligible dividends reported by those aged 18-21 exceeded both the amounts earned by the 22-25 and 26-29 age groups. As the government wrote, “this anomaly in the distribution suggests the presence of dividend sprinkling, because the tax benefits of income sprinkling are higher, on average, when adult children of high-income filers are younger and have lower income.” ‘

Financial discrimination example of singles after retirement – Various legal and government-sanctioned forms of income splitting, the most common one being the splitting of pension income (family-tax-credits) or RRIF withdrawals (after age 65) with a spouse or partner leave singles (never married, no children and divorced) out of the financial equation.

When governments regardless of political party bring in unfair tax programs, and then later try to eliminate or change them to promote financial fairness, this is usually meant by profound resistance especially by those who benefit most from the programs (most likely wealthy since they benefit most from tax manipulation).

It is also interesting to note the various comments columnists and opinion writers have submitted on income sprinkling issue.  One columnist went so far as to say that this should be taken on as a feminist issue since the spouse, more likely to be female, supports their partner.  This author responded to the columnist by letter stating that if she wants to play the feminist card, then singles would like to play the ‘singlism’ card, since singles likely do not benefit at all from ‘income sprinkling’.

It is the opinion of this author the Finance Minister in this case was actually doing the right thing by levelling the financial playing field for ‘income sprinkling’.  The final outcome of this financial policy is yet to be determined.

(This blog is of a general nature about financial discrimination of individuals/singles.  It is not intended to provide personal or financial advice.)

POOR ALWAYS PLACED AT A DISADVANTAGE

POOR ALWAYS PLACED

(These thoughts are purely the blunt, no nonsense personal opinions of the author about financial fairness and discrimination and are not intended to provide personal or financial advice.)

The columnist’s opinion letter prompted the author to submit an opinion letter to a major local newspaper which was published.  Due to space and time constraints the last statement of the author’s opinion letter can be interpreted in several ways.  The conclusion discusses these interpretations.

COLUMNIST’S OPINION LETTER PUBLISHED IN MAJOR LOCAL NEWSPAPER

RE: Government hypocritical on minimum wage, Oct. 2. (hypocrisy)

‘What sort of person could possibly begrudge someone getting a raise when they only make 12 lousy bucks an hour?

Probably someone who’s been hanging onto the coattails of the deep thinkers over at the Fraser Institute, or maybe ingratiating themselves with those tall foreheads inhabiting the C.D. Howe playpen. Such folks talk as though the blood drained from their thin veins a long time since.

Nope, here in Calgary, on this glorious fall morning, some fine people will be starting work with an extra spring in their collective step, knowing a nice $1.40-an-hour raise is coming, with the minimum wage jacked up to $13.60, alongside the promise it’ll hit $15 in another year.

I wish them well and, honestly, a veritable pox on those who’d deny them otherwise.

Of course, some small-business owners might decide they can’t afford this new, higher wage, so instead, they’ll work extra unpaid shifts themselves and maybe cut some poor soul from the payroll altogether. No blame should be levied there, either. Walk a mile in those shoes.

Oh, then there are those big, international corporations – the McDonald’s and Amazons of this increasingly global and heartless world. The more the cost of labour goes up, then the more bottom-line reasons to invest in robots and automation. Such reactions are inevitable – on a worldwide scale, it’s why we don’t produce much of our electronic gadgets, clothes or food because someone, somewhere, does it much cheaper, and the price we’re willing to pay supersedes patriotism everytime and everywhere.

Countless economic studies – conducted, of course, by those who’ve never seen a minimum wage pay packet since mommy and daddy shelled out for that first go-round of college – have never successfully nailed the effect of such ordained raises on subsequent employment. Usually, the conclusions mirror the political viewpoint of the group paying for the study.

Let’s face it: any relevant data here in Calgary to be gleaned in the upcoming 12 months after this latest increase would be washed away in the wake of a jump to $70 in the price of a barrel of oil. There are too many factors involved, so politicians merrily fill the gap…..

…..Politicians love spouting one-sided rhetoric. Take Alberta’s NDP Labour Minister who’s pushing this minimum wage strategy.

“Through talking to economists, business people, low wage workers and other stakeholders, we’ve come to the decision all hard-working Albertans deserve enough to support themselves.”

Hypocrite is what I say to her and all the rest of the dreary clan on both the provincial and federal stage. Because if $13 bucks an hour is not a living wage – and I wouldn’t argue otherwise – then why do these people steal from those poor souls making such a pittance?

They call it taxation. On the federal level, you start paying tax at about $12,000 a year. So, assuming you make a paltry $13 an hour and work 40 each week, your annual income is about $27,000 a year. Oh yes, Ottawa wants its sweet pound of that sad flesh.

Now the NDP Labour Minister and her saintly crew aren’t quite as grasping, to be fair, but once $15 an hour is reached, then the yearly sum will be over $30,000 and a third will be subject to provincial income tax.

So what sort of person gets up on a platform with flunkies to the right and hangers-on to the left and proceeds to lecture everyone about how the lower paid need a living wage and then takes part of such an increase and pockets it themselves? After all, where does a politician’s salary come from if not from tax revenue?

What sort of person? A politician, that’s who.’

BLOG AUTHOR’S OPINION LETTER PUBLISHED IN A MAJOR LOCAL NEWSPAPER

The columnist calls the NDP Labour Minister hypocritical for pushing the minimum wage strategy.  He states government through taxation steal from those poor souls making such a pittance.

Fact check:  when the almighty Alberta Conservatives (financial-discrimination-based-on-minimum-wage-controversy) brought in the flat income tax, they raised the provincial tax from 8% to 10% for the lowest income level.  The poor never had an Alberta Advantage.

Fact check:  those with low lifetime income will have a pittance of CPP pension retirement pillar (canada-pension-plan) because CPP contributions are based on wage levels.

Politicians, corporations and the wealthy always win because they pull the financial purse strings.

CONCLUSION

Because of time and space constraints the last statement  ‘Politicians, corporations and the wealthy always win because they pull the financial purse strings’ would likely leave the reader thinking this blog author was agreeing with the columnist regarding taxation, minimum wage, and NDP hypocrisy.  The columnist fails to mention the Alberta NDP also replaced the Conservative Party flat tax with a progressive tax system while increasing the minimum wage.

It is the opinion of this author that the Alberta Conservative Party when implementing the flat tax placed low income persons at a financial disadvantage while benefitting the wealthy more.  The Alberta NDP has, in fact, done the right thing by replacing the 10% flat tax with a progressive tax and at the same time increasing the minimum wage incrementally to $15 per hour.  The poor will receive an increase in income (impact-on-cpp-enhancements) at same time the wealthy will pay more tax.  By increasing the minimum wage for the poor and tax for the wealthy, the unfair financial spread between the two groups is narrowed.

ALBERTA PROGRESSIVE TAX  2017 IMPLEMENTED BY ALBERTA NDP PARTY

  • First $126,625 10%
  • >$126,625 to $151,950 12%
  • >$151,950 to $202,600 13%
  • >$202,600 up to $303,900 14%
  • >$303,900 15%

CANADIAN FEDERAL PROGRESSIVE TAX 2017

  • 15% on the first $45,916 of taxable income, +
  • 20.5% on the next $45,915 of taxable income (on the portion of taxable income over $45,916 up to $91,831), +
  • 26% on the next $50,522 of taxable income (on the portion of taxable income over $91,831 up to $142,353), +
  • 29% on the next $60,447 of taxable income (on the portion of taxable income over $142,353 up to $202,800), +
  • 33% of taxable income over $202,800

(This blog is of a general nature about financial discrimination of individuals/singles.  It is not intended to provide personal or financial advice.)

THE TRUMP’S FINANCIAL DISCRIMINATION OF SINGLES

THE TRUMP’S FINANCIAL DISCRIMINATION OF SINGLES

(These thoughts are purely the blunt, no nonsense personal opinions of the author and are not intended to provide personal or financial advice).

Ivanka Trump in her speech yesterday at the Republican Convention stated that something needs to be done about single women without children being paid more than married women with children.

Some studies also show that women under the age of thirty make more than men and some studies show that employers don’t want to hire married women with children.

There also has been a lot said about women being paid less than men for the same job, married men being paid more than single men.  There is no doubt that there should equal pay for equal work.

Three different sources are outlined below showing the controversy generated by the facts and whether the fact are really true.

From “Workplace Salaries:  At Last, Women on top”, Time magazine, September 1, 2010 (time):

There has been recent evidence in the USA in many of the largest cities that the median income salaries of young women are 8% higher (and in some cases even higher) than men in their peer group.  However, this gap does not apply to rural areas and disappears for older women, married women and women with children.

However, there also are many factors where perception is false because all the facts have not been taken into consideration.  Some of these facts are:

  • Education.  Women are outpacing men in obtaining degrees.
  • Knowledge-based industries.  Larger cities which tend to have knowledge-based industries will have higher pay.  The decline of a manufacturing base in cities may result in lower wages.
  • Minorities.  Hispanic and black women are twice as likely to graduate from college as male peers.

“The holdout cities — those where the earnings of single, college-educated young women still lag men’s — tended to be built around industries that are heavily male-dominated, such as software development or military-technology contracting. In other words, Silicon Valley could also be called Gender Gap Gully.

As for the somewhat depressing caveat that the findings held true only for women who were childless and single: it’s not their marital status that puts the squeeze on their income. Rather, highly educated women tend to marry and have children later. Thus the women who earn the most in their 20s are usually single and childless”.

From “Fact Check:  Do young, childless women earn more than men?”, September 10, 2014 (abc)states:  data does not hold up because median figures don’t compare people who have the same jobs and qualifications.  They are an aggregate of the salaries of all people in a particular cohort; therefore, figures are misleading.

From “Childless Women in their twenties out-earn men.  So?”, Matthew Rouso, February 24, 2014, Forbes (forbes) :

“Statistics show only the average difference between men and women, across all jobs.  It doesn’t control for the types of job, the number of hours worked or for time taken off (to raise children, for example)….There are differences in job types, education levels, hours worked, and other factors that lead to these wage differentials.  But these factors are just as responsible for the overall difference in wages between men and women.  Once you control for factors such as college major, time off of the labor force to raise children, and hours worked per week, the gender wage gap essentially disappears.  A big part of the difference in pay is due to the choice of jobs:  women choose to enter career fields that pay less than those that men choose.   Women are still more like to be Kindergarten teachers while men are more likely to work in finance.  In short, firms aren’t discriminating against women. The reality remains that women, on average, do earn less than men.  But to blame it on discrimination is misguided.

Solutions to the gender wage gap aren’t simple.  Taking time off from a job, or working fewer hours, will reduce one’s earning potential, but many people (rightly) relish the opportunity to take time off to raise children.  There are no easy policy recommendations to deal with the loss of earning power for those who take time off to raise children.  But there is one thing we can do that would decrease the gender wage gap with no negative consequences: ensure that women are encouraged to pursue work in high-paying industries….Women may earn less than men, but causes are more complex than the cries of discrimination we hear from politicians.  When politicians mislead the public on this issue, the consequence is our delay in solving the real problem”.

Comment on Ivanka Trump’s statement:  It is difficult to find the source of her information.  Whatever the source is, what is more disturbing is the continuous reference by politicians and business people to marital status when human rights policies specifically state marital status should not be used in employment.  If Ivanka Trump wants to deal with married women’s pay, then she should address all other employment discrimination such as married men being paid more than single men.

TAX REFORM:  DONALD J. TRUMP FOR PRESIDENT (donaldjtrump)

Donald Trump as part of his bid for President platform has outlined his suggestion for tax reform.  A direct quote from his reform states:

“If you are single and earn less than $25,000, or married and jointly earn less than $50,000, you will not owe any income tax. That removes nearly 75 million households – over 50% – from the income tax rolls…..All other Americans will get a simpler tax code with four brackets – 0%, 10%, 20% and 25% – instead of the current seven. This new tax code eliminates the marriage penalty and the Alternative Minimum Tax (AMT) while providing the lowest tax rate since before World War II.”

Comment of Donald Trump’s Tax Reform:  Here we go again, past posts have shown that cost of living is higher for a single person family unit than a married or coupled family unit without children.  This once again shows the financial illiteracy and ignorance regarding singles’ finances by politicians and business persons.  We do not know all the details of American tax system, but Trump cannot just give a figure for singles, and then multiply it by two for married or coupled family units.  Finances for singles don’t work that way.  The cost of living for a single person is higher than the cost of living for a family unit of two married or coupled persons, so why should married/coupled family units get the benefit of double tax free income?  Marriage penalty???  What about all the marriage benefits that married or coupled family units receive?  He also includes a separate column for head of household in his four tax brackets.  There is no explanation of what head of household includes, so it is difficult to know what this tax group is all about.

Financial discrimination will continue if singles figures are just multiplied by two to arrive at married family unit figures.  When, when are politicians and businessmen going to drop the marital status designation and use family units as the designated standard? Why can’t tax reform be more progressive instead of using same old financially discriminatory practices?

Cost of living equivalence scales such as the square root equivalence scale show that if a value of ‘1’ is used for a single person family unit, then the value of ‘1.4’ is applied to two adults, ‘1.7’ is used for two adults one child, ‘2.0’ is used for two adults two children and ‘2.2’ is used for two adults three children.

CONCLUSION

It is pathetic that marital status continues to be used a standard for tax, hiring and income policies when this is a direct violation of human right and civil rights.  It is absurd how married or coupled family units (including the Trumps) continue to protect their own interests without including all family members in financial formulas and favouring married family units over single person family units.

Ivanka Trump says married women are being paid less than single woman.  If one considers that most of management and business persons who do the hiring and determine the income schedules are married, then married people are the ones guilty of committing the wrongful acts against themselves, so don’t go blaming singles for this! There are many who do not like unions, but at least they pay the same wage for the same work without inclusion of marital and sex status.

Married and coupled women with children want it all.  They want employment time off for their children and then want full compensation even for the years they haven’t been working. If married women take time off to be with their children, they are not going to have the same level of work experience as a single person who has continuously been employed. When are married and coupled women ever going to realize that they can’t have it all while taking singles down to a standard of living that is lower than theirs?

(This blog is of a general nature about financial discrimination of individuals/singles.  It is not intended to provide personal or financial advice).

HOW MANY MORE DECADES WILL IT TAKE TO ERASE FINANCIAL DISCRIMINATION OF SINGLES?

HOW MANY MORE DECADES WILL IT TAKE TO ERASE FINANCIAL DISCRIMINATION OF SINGLES?

These thoughts are purely the blunt, no nonsense personal opinions of the author and are not intended to provide personal or financial advice.

In the discussion of financial discrimination of singles, it is useful to look at the history of financial discrimination.  Two women who were strong advocates of financial equality were Marie Babare Edwards and Vivien Kellems.

Marie Babare Edwards (January 2, 1919-December 31, 2008) , was a psychologist who helped pioneer a “singles pride” movement in the 1970s through her book (co-author Eleanor Hoover), “The Challenge of Being Single,” and workshops she taught died two days before her 90th birthday.  Her 1974 book included a “A Singles’ Lib Manifesto” and spelled out the unfair costs of being single in taxes, the workplace, insurance, and housing.

Divorced after 11 years of marriage and rearing her 9-year old son alone, Edwards found herself suddenly in sync with a third of the adult U.S. population that was single — then 43 million people.

Edwards became a zealous advocate for equal social status for the never or formerly married.

Kay Trimberger, a sociologist and author of “The New Single Woman” (2005), called Edwards forward-thinking, “a pioneer, writing about the social issues of singles before it was popular. For that reason, her writing sort of got lost.”

Edwards considered the book and seminars through most of the 1970s, “my most significant contribution as a psychologist,” she later wrote, because she helped “individuals and institutions appreciate singlehood as an alternate and viable lifestyle.” (She was an extrovert who came close to remarrying several times.)  (latimes)

Vivien Kellems (1896-1975), tax resister, feminist,  industrialist and runner as a senator, fought for numerous causes during her lifetime. While she believed in equality for women (in the workplace and in the home), and she proved an avid supporter of a woman’s right to vote.  However, some of her most contentious fights were  Kellems’ highly publicized battles with the Internal Revenue Service(IRS).

Already a prominent industrialist in Connecticut, she waded into the fight for the Equal Rights Amendment.  In stating her case, she put forward her own brand of individualist feminism. By contrast, many “social feminists” at the time such as Eleanor Roosevelt opposed the ERA because it would strike down “protective legislation” for women. In 1943, Kellems asked “what are you going to do with all these women in industry? If we’re good enough to go into these factories and turn out munitions in order to win this war, we’re good enough to hold those jobs after the war and to sit at a table to determine the kind of peace that shall be made, and the kind of world we and our children are going to have in the future.”

In the years that followed, Kellems continued to battle the IRS.  Protesting that tax laws unfairly penalized unmarried individuals, Kellems never filled out another tax return. She, instead, signed blank returns every year and sent them to the IRS. She continued her fight for tax law reform right up until her death in 1975. (connecticuthistory and historynewsnetwork)

MORAL OF THE STORY

Kellems’  fight for financial equality covered several decades, notably the 1940s to the 1970s.  Marie Babare Edward’s book in 1974 was published about forty years ago.

So how far have we come in the last sixty to seventy years in eliminating financial discrimination of singles (‘ever’ singles and early divorced)?

In Canada, while we do have equality in taxes being equal for individuals regardless of marital status, we do not have equality in singles receiving benefits equal  to marital  benefits and equal inclusion in financial formulas with married/coupled persons and widowers.

Much work still needs to be done.  The question is how many more decades is it going to take to have true financial equality for singles?

This blog is of a general nature about financial discrimination of individuals/singles.  It is not intended to provide personal or financial advice.

EVALUATION OF MONEYSENSE ARTICLES RE THE COST OF RETIRING WELL: COUPLES VERSUS SINGLES, DECEMBER, 2014 AND JANUARY, 2015.

EVALUATION OF MONEYSENSE ARTICLES RE THE COST OF RETIRING WELL:   COUPLES VERSUS SINGLES, DECEMBER, 2014 AND JANUARY, 2015.

These thoughts are purely the blunt, no nonsense personal opinions of the author and are not intended to provide personal or financial advice.

SOURCES OF INFORMATION FOR THIS BLOG POST

MoneySense, December, 2014, “The Cost of Retirement Happiness” by David Aston (couples) /the-cost-of-retirement-happiness/

MoneySense January, 2015, “Single Retirees: The Power of One” by David Aston (singles) /single-retirees-the-power-of-one/

Kudos to MoneySense-they are one of the few sources of information that identify what it truly costs singles to live in comparison to married/coupled persons.

——————————————————————————————————————–

The above articles for couples and singles were presented in two different timeframes by MoneySense.  financialfairnessforsingles.ca thought it would be an interesting exercise to combine the figures from both articles and complete an analysis of the figures for the married/coupled retirees versus the singles retirees.  (It is important to note that the definition of ‘single’ status by MoneySense is not the same definition used by financialfairnessforsingles.ca and Statistics Canada.  The only person who is truly single in the six profiles is Spencer as an ‘ever’ single person (never married, no children), while Reynolds is divorced and McDonald is widowed.  This is based on and justified by the Canadian Income Tax forms where the status of the tax filer has to be entered re status of married, single, divorced/separated or widowed and Statistics Canada definitions of marital status).

MoneySense Comments on Retirees Incomes

Couples – According to MoneySense author, a couple should be able to have a middle-class retirement lifestyle spending $42,000 to $72,000 a year including income taxes and assuming there is a paid-for home and no debt.  After tax, that will leave about $38,000 to $62,000 a year to spend as couples choose.  The minimum of about $38,000 (excluding taxes) should be sufficient to cover the basics, including operating a car and eating healthy.  Money Coaches Canada advises keeping annual spending on the basics within the $25,000 to $35,000 range, while trying to ensure there is at least $10,000 for extras, (Dec. /14, article).

Singles – According to MoneySense author, a middle class single retiree should count on spending approximately $30,000 to $50,000 a year including taxes and assuming there is a paid-for home and no debt.  This is about 70% of what is required for a couple since it costs about 70% of the couple’s rate for a single to maintain the same lifestyle as a couple.

For $30,000 income, taxes would be about $2,000 to $3,000 for older singles and $3,800 to $5,100 for younger singles below age 65.  After taxes and if budget is tight, singles should allow at least $20,000 to $25,000 a year for the basics (including shelter, groceries, transportation and clothing) and at least $5,000 for the extras like entertainment and travel, (Jan. /15, article).

Detailed Financial Information

Couples

Case #1 – It is stated that the Taylors live frugally but comfortably.  They have a paid-for three-bedroom home in a nice neighborhood and a ten-year old mid-level car. They eat out occasionally and take regular vacations.  They spend just over $25,000 on the basics, which leaves enough left over to spend almost $12,000 on the extras.  They both have university educations and held high-paying jobs in the technology industry while raising one child, who now lives independently.  Their modest spending habits allowed them to build their savings quickly while working, so they were able to retire in their early 50s and have a large nest egg.

Many advisers tell prospective retirees that they need to replace 70% to 80% of the peak income they had while working, but the Taylors live on less than 20% of the $250,000 they earned while working.

Case #2 – The Statscan couple depicts the average spending by senior couple.  (Source: Statistics Canada, Survey of household spending in 2010) plus inflation adjustments using the Consumer Price Index.

Case #3 – The Coopers, both close to 70, have lots of money to do the things they consider important, but don’t live a lavish lifestyle.  They spend modestly on the basics, which leaves plenty for the extras that give them the most satisfaction, like travel.  Their basic spending, at just under $45,000, isn’t much more than that of the Statscan couple.  But by economizing on the basics, they can afford to spend about $36,000 on the extras.  They learned frugality early on in life.  During their working years, they lived on his public sector professional salary while she had primary responsibility for the household and raising three children.  They also benefitted from his pension plan and saved by living well within their means and invested wisely. They have two vehicles (buy them used and keep them well beyond ten years).  Now they have far more money than they need to support their accustomed lifestyle.

The Coopers love to spend money for the benefit of their extended family.  They have a two-bedroom condo in the city as well as a vacation property.  They use their $16,000 travel budget for regular vacations.  They even spend some of their budget to cover the cost of extended family joining them on vacation.  They also contribute to their grandkids’ RESPs.  And while the $6,000 they budget for charitable and personal gifts is not enormous, they have distributed around $500,000 to their kids over the years to give them a good start.

Singles

Case #1 – ‘Ever’ single Spencer is in her early 60s and had to stop working at her physically demanding public sector job over a year ago due to a repetitive stress injury.  She hopes to return to work in some role, but even if she is unable to work again she feels she can live comfortably and sustainably on what she now has in savings, as well as government and employer pensions.  She has a $38,000 budget and pays $5,000 in income tax. Based on having a paid-for home she will spend about $23,000 on basics which leaves about $10,000 left for the extras.  She recently made the choice to move to a small town, mainly for the small town lifestyle, but also for the lower cost of living as well.  Money has been set aside to purchase a modest home.  (She does state that earlier in life she had some bad spending habits; however, she has learned to make careful, purposeful spending choices).

Case #2 – Reynolds in her early 60s (split up with her partner about ten years ago and no children?) is intent on making the most of retirement and has above-average means to do so.  Recently retired after a career in the public sector, she has a budget of $73,000 a year, including about $33,000 for the basics, and a sizeable $25,000 for the extras.  She likes to travel and has about $6,000 a year allocated to it.  In the early years of her career she was fixated on saving, which helped provide the ample nest egg she has today, including a group RRSP.

Case #3 – McDonald, a widower in his late 60s, has an above average budget of about $81,000, including $41,000 for the basics and $21,000 for the extras.  He uses his money to support hobbies, travel and spending on his two grown children and their families.  He is trying to find a balance between spending his money and leaving a large legacy.  He takes two to three trips a year with his $10,000 budget.  His budget also covers some travel for his children and relatives.  He spends quite a bit on groceries and restaurants, including paying for meals with extended family.  He happily spends less than his ample means would allow.

Qualifying Statements by MoneySense about the two articles

The MoneySense author along with Money Coaches Canada notes that the category ‘shelter’ includes property taxes, utilities, maintenance, house insurance, rent and mortgage payments.  Case #3 Statscan figures include a small proportion of costs attributable to a second home.  For the ‘vehicle’ category, $2,000 a year has been added for depreciation.  The category ‘home and garden’ includes cleaning supplies, furnishings, appliances, garden supplies and services.  The category ‘recreation and entertainment’ includes computer equipment and supplies, recreation vehicles, games of chance, and educational costs.

The author also makes the following qualifying statements: “If you are single, you know that retirement planning is tougher for you than it is for couples.  You have no one to rely on but yourself, and you can’t share expenses or split income.  As a result, you can’t just take the cost of retirement for couples and divide it by two. Situations vary, but a single person will need to spend roughly 70% as much as a couple to enjoy an equivalent lifestyle in retirement…The figure for couples isn’t twice the figure for singles–it is only about 40% higher because spouses are able to share costs for things like housing and cars.  The higher per-person income singles need also results in higher taxes”.

Table

The following table combines the financial profiles of the three couples and three singles from the two articles into one table.

Following the table are financialfairnessforsingles.ca comments evaluating the results of the financial profiles.

moneysense cost of retiring well

Analysis of the Financial Profiles of Couples Versus Singles

Marital Status

First, it is important to get one fact straight.  Couples who divorce/separate and persons who are widowed are not singles.  The only person who is truly single in the six profiles is Spencer as an ‘ever’ single person (never married, no children).  The profile of the ‘ever’ single person shows that she is likely at the bottom of the financial status list in terms of wealth as she is the one with a modest home in a small town where it is cheaper to live.  The separated person likely has a better financial profile because she was able to accumulate wealth as a coupled person for twenty-five or thirty years and was separated later in life (if she had separated earlier in life, she likely would have a financial profile more equal to the ‘ever’ single profile).  All of the other profiles show that they have more wealth and homes in nice neighborhoods and even second homes (Coopers).

Benefits

Marital status also determines who is likely to have more benefits.  It can be assumed that the couples have the higher financial status simply because they are married or widowed.  The married profiles will most likely pay less income tax than the single profiles because couples receive two of everything, have the ability to pension split and can get survivor benefits when widowed, etc.   As retirees, the two profiles that lose on benefits are the ‘ever’ single person and the person who is separated.

It is stated that most of the couples have lived so frugally that they now have more money than they need, but at same time have three bedroom houses in nice neighborhood, vacation home, and can retire in their 50s and 60s with a very comfortable lifestyles.  This implies, even with frugality, they had plenty of money to spend and save as married/coupled families with children.

The single person is the one that has to move to a smaller town to lower living expenses while others are living in what appears to be substantial housing.

Taxes

On examination of the profiles, it is easy to see that the persons who are paying the most taxes are the ever single person, the separated person and the widowed person.  The Taylor couple pays the same taxes as the ‘ever’ single person (Spencer), but they have approximately $5,000 more in income and appear to have much more wealth in terms of assets (must be the pension splitting).  It pays to be married.  The Statscan couple pays less income tax (almost one half of the amount equal to 13.4%) than the separated Reynolds person (20%), but her income does not come even close to double of the Statscan couple.  The Coopers are paying only $20,000 on $100,000 income (20%).

The widowed person (McDonald) with all of his wealth is most likely receiving survivor benefits.  Did he pay extra for these benefits and why is he portrayed as being single?   If he is now single why should he receive anything more than the ‘ever’ single person and the separated person?

Benefits to Families of Coupled People

The profiles of the coupled persons and the previously coupled person (widower McDonald) blatantly state that they have more money than they can spend and have given generous monetary gifts, paid for the meals of their kids, grandchildren and extended family members, etc.

Married/coupled people or previously coupled people are often able to give exorbitant gifts, inheritances, etc. to family and extended family.  Does this not create a sense of entitlement for family, children and grandchildren who begin to expect this all the time? How does this extravagance teach frugality?

Emergency Monies

Where in any of these profiles has money been set aside for emergencies?  The person most likely to be unable to pay for financial emergencies due to illness, financial issues, etc. is the ever single person with the least accumulation of wealth.

Education, Education, Education!!!

It is beyond comprehension on how governments, families, society and think tanks lack knowledge and are financially illiterate on the true facts of how ‘ever’ singles and divorced/separated retirees are financially robbed to subsidize married/coupled retirees by paying more taxes while getting less benefits like pension splitting and widower benefits in this country.

Singles require 70% of the income/wealth of Couples

How many ways can this fact be stated and how many different sources of information does the government and society need to make changes on how singles are financially discriminated against in this country??  Do Members of Parliament ever think to include singles when making important decisions like pension splitting and benefits that benefit only the married/coupled and families of this country?  Government, businesses, society and media only ever talk about middle class families. Singles meanwhile have been financially discriminated against by their government and society.

 How expensive is it to raise a child?

So how expensive is it to raise one child, two children, and three children and still come out on top in terms of wealth in the personal profiles?  Governments, society and families, think tanks continue to talk about how expensive it is to raise a child, and yet many families are able to leave large legacies/inheritances to their children.  Unfortunately, based on the facts this seems to be based on the half-truths and lies of governments, society, families and think tanks.

Profiling

Singles are often profiled as having excessive spending habits/lifestyles while married/coupled persons are usually profiled as being frugal.  Married/coupled persons in their retired state are still profiled as being frugal even though they can give extravagant gifts (in one case around $500,000) to their children and grandchildren and spend more money on items like vacations.

 Happy, happy, happy!!!!!

In both articles the profiles and the author comments seem to imply that everyone is happy, happy, and happy with their financial status.  ‘Ever’ singles and divorced/separated retirees are blatantly told they should be happy with what they have even though they have been discriminated against financially.

‘Ever’ single persons and divorced/separated persons not so lucky to have achieved equivalent wealth (70%) of married/coupled persons as shown in above examples wish to state they are not happy with being financially discriminated against on every level of government and society.  They are not asking for more than married/coupled people.  They are asking for financial fairness.

FINAL STATEMENT

Governments, businesses, society, families, think tanks all maintain that the middle class is being affected most by poverty.  The real truth is that ‘ever’ singles, singles with kids, persons divorced/separated early in marriage/coupling, and families with low incomes are being affected most by poverty.  Singles (‘ever’ and divorced/separated) in this country are not happy with always being excluded from financial formulas and conversations.  They are human and in their humanity are equal to married/coupled people, and it is time that they are treated with the same financial fairness, dignity and respect as married/coupled people.

This blog is of a general nature about financial discrimination of individuals/singles.  It is not intended to provide personal or financial advice.

HOW MARITAL STATUS IMPACTS DEDUCTIONS, CREDITS FOR MARRIED/COUPLED PERSONS

HOW MARITAL STATUS IMPACTS DEDUCTIONS, CREDITS FOR MARRIED/COUPLED PERSONS

These thoughts are purely the blunt, no nonsense personal opinions of the author and are not intended to provide personal or financial advice.

(While researching online for information on last two posts, this article came up:   “Love and taxes: Canadians confused on how marital status impacts deductions, credits” by Darah Hansen and published in Yahoo Finances on February 12, 2016 just before Valentine’s day.  This article and the comments following the article provide some interesting insight into thoughts of Canadian citizens on reporting of marital status on income tax forms.  This article and comments is also a good follow-up to the information entered in the last two posts.

Comments of the author of this post are shown in italics.)

Quotes From Article

Quote from article states:

  • ‘Recent survey by Leger, on behalf of H&R Block Canada, found that more than half of us mistakenly think that married and common-law spouses can file a joint return to save money on their taxes. Another 40 per cent believe it’s up to us to decide whether to claim our marital status on our tax returns, while a handful of respondents doubt the CRA (Canada Revenue Agency) has guidelines to determine that status.
  • Couples are required by law to check the correct status box in tax forms.
  • Family incomes in Canada are not combined for the purpose of calculating tax; however, they can be for the purpose of calculating income-tested benefits, such as the GST/HST credit or the National Child Benefit supplement.
  • Couples also stand to benefit from combining their charitable donations, transit passes and medical expenses.
  • And, new this year, parents of children under 18 years stand to gain from a newly announced federal tax credit. Often referred to as the “family tax cut”, the new measure allows a higher earning spouse to transfer in kind up to $50,000 in income to his or her spouse in order to collect a tax credit of up to $2,000.Canadian taxpayers are required by law to answer the marital status question correctly.  “If you lie, it’s tax fraud,” says Golombek…..
  • To be considered common-law, two people must live together in a conjugal relationship for 12 months or immediately if you have a child together. If you receive benefits you are not entitled to because of an incorrect marital status, you can bank on being asked to repay them.
  • One final misconception: About 44 per cent of Canadians believe that once you are divorced, you can claim as single the following year. But once you have filed as married, you can never claim single. You are instead classified as separated, divorced or widowed’, (end of quote).

Comments from Readers

The comments following the article, of which there were many, resulted in very different viewpoints.  Indeed, some comments turned out to be very derogatory and inflammatory as often occurs in forums of this kind.  Families with children call singles ‘selfish’ and single call families with children ‘breeders’, etc.  Analysis of the comments revealed some commonalities.

A large majority of Canadian citizens, it seems, don’t have a clue about declaration of their marital status on income tax forms, especially those that are married, divorced, separated, or living common-law.  Canada Revenue Agency (CRA) has very clear definitions of marital status, so why the confusion?

Some of the reasons why incorrect reporting of marital status on income tax forms are as follows, (these are comments that were submitted by the readers):

Unhealthy or unequal relationships with their significant other.  

  • One comment:  ‘good luck in filling as common-law in my case my partner refuses to file common-law, said his taxes are complicated, and we been together now for 5 years. I look at it he is hiding something and don’t want me to know his business.’

Some don’t seem to want to record their marital status as outlined in CRA rules. One of the biggest issues on recording marital status seems to revolve around those that are divorced/separated and what they will have to give to the other spouse in the way of child and spousal support.

  • ‘Once you are legally married you can never again claim “single”. If you divorce, you must say “divorced”, even if you were divorced 40 years ago. If you remarry, of course, you then check the “married” box once again. Until your partner dies, whereby you become “widowed” until you remarry or die yourself.  To be “common law” you will have been living together for 12 months prior to filing your taxes, – or right away if you have a child together and it happens to be less than that.  (Even if divorced for many year, marital status would still be divorced).’
  • ‘Making a “stupid decision” not to inform CRA about this issue will often come back to bite you.’
  • ‘There are more tax breaks for single moms then for being married. It is actually scary to tell them when you finally do get married. There goes everything.’
  • ‘Seems strange, usually you marry the mom not the kids. Not sure why she would stop getting benefits to support her kids. Note to self, stay clear of single moms and the tax man will pin you with the responsibility.’
  • ‘So why (does)  Revenue Canada have different category for divorced people? to have a reason to garnish…  They do this because people who are separated or divorced often have separation agreements/court orders for making support payments. Spousal support payments are taxable in the hands of the recipient and deductible for the payer. Since there are no slips that go with these payments they want to make sure that both parties are claiming it or including it correctly (i.e. not just being deducted by the payer and not included in income for the recipient).’

Many income tax filers have no clue what benefits they will get and how marital status will affect those benefits.  Married/coupled persons don’t seem to realize they will receive more benefits throughout their married/coupled lives than will singles, particularly ‘ever’ (never married, no kids) singles.

  • ‘Single working professionals get taxed the hardest with the fewest deductions.’
  • ‘There is no benefit in being married. Stay single especially single mothers.’ (Married/coupled persons seem to never be happy with the benefits they get).
  • ‘don’t forget to add to move in with your boyfriend either, if you want the benefits or to minimize your tax, of course based on that rationale they should struggle on one income just to get benefits is quite irrational thinking.’  (This presumably was a tongue-in-cheek remark to the above comment.)
  • ‘You may not see the benefits of being married when it comes to taxes, but financially there are a lot of benefits to not be single. Sharing costs like same  housing is huge and when finances are done with purpose in mind can lead to wealth creation.’ (This is known as being able to live more cheaply because of economies of scale-Six Reasons why Married/Coupled Persons able to Achieve More Wealth). six-reasons-why-married-coupled-persons-are-able-to-achieve-wealth/
  • ‘But there is no denying  that two people going in the direction accomplish way more than one person by him/herself….. those who stay together are better off statistically in a financial sense than those who go about it alone.’ (This is because of  ability to accumulate wealth times two persons and ‘rule of 72’ -Six Reasons why Married/Coupled Persons able to Achieve More Wealth)
  • ‘Couples can transfer unused credits to each other. Singles lose unused tax credits.’  (This is because of marital manna benefits – Six Reasons why \Married/Coupled Persons able to Achieve More Wealth)
  • ‘I was once told by my neighbour that he and his wife would be better off financially if they divorced. Obviously not ALL Canadians are confused about tax credits and deductions. (Next comment) Not so. Couples can transfer unused credits to each other. Singles lose unused tax credits.’  (This is known as manipulation of assets as stated in ‘Six Reasons why Married/Coupled Persons able to Achieve More Wealth).
  • ‘I have never paid more than what I owe based on my income whether single, married or divorced. The only difference it makes is for benefits like GST rebates, etc….’
  • ‘Family incomes in Canada are not combined for the purpose of calculating tax.’  
  • ‘They are only combined for potential benefits such as GST tax credits… etc…..you can transfer unused tax credits to lower the spouse’s taxable income, thereby reducing their taxes. CRA combines them for the purpose of calculating GIS benefits and HST refunds.’

Some tax filers choose to falsely record their marital status, though they know they are committing fraud.

  • ‘Most Canadians play dumb as they are fully aware they are breaking the rules and pretend like they didn’t know. They cheat hoping they will not get caught.’
  • ‘If you are married the tax form asks for your spouse’s name, SIN and whatever.’
  • .It’s not your fault you didn’t get caught. It is your fault for claiming single while married. Let me simplify this for you. Two scenarios. Husband and wife. Both make $35k. If they claim single each pays tax on $35k. If they claim married EACH pays tax on $35k. The combining is only for tax credit purposes. Percents don’t change due to marriage or not. Govt fraud is irrelevant to this conversation. And if it is true… then so what … two wrongs make a right? Seriously you need to get professional advice. Just because you have not ‘been caught’ yet does not mean it won’t happen. You are cheating and if you are getting tax credits fraudulently, you will pay a penalty if caught.
  • For those who don’t think there are repercussions to false filing, you can view the convictions from each province at Google “CRA Criminal investigations actions, charges, and convictions”.

Many more comments were made and are too numerous to be included here.

CONCLUSIONS

  • If there is confusion about how to record marital status on tax forms, get professional help.
  • Incorrect filing of marital status on tax forms constitutes fraud.
  • Education, education, education – married/coupled persons need to educate themselves on all the benefits they receive from date of marriage to after their spouse is deceased.  They need to realize that singles have been left out of financial formulas and do not receive benefits such as transfer of spousal credits, pension splitting, tax relief if one spouse is in nursing home, etc. even though it costs singles more to live than married/coupled persons living as a single unit.
  • Singles deserve to be included in financial formulas at 70% of that given to married/coupled persons.  Many singles have worked throughout their entire lives  (35, 40, 45 years) and,with their taxes have supported  married/coupled persons and their families; therefore singles deserve equal financial representation in financial formulas.
  • Problems that divorced/separated persons have with spousal/child support, etc. should not be the problem of singles and should not be a reason to say that ‘singles’ are lying on tax forms (especially ‘ever’ singles who only have one option to record on tax forms, that is ‘single’).

This blog is of a general nature about financial discrimination of individuals/singles.  It is not intended to provide personal or financial advice.

CONTINUED FINANCIAL ILLITERACY OF FINANCIAL GURUS EQUALS FINANCIAL DISCRIMINATION OF SENIOR SINGLES (Part 2 of 2)

CONTINUED FINANCIAL ILLITERACY OF FINANCIAL GURUS EQUALS FINANCIAL DISCRIMINATION OF SENIOR SINGLES (Part 2 of 2)

(These thoughts are purely the blunt, no nonsense personal opinions of the author and are not intended to provide personal or financial advice.)

This blog post is a comment on the Broadbent Institute Report on the economic circumstances of Canadian seniors.  The Broadbent Institute is a left-leaning social democratic think tank founded by Ed Broadbent who was a past leader of the New Democratic Party .  It describes itself as an independent, non-partisan organization championing progressive change through the promotion of democracy, equality, and sustainability and the training of a new generation of leaders.  Its mission is to “Support, develop, and promote social democratic principles for the 21st century”, “Propose new solutions for a more equal society”, and “Equip a new generation of progressive campaigners & thinkers with the tools they need to build a social democratic society through training and education”.

This post addresses excerpts from the report first (Part 1), and then is followed by comments on the report (Part 2).

COMMENTS ON  REPORT – PART 2 OF 2

In February, 2016 the Broadbent Institute in Canada and Richard Shillington of Tristat Resources published the report:  “An Analysis of the Economic Circumstances of Canadian Seniors”.       (analysis_of_the_economic_circumstances_of_canadian_seniors)

The report information is mainly directed towards poverty of seniors without an employer pension plan (roughly 47 per cent) and therefore, many of these seniors have wholly inadequate retirement savings.

(It should be noted in the report that single seniors does not refer to marital status, but the fact that they live alone.  Therefore, single seniors includes ‘ever’-never married, no kids-singles, divorced/separated, and widowed seniors living alone).

Review of the report reveals some points that are very disconcerting.

  • The true facts of what it costs singles to live is under-reported.  Married/coupled persons and, indeed, the author of the Broadbent report do not seem to realize that the widowed (married/coupled persons whose spouses are deceased) are a part of the singles population.  It is a well known fact that it costs singles approximately 70 per cent of what it costs married/coupled persons to live as a single unit.  This fact is never addressed in the report. (Using LIM 11.1 percent of seniors live in poverty–719,000 seniors:  419,000 singles and 250,000 living in an economic family.  The poverty is astonishingly high at almost 30 per cent for senior singles without employer pension plans).  (Widowed persons and the extra benefits they get are discussed later in this post).
  • All the extra benefits that have been given to married/coupled persons are never addressed.  Governments continue to create financial silos where more and more benefits are given to married/coupled persons even though they are able to live with less because of economies of scale, but not to singles resulting in financial inequality.  (Following table was updated on March 8, 2016 with additional information).

financial silos6

  • It is ludicrous that this report does not treat home equity as a retirement asset.  Those who have to rent are at a much greater financial disadvantage than those who own their own home.  Quote from report : “ …..Many of those who argue that there is no looming pension crisis have included home equity as a liquid asset.  This analysis has not treated home equity as a retirement asset because the replacement rate analysis has as its objective an income that allows one to enjoy a lifestyle comparable to that which existed pre-retirement.  We do not include home equity here because we accept that the pre-retirement lifestyle for many middle- and moderate-income Canadians include continued homeownership”, (Page 19).

According to Statistics Canada 2011 articles “Living Arrangements of Seniors” and “Homeownership and Shelter Costs in Canada”:      (statcan.gc.ca) and (statcan)

  • The average household total income for couple-family households was about twice that of non-family households (which were primarily one-person households) and lone-parent households ($101,000 per year versus $43,000 per year and $55,000 per year respectively).  Thus, while lone-parent households and non-family households had a lower cost than couple-family households, the lower household total income results in a higher proportion exceeding the affordability threshold”.
  • Approximately 69 per cent of Canadians own their own home.  About  four out of five (82.4%) married/coupled people own their own home, while less than half (48.5%) of non-family households (singles) own their dwellings.  Just over half (55.6%) of lone-parent households own their dwelling.  (It stands to reason that more senior married/coupled and widowed persons will own their own homes, while senior singles–‘ever’ single and early divorced)–are more likely to have to rent placing them in greater income inequality and a lower standard of living and quality of life). Regardless of housing tenure, the proportion of non-family households and lone-parent households that paid 30% or more of total income towards shelter costs was about twice the proportion of the couple-family households.
  • Quote “approximately 56.4 per cent of the senior population (5 million total seniors in 2011) live as part of a couple and about 24.6 per cent of the senior population live alone (excludes those living with someone else, in senior citizen facilities and collective housing).

Singles are constantly told to ‘go live with someone’ when they have difficulties paying for housing; meanwhile married/coupled and widowed persons may be living in their big houses (enjoying the same lifestyle they had before pre-retirement) and seeking help with paying their taxes while refusing to move to a less expensive dwelling.  (senior-singles-pay-more-part-3-of-4)

  • It is ludicrous for this report to state that seventy per cent  income replacement should be a benchmark in the formulas.  Seventy per cent income replacement is entirely different for those who own their own home versus those who rent.  It is selfish to think that the rich and married/coupled persons should be able to live same lifestyle post-retirement as pre-retirement when singles and early divorced generally will have a poorer lifestyle throughout their entire lives.

An example is the Financial Post financial evaluation “Bright Future Despite Big Debt, Small Income” published in Calgary Herald on February 20, 2016 where Ontario young couple’s after tax income is $4,800 per month and their food budget is $800 and entertainment $160 per month for two people.  Just these two items are 20 per cent of their budget.  Either they live in an area with very high food costs or they are living the high life for one of the necessities of life in Maslow’s Hierarchy of need.  Seventy per cent replacement at retirement would give this couple an unreasonably high style of life for food in comparison to singles.   Reader letter mentioned above in ‘senior-singles-pay-more-part 3-of-4’ link suggested singles should be able to live on just $200 per month for food.

  • It is ludicrous to suggest that persons without employer pension plans cannot save, especially those with incomes over $100,000.

Quote from report:  “For those with incomes in $50,000-$100,000 range, the median value (savings) is only $21,000” (Page 3).

If those with pension plans have forced saving, it it is ridiculous to say that those without pension plans are not able to save.  For example, a $75,000 before-tax income may result in $600-$700 per month being deducted from pay cheque (employer deductions are excluded in this discussion).   It is also ridiculous to say that in this First World country persons with $100,000 plus incomes cannot save.  One of the principles of good finances is to save 10 per cent.  Whole report promotes greed of looking for more benefits and not planning for the future if there is no plan for saving during working years.

  • Reporting false information on marital status is a crime.  Quote from report states:  “Table 7 represents the results of increasing the single and married GIS amounts by the same percentage.  One should keep in mind that there is an incentive for seniors to appear as singles to governments even if they are living as a couple.  This is because the GIS for senior couples is less than twice the amount for singles.  An increase in the GIS for singles only (with no increase for couples) would increase this so-called ‘tax on marriage’ and associated incentives.  This would encourage couples to hide their cohabitation from the authorities for financial reasons”, (Page 21).

GIS for senior couples should, repeat, should be less than twice the amount for singles.  Singles (particularly ‘ever’ and early divorced singles including the author of this blog) have worked very hard to have financial formulas include singles at 70 per cent of married/coupled persons living as a single unit.  The GIS for senior singles is more than married/coupled persons because it costs more for singles (including widowed persons)  to live than it does for married/coupled persons living as a single unit.  Why can’t married/coupled persons understand this?  When married/widowed persons become widowed their living costs will go up.

The statement  “An increase in the GIS for singles only (with no increase for couples) would increase this so-called ‘tax on marriage’ and associated incentives. This would encourage couples to hide their cohabitation from the authorities for financial reasons” is absurd and selfish.  Tax on marriage, why can’t married/coupled persons realize all the extra benefits they receive as outlined in table above???  When is ‘enough’ ever going to be ‘enough’ for them???

The notation (# 28) at the bottom of page 21 states:  “While legislation treats those cohabiting the same regardless of their marital status, it is easier to deceive the government if you are not married”.  This statement is false and backwards.  If it is anyone being deceitful, it is the married/coupled persons.  Can someone explain why it would be easier to deceive the government if you are not married (‘ever’ single)?  The issue with false reporting lies with those who are married/coupled, divorced or separated.  They are trying to ‘milk’ the system by falsely reporting their marital status even though the Canada Revenue income tax rules clearly define the parameters of marital status.

False reporting is a crime.  It would be very easy to track deceit by following income tax declaration of marital status and address of residence over several years.  Deceit of married/coupled persons would incrementally increase the monetary value they would receive from the deceit as it costs them less to live as a couple than it does single persons.

It seems married/coupled persons want it all even if they have to lie about it.  So what will they do when their spouse goes to a nursing home or is deceased?  In order to collect the benefits they are entitled to as one spouse living at home and the the other in a nursing home and widowers, they will need to lie again and change their marital status from single to married/coupled or widowed when filing their income taxes.

‘Ever’ singles (never married, no kids) throughout their entire working lives pay same amount of taxes as each individual (with equal income to the single person) reporting income tax in a married/coupled relationship and have supported/subsidized families who use mom/baby hospital care, EI benefits for maternal/paternal leaves, etc.  They are never recognized for their tax support and for using less resources than families.  Since singles have paid supportive taxes throughout their entire working lives, they deserve to live with the same financial dignity and respect as seniors and as married/coupled persons.  As seniors, ‘ever’ singles deserve to have their own space and their own bathroom and not be forced to cohabitate with other persons.

The real financial lives of singles is revealed when a simple math calculation is used for the targeted tax relief where a single senior can now earn $20,360 and a senior couple $40,720 before paying federal income tax.  This so called tax relief for seniors allows federal tax relief for singles equal to $1,697 per month and for senior couples $3,393 per month.  The tax relief for senior singles hardly covers a rent or mortgage payment of $1,200 and $250 for food per month (Maslow’s Hierarchy of Need), but amply covers this amount for a senior couple.  For a couple $1200 for rent or mortgage and $500 for food leaves $1693 (or 50% of $40,000) for other necessities and maybe even a nice little vacation all tax free.

CONCLUSION

It is incredible how in just a few paragraphs a think-tank can undo the hard work that singles have been trying to achieve in seeking financial equality.  Think-tanks and financial gurus continue to practice financial illiteracy on what it truly costs singles to live.   (false-assumptions-four-ways-seniors-singles-lose outand (financial-gurus-financially-illiterate-about-singles-finances)

Even though the final statement of the report states:  The GIS is the most effective federal mechanism in the short term for reducing the poverty rate and the impact of poverty on seniors, and it can be targeted at senior singles who need it the most”, there are many shortcomings to this report.

This report is encouraging irresponsible financial behavior.  It is morally, ethically and socially reprehensible in a First world country to say that one cannot save with an income over $100,000 and to promote financial inequality and discrimination of singles.

The Broadbent Institute is supposed to be about ‘a more equal society’, so where is the financial equality?

SOLUTIONS

In order to ensure financial equality between singles (including widowers) and married/coupled persons the following measures need to be taken:

    • change financial formulas so that senior singles receive 70 per cent of whatever is given to married/coupled senior persons as it costs more for singles to live than it does married/coupled persons because of economies of scale
    • financial formulas should be revised to include all senior persons regardless of marital status in one financial formula.  To eliminate financial silos that benefit married/coupled persons most, delete benefits already given to married/coupled persons such as pension splitting (benefits the rich most) so that there is a level financial playing field for all regardless of marital status. (It is understood that it is expensive to raise children and  benefits given for children should last for first twenty years of the life of the child.  However, beyond the twenty years of the children, any other benefits given to married/coupled persons should be deleted or should also be given equally to singles at rate of 70 per cent)
    • create a side-by-side list of all possible benefits under categories of married/coupled, widowed and single and analyze the total value of benefits in each category (see table above).  Financial formulas should be created equally for all categories, not just the married/coupled and widowed.
    • delete allowance benefit that has been ruled to be discriminatory by the courts
    • education, education and more education on financial literacy for singles.  Think tanks, financial gurus and married/coupled people need to educate themselves on what it really costs singles to live.

(These thoughts are purely the blunt, no nonsense personal opinions of the author and are not intended to provide personal or financial advice.)