AFFORDABLE HOUSING FOR VULNERABLE POPULATIONS, SINGLES AND THE POOR

AFFORDABLE HOUSING FOR VULNERABLE POPULATIONS, SINGLES AND THE POOR

(These thoughts are purely the blunt, no nonsense personal opinions of the author about financial fairness and discrimination and are not intended to provide personal or financial advice.)

The following discussion (about 15 pages in length) on affordable housing was submitted in response to a request for input to a national survey on affordable housing. The link for ‘Let’s Talk Housing’ survey is included at the end of this post.

It appears that some of points from this discussion were included in the final results of the survey such as

  • Including singles in definition of family by using specific wording of “individuals and families” not just “families”
  • Including affordable housing as a human rights issue
  • Including quality of life such as laundry facilities.

Issues that appear to not having been addressed are single seniors having own bedroom and bathroom that doesn’t cost more for them than for married or coupled seniors.

There still seems to be a mentality for seniors to age in place even with expensive houses that they can’t afford (tax credits on home renovations and assistance in paying house taxes).  Those with considerable net worth and assets should be excluded from housing subsidies of any kind.

NATIONAL AFFORDABLE HOUSING STRATEGY

TO: National Housing Strategy Team, Canadian Mortgage and Housing Corp., 700 Montreal Road, Ottawa, ON K1A 0P7

To Whom It May Concern:

First of all, thank you for the opportunity to respond to your housing strategy.  In this response, two categories that have been identified will be addressed – Affordable Housing and Vulnerable populations.

CATEGORY – AFFORDABLE HOUSING

Blog “financial fairness for singles.ca” talks about affordable housing.  One of the reasons for unaffordable housing is what author calls UPSIDE DOWN HOUSING. Excerpt from blog is as follows:

UPSIDE DOWN HOUSING

Why does it seem more difficult for individuals/singles and low income persons to purchase affordable housing?  For possible reasons why, consider the following scenarios.

One example, condos presently being developed in Calgary by a developer in one housing complex includes 1 bed, 1 bath, 1 patio micro-condos of 552 sq. ft. with starting price of $299,900.  Two patio, 2 bed, 2 full bath, 2 story 1232 sq. ft. condos were already sold out so price not available.  Then there are 2 patio, 3 bed, 2.5 bath, 2 and 3 story 1830 sq. ft. condos priced from $649,900 to $749,900.  Apparently, ultra-deluxe model has master bedroom suite covering entire third 600 sq. ft. floor.  The third floor bedroom is bigger than total square footage of $299,900 condo.  When price per square foot is calculated, micro-condo is selling for $543 per sq. ft. while three bed condos are selling from $355 to $409 per sq. ft.

So who is more likely to buy micro-condos?  Possibly low income couples, single parent with one child, or environmentally conscious, and probably an individual/single person.  Who gets to pay $150 to $200 more per square foot for two-thirds less space?  Ripple effects are owners of micro-condos have to proportionately pay more house taxes, education taxes, mortgage interest and real estate fees on less house and less take home pay for biggest lifetime expense.  When it is sold, will seller recoup buying price?

While singles are living in their small spaces (average size of new studio, one bed and one bed/den new condo combined being built in Toronto is 697 sq. feet), majority of Canadian married/coupled people families are living in average 1950 sq. foot houses (2010) with large gourmet kitchens, multiple bathrooms, bedrooms for each child and guests, basement, garage, yard, and nice patio with barbecue, etc.

To further magnify the issue, lottery in major northern Alberta city has first grand lottery prize of $2,092,000 for 6,490 sq. ft. house ($322 per sq. ft.), second grand prize of $1,636,000 for 5,103 sq. ft. house ($321 per sq. ft.), and third grand prize of $1,558,000 for 5,097 sq. ft. house ($306 per sq. ft.).  First house has elevator, games/theatre area, kid’s lounge, gym, and music room. Second house has hockey arena with bleacher seating, lounge and bar.  Third house has spa, gym, yoga studio, juice bar and media room.  The wealthy get all the extras and pay only $306 per square foot.  This is upside down housing.  Need anything more be said about the wealthy? They usually get more while paying less and acquiring choicest spots.  (Another example is penthouse suites that sell for proportionately less dollars per square foot than a small condo unit on lower floors of a building).

Average square footage of Canadian house is 1950 sq. ft. (2010) so how can a developer socially, morally and ethically justify charging $150 to $200 more per square foot for two-thirds less space?  “CREB now”, Aug. 28 to Sept. 3, 2015, page A5, talks about Calgary developer selling 440 sq. ft. condos in north inner city tower for $149,000 ($339 per sq. ft.) in 2012 and 440 sq. ft. condos in south inner city tower for $219,000 ($498 per sq. ft.) in 2015.  Two and three hundred sq. ft. condos are now being sold in Vancouver and Toronto for around $250,000 ($1250 and $833 per sq. ft. respectively).  In many cases salaries for low income and singles has not risen to same level, nor has Canadian housing prices for the middle class and rich ($400,000 and up).

How is any of this different than loan-sharking or pay day loans where targeting of the most vulnerable occurs?  Does no one see a pattern here where the wealthy pay $300 to $400 per square foot, but singles and poor families are forced to live in smaller spaces while paying more per square foot for them?

Further financial unfairness occurs when individual/single homeowners without children are forced to pay education taxes, but parents pay only fixed rate based on value of their home regardless of number of children.  For ‘nineteen kids and counting’ it is possible parents are only paying a few cents a day for their children’s education.  Some married/partnered seniors with kids are looking to have education tax payments eliminated from their house taxes.  For families with children, logic implies parents should pay education tax throughout their entire lifetimes, or individuals/singles without kids should not have to pay education tax ever.  However, families don’t seem to be able to apply financial logic of their own finances equally to the financial realities of their single children.  And, many families do not want to pay school fees.

There are many more examples of financial unfairness, but just the above few show how financial world for low-income families and individuals/singles has been completely flipped upside down and topsy-turvy.  Have governments, society, and our publicly and privately funded education systems failed us so miserably and family/corporate greed taken over with critical thinking, social/ethical responsible thinking sinking to all-time lows?  Since when is it okay under present financial system for families to accumulate wealth and huge inheritances while their low income and single children are not able to support themselves on a day to day basis?

Young individuals/singles not yet married are facing huge financial hurdles because of low incomes, less full time jobs, enormous education debt, and out of control housing costs.  Families (parents), governments, society, corporations, businesses to date have failed to provide support and responsibility that is needed to ensure all Canadian citizens are able to financially take care of themselves without financial parental aid, inheritances of parents and without bias of gender, race or marital status.

In this so called civilized, enlightened country of ours, it appears that citizens of value are only upper middle-income families and the wealthy while individuals/singles with and without children are being annihilated from financial, political, and everyday living scenes (MADE INVISIBLE). If families have such high family values, shouldn’t family values and moral social values take precedence instead of being trumped by almighty dollar greed and philosophy of charging what the market can bear and more?

Low income families, individuals/singles and young adults not yet married who can apply simple math and critical thinking skills are in financial despair and angst knowing that they, as the most vulnerable citizens of this country, have been targeted and pawned to pay more for housing than middle class families and the wealthy.  It is the duty of politicians elected by the people, for the people to represent all Canadian citizens, not just vote getting middle class families.

OUTSIDE THE BOX SOLUTIONS FOR PRICING OF AFFORDABLE HOUSING

Solution 1 – for a housing complex as identified in the above outrageous pricing example, prices should be set where the base price of the unit with the smallest square footage cannot be more than the base price of the unit with largest square footage within the complex. Any changes and upgrades by the buyer would be added to the base price. (In the above example the base price of the 552 square foot condo could only be $355 per square foot to match the cheapest price of the biggest per square foot unit in the complex).  Should there be laws and fines applied for these outrageous prices?

Solution 2 – Charges for house taxes, education taxes, and real estate fees should be balanced between square footage and price of the housing unit?  Where housing prices follow a fair pricing formula as shown in Solution 1, this could provide financial fairness where fees are based on largest unit and become proportionately less on smaller units.

Solution 3– charge a fee such as a carbon tax fee for units greater than a certain number of square feet. For example, allow a maximum size of 2500 square ft. for a housing unit (assumption is that there is no need for excessive amounts of square footage in housing). For anything greater than 2500 square feet, charge an extra fee to the buyer with an incremental increase in the fee for every additional 500 square feet of space. (The wealthy have been paying less and getting more square footage while using non-renewable resources plus water at an alarming rate, i.e. 5000 square foot log cabin using twelve logging trucks filled with harvested logs and a showhome that has seventeen sinks). The monies collected from these fees could be used to build more affordable housing.

As stated in a recent real estate article, Watermark, a deluxe complex in Calgary is selling an ‘inspired’ (so stated in article) 8,644 sq. ft. estate home and its guest house for $3.45 million or $399 per square foot which is less per square feet than 600 square foot condo mentioned above. Article goes on to say that beyond homes, Watermark garners interest with both natural and manmade beauty. It has 17 cascading ponds and more than five kilometers of interconnected walking and bike trails. Then there’s the central plaza with its 1,000 sq. ft. pavilion, kitchen, barbecues, a sports field and NBA-sized basketball court. One family’s daughter is looking forward to booking the plaza and using the outdoor kitchen for her birthday party. The family goes on to state that space between homes and low density was also very important so they weren’t looking into someone’s back yard. This same complex has a show home with 17 sinks.

Another real estate article talks about another family with three children moving from 1900 sq. ft. house to a 2,837 sq. ft. house with price starting from $900,000s. They are moving because they need more room for the kids as they grow. Their new house will provide 567 sq. ft. per person at a starting price of approximately $317 per sq. ft. Yet again other articles state that owners are happy they don’t have condos in their backyard (NIMBYism) and their children can experience nature from their own bedrooms.

Further advice usually given by married people states singles can live with someone else if they can’t afford housing when they are already living in studio, one bedroom apartments, and basement suites. Senior singles who have lived productive lives while contributing to their country want and deserve their own privacy and bathroom. Many senior assisted living dwellings have in recent years built more spaces for singles who with one income pay more for that space than married/coupled persons. Just how long should shared arrangements go on for (entire lives?) instead of correcting underlying financial issues?

Following examples show dignity and respect for singles (and low income families). Attainable Housing http://www.attainyourhome.com/, Calgary, allows maximum household income of $90,000 for single and dual/parent families with dependent children living in the home and maximum household income of $80,000 for singles and couples without dependent children living in the home. Living Wage for Guelph and Wellington livingwagecanada allows singles dignity of one bedroom apartment and a living wage income that is 44% of a family of 4 income and 62% of a family of two (parent and child).

While singles are living in their small spaces (average size of new studio, one bed and one bed/den new condo combined being built in Toronto is 697 sq. feet), majority of Canadian married/coupled people and families are living in average 1950 sq. foot houses (2010) with large gourmet kitchens, multiple bathrooms, bedrooms for each child and guests, basement, garage, yard, and nice patio with barbecue, etc.

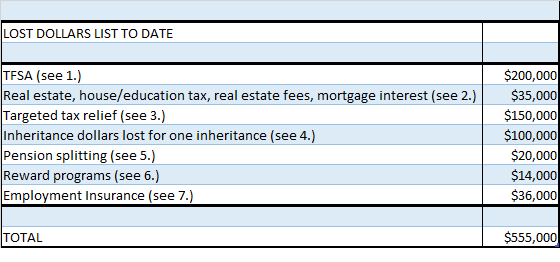
Above mentioned blog has also tried to attach lost dollars that singles face directly every date in relation to married and coupled family units with and without children.  The following lost dollar value is in relationship to housing.

LOST DOLLARS VALUE LIST

For a 700 square foot condo where price is $50 more per square foot than lowest price of largest condo in complex, it can be assumed that the purchaser will be paying $35,000 more than purchaser’s base price of largest condo, if the price per square foot is $100 more per square foot then purchaser will be paying be paying $70,000 more, if the price per square foot is $150 more per square foot then purchaser will be paying $105,000 more and so on. The amount of house and education taxes, real estate fees and mortgage interest will also incrementally increase.

Our Lost Dollar Value List in blog (lost-dollar-value) –  when lost dollar value for real estate is added to the list, $50 was  used as the example not including gestimate loss for taxes and real estate fees, interest charges based on $50.00 per sq. ft.

APPROPRIATE HOUSING DEFINITION

Singles are often told they can always go ‘live with someone’ if they have problems with affordable housing.  The CMHC should be aware of the following definition of appropriate housing.  Housing dignity and respect as well as quality of life according to this definition specifies that singles deserve a bedroom of their own.  (One bedroom actually meaning one bedroom, not just a murphy bed in a 200 square foot condo, shows dignity and respect for singles).  It is the belief of this author that appropriate housing for a senior single means senior singles deserve a bedroom and a bathroom of their own.  After working for forty years for their country without the marital manna benefits given to married or coupled family units, senior singles deserve at least this much.

Appropriate Housing definition is stated as follows – Under the Social Housing Accommodation Regulation (alberta page 11), such housing is considered overcrowded if more than two people must share a bedroom, with at least one individual in each of the other bedrooms, and if an individual over 18 “must share a bedroom with another member of the household,” or someone over the age of five has to share a bedroom with “an individual of the opposite sex.”  (Spouses or partners sharing a bedroom don’t count)…..”Affordable housing is intended to be appropriate housing-appropriate to needs of families.   If children age in place or additional children are welcomed into a family, they can transfer within the system…subject to availability.”  

Blog “financialfairnessforsingles.ca”also addresses psychological impact where appropriate.  The following discusses the psychological impact for housing.

PSYCHOLOGICAL IMPACT

There seems to be very little understanding of the psychological impact that decision makers and policy makers have on singles regarding housing.

Many families live in houses where their young children have separate bedrooms, and likewise, there is a trend towards ‘man caves’ and ‘she sheds’ so family members can have ‘alone’ time, but when children become single adults, singles are consistently told that they can live with someone if they have financial problems with housing while paying more.

And, of course, singles never have claustrophobia, so it is okay to stick them in small spaces for which they have to pay more. And singles never have problems with noise, so it is okay for them to live in small units in less desirable areas close to airports and railway tracks, etc. (As one single person moving from one unit to another stated in a real estate article “I was very impressed with the pricing and the fact that they’re doing concrete floors and walls “. Concrete is said to restrict noise. “I work on Saturday mornings and a lot of people like to stay up a little later on Friday and Saturday nights”. With thinner walls, he adds, it is easier to hear “people in the hallways coming and going. It is not the end of the end of the world, by any means, but I am looking forward to something quieter above and below”. But for this person, the decision was less about sound and more about getting something larger, with better specifications and closer to work-moving from 615 sq. ft. two bedroom condo to 715 sq. ft. two bedroom condo. “The bedrooms are a little bit bigger with an ensuite. I really liked that and I liked the fact that it has a washer and dryer so I don’t have to go to the laundromat.”

Singles deserve same standard of living as married/coupled persons, i.e. having washer and dryer in their own home instead of having to go down a dark hall or to basement in complex to do laundry or paying outrageous prices per load at a laundromat.

When reading or listening to articles on housing for families, families will always talk about how important their housing is for them in regards to creating memories for their children, entertaining and maintaining close ties to friends and families, but apparently adult singles don’t have friends and families or dreams, so it is okay for them to live in micro condos, some as small as 200 square feet, where it is pretty much impossible to entertain or have friends and families stay with them except maybe by having a bunk bed chained from the ceiling.

SOLUTION

Singles and low income persons need to become more aware of financial unfairness by taking pricing down to the lowest common denominator, i.e. price per square foot and speak out about the financial atrocities being directed towards them. They need to start questioning why they are being targeted to pay more while getting less.  (While it is recognized that it is expensive to raise children, adult to adult it is also unfair to make one segment of the population like singles and the disadvantaged pay more than another segment).

By your own definition in ‘Let’s Talk Housing”, you state  -” Zoning by-laws that encourage affordable, mixed-income and mixed-tenure communities are one way to ensure the inclusion of all Canadians in a variety of social, economic and cultural opportunities”.  So how about putting ‘money where your mouth is’ and eliminating financial housing discrimination for singles and the poor that is upside-down and by truly making the wealthy pay their fair share?

 CATEGORY- VULNERABLE POPULATIONS

SINGLES/INDIVIDUALS ARE RARELY  INCLUDED IN FINANCIAL DISCUSSIONS AND FORMULAS

By your own definition in ‘Let’s Talk Housing”, you state vulnerable populations include seniors, persons with disabilities, victims of domestic violence, newcomers, homeless, lone parent families, indigenous households, youth, veterans.

Why are singles never included today in financial discussions and formulas?  Families are only mentioned.  What this means is that singles are discriminated against by virtue of exclusion and invisibility.  As stated by your definition in sentence above, singles are not included except if they fall into categories of disabilities, homeless, or youth.  Into which of these populations do singles between the ages of 25 and 65 fall?  Your own definition of vulnerable populations does not include them.

SINGLES ARE INAPPROPRIATELY CLASSIFIED

Singles are inappropriately classified when the ‘catch-all’ word ‘singles’ is used to include single parents, widowers, ever singles (never married, no kids), early in life divorced and late in life divorced singles all in one word.  Canada Revenue Agency has clear definitions for singles and widowed persons.  Yet, financial planners, government agencies, businesses often consider widowed people to be singles when they are not.   Single parents do get some government transfer benefits, which is as it should be.  Widowed persons are given benefits, while ever singes are rarely given any benefits except in abject poverty.  Widowed persons are more likely to own their own homes and have more net worth than ever singles.  Early in life divorced persons are less likely to be able to accumulate net worth and wealth than late in life divorced persons.

Blog article “False assumptions – ‘Four Ways Senior Singles Lose Out’ – December 2, 2015” is  a perfect example of how a financial analyst has inappropriately talked about singles in his article when he is actually talking about widowed persons.  Widowed persons are often perceived to have more social value  simply because they were married and have produced children in comparison never married singles and early in life divorced singles without and without children.  This discrimination often leads to never married and early divorced in life singles being left out of financial decisions because they have been made to be invisible.

FINANCIAL ILLITERACY AND IRRESPONSIBLE CONCLUSIONS OF DECISION MAKERS IN HOUSING SOLUTION

Who Really Owns Homes

In your information, you say 69% of Canadians own their own homes, but what you don’t say is the majority of home ownership is by married or coupled family units.  The sad reality is that singles are less likely to own their own homes because they simply can’t afford it.  You say that seniors are a part of the vulnerable population.  In reality, senior singles (not widowed persons and married or coupled persons) are more likely to be part of the vulnerable population.

According to Statistics Canada 2011 articles “Living Arrangements of Seniors” and “Homeownership and Shelter Costs in Canada” (12.statcan) and (12.statcan.gc) ‘approximately 56.4 per cent of the senior population (5 million total seniors in 2011) live as part of a couple and about 24.6 per cent of the senior population live alone (excludes those living with someone else, in senior citizen facilities and collective housing).

Approximately 69 per cent of Canadians own their own home.  About  four out of five (82.4%) married/coupled people own their own home, while less than half (48.5%) of non-family households (singles) own their dwellings.  Just over half (55.6%) of lone-parent households own their dwelling. “  (It stands to reason that more senior married/coupled and widowed persons will own their own homes, while senior singles–‘ever’ single and early divorced–are more likely to have to rent placing them in greater income inequality and a lower standard of living and quality of life).  Regardless of housing tenure, the proportion of non-family households and lone-parent households that paid 30% or more of total income towards shelter costs was about twice the proportion of the couple-family households’.

We are going to repeat this statement again:  Regardless of housing tenure, the proportion of non-family households and lone-parent households that paid 30% or more of total income towards shelter costs was about twice the proportion of the couple-family households’.   This very statement reinforces the fact that singles need to be included in the definition of vulnerable populations.

Singles are constantly told to ‘go live with someone’ when they have difficulties paying for housing; meanwhile married/coupled and widowed persons may be living in their big houses (enjoying the same lifestyle they had before pre-retirement) and seeking help with paying their taxes while refusing to move to a less expensive dwelling when they have financial difficulties.

Seniors who own their homes want to remain in their homes as long as possible versus renters

You state in your information that seniors want to remain in their homes as long as possible.  You also state renters, on the other hand, can benefit from lower monthly costs and more flexibility when they want to move.

Several comments – there are many seniors who have huge net worth in their homes, can’t afford to live in them, and yet want to remain in them.  They have such a sense of entitlement that they are seeking help with paying house taxes, and now politicians are looking to give them financial help with upgrading their homes.  The above statements show no regard for the psychological impact of renting for singles and the poor.  Just how long do you think renters should stay in one place – ten, twenty, thirty years- for example, as seniors without renovations and upgrades taking place in their rental units?  The likely answer that you and everyone else will give to this is that they can always move.  Moving in psychological impact is stressful, plus moving is expensive (your statement regarding ‘flexibility to move for renters’ is a negative, not a positive).

Families don’t take their own advice which they dish out to singles.  Senior couples or widowed don’t want to give up their big houses, but ask for reduced house taxes and senior education property tax assistance programs (Calgary Herald, “Not Now” letter to the editor, August 26, 2015).  If you can’t pay your house taxes, how about moving to smaller place or go live with someone (tit for tat)?  If families with kids don’t pay education property taxes as seniors, then homeowners who have never had kids should not have to pay education taxes throughout their entire lives.

Financial analysts and decision makers have in their end points created such a sense of entitlement and greed that many believe home equity should not be treated as an asset and, even more ludicrous, as a retirement asset.

Blog post ‘Continued Financial Illiteracy and Creation of Financial Silos Benefitting Married/Coupled Persons Equals Financial Discrimination of Senior Singles-Part 2 of 2’ (part-2-of-2) is author’s response to one such article:  February, 2016 the Broadbent Institute in Canada and Richard Shillington of Tristat Resources published the report:  “An Analysis of the Economic Circumstances of Canadian Seniors” (broadbentinstitute)

Quote from report :  ‘ …..Many of those who argue that there is no looming pension crisis have included home equity as a liquid asset.  This analysis has not treated home equity as a retirement asset because the replacement rate analysis has as its objective an income that allows one to enjoy a lifestyle comparable to that which existed pre-retirement.  We do not include home equity here because we accept that the pre-retirement lifestyle for many middle- and moderate-income Canadians include continued homeownership”, (Page 19)’.

(blog author’s response to this statement) ‘It is ludicrous that this report does not treat home equity as a retirement asset.  Those who have to rent are at a much greater financial disadvantage than those who own their own home’.

Singles with mortgage or rent face serious financial obstacles regardless of what age they are.  Young are facing outrageous housing and mortgage costs.  Senior singles who have to rent face serious quality of life issues when their rent is beyond what  they can afford.  Also, financial analysts state that most singles cannot have a mortgage and save at the same time, they only can do one or the other.

What some politicians’  and other responses have been so far

Blog author has been blogging about financial discrimination of singles for almost a year and has been attempting to contact government and politicians regarding this issue.  Here are a couple of absurd responses received so far (none have been positive).

One politician said that if singles are having problems with affordable housing, they can seek assistance.   Community Housing in Alberta is a subsidized rental program, but to qualify assets and belongings cannot exceed $7,000.  Really, $7,000? (Assets in pension funds, registered retirement savings plans, or registered retirement income funds are not included in calculation of assets.  So this means, subsidized housing can be given to those with considerable assets).   Another answer stated that maybe charitable and social agencies need to include singles in assistance that is already provided to low income persons and single parent families.  Really?  This is another slap in face answer that does nothing to solve the affordability housing problem for singles.

Singles continually get told by married or coupled persons that singles can go live with someone if they have problems with being able to afford housing.  At a session on affordable and inclusive housing, blog author was told as much by one gentleman from around Springbank (one of most expensive areas to live in Canada) who was so proud that he was able to winter every year in Arizona.

When reading or listening to articles on housing for families, families will always talk about how important their housing is for them in regards to entertaining and maintaining close ties to friends and families.  They talk about about how their ‘hearts are eternally and inexplicably changed’ when bearing their children, but same hearts appear to become ‘hearts of stone’ when these same children become adult singles, low income or no income persons and families.

It often appears that desired results have been achieved for what married/coupled persons and families think are appropriate for singles.  Singles can now sleep in spaces that are two hundred square feet in size.  It seems these same people no longer consider singles to be their children or part of the family.  Instead, the state of business has overtaken the value of family to the point of unadulterated greed.

Singles deserve better in affordable housing solutions.  When they talk to government, decision makers and families about lack of affordable housing, they are met with anger, shunning and deaf ears.  They are given the response that it is ‘what the market can bear’.

Every adult with marital status of being single deserves a living wage and a dignified place to live that is equal to adults in families.  Every adult with marital status of being single deserves to be included in financial formulas that are equal in benefits to adults in families.  Every adult with marital status of being single children of families deserves to treated with same financial dignity and respect as married/coupled children in same family.

Single employables (singles and single parents) deserve the same financial dignity and respect as married/coupled persons with and without children.  Singles and single parents (white, aboriginal and of immigrant status) deserve to be included in financial formulas at the same level as married or coupled persons with and without children.

Financial discrimination of singles is accepted in mainstream and is, indeed, celebrated.  Article like “It Pays To Be Married” (marrying-for-money-pays-off) implies married/coupled persons and families are more financially responsible.  From “Ten Events in Personal Financial Decathlon Success” (financialpost), the Family Status step says: ‘From a financial perspective, best scenario is a marriage for life.  It provide stability for planning, full opportunities for tax planning and income splitting and ideally for sharing responsibilities that can enhance each other’s goals and careers.  One or two divorces can cause significant financial damage.  Being single also minimizes some of the tax and pension advantages that couples benefit from’.  How nice!

CONCLUSION

  1.  It is morally, ethically and socially reprehensible and irresponsible when government, businesses and families don’t recognize singles and continue to violate one of the basic principles of Maslow’s Hierarchy of Need, that is shelter.
  2. It is morally, ethically and socially reprehensible and irresponsible when government, businesses and families don’t recognize singles and continue to violate what has been deemed by international organizations to be a violation of the Human Rights of all Canadian Citizens, that is housing.

(From Wikipedia) “The right to housing is recognised in a number of international human rights instruments. Article 25 of the Universal Declaration of Human Rights recognises the right to housing as part of the right to an adequate standard of living. It states that:

Everyone has the right to a standard of living adequate for the health and well-being of himself and of his family, including food, clothing, housing and medical care and necessary social services, and the right to security in the event of unemployment, sickness, disability, widowhood, old age or other lack of livelihood in circumstances beyond his control.

Article 11(1) of the International Covenant on Economic, Social and Cultural Rights (ICESCR) also guarantees the right to housing as part of the right to an adequate standard of living.

In international human rights law the right to housing is regarded as a freestanding right. This was clarified in the 1991 General Comment no 4 on Adequate Housing by the UN Committee on Economic, Social and Cultural Rights. The general comment provides an authoritative interpretation of the right to housing in legal terms under international law.”

OTHER CONSIDERATIONS

  1. It is morally, ethically and socially reprehensible and irresponsible when government, businesses and families continue to be uneducated (illiterate)and completely unaware of what it costs singles to live in comparison to families in relation to equivalence scales.  
  2. It is morally, ethically and socially reprehensible and irresponsible when government, businesses and families discriminate based on marital status.  Discrimination based on marital status is a also a violation of human and civil rights.
  3. It is morally, ethically and socially reprehensible and irresponsible when government, businesses and families continue to exclude singles from financial formulas and housing solutions.  Singles need to be included in all financial formulas.
  4. Equivalence scales (equivalence-scales-in-relation-to-cost-of-living) – if there anything that is can be so eye-opening in describing how financially disadvantaged singles are in comparison to families for cost of living, it is equivalence scales.  Member of National Housing Survey need to educate themselves in this regard.
  5. Real estate fees have reached an outrageous level of unaffordability.  These fees, in addition to outrageous housing prices, need to be addressed.

In present political system, singles are losing financial ground.   Words ‘individuals’ or  ‘singles’ rarely come to the financial lips of politicians, families or media.   What is needed is to bring financial issues of singles to same financial table as families and to make positive changes for both parties.  Singles who have worked for forty years, never used EI and helped to support families through wedding and baby gifts, education taxes and other taxes so that families can have maternity and parental benefits, child benefits, widow and survivor benefits, etc. deserve same financial respect as families.  Singles never get any thanks and are never recognized for their contributions.  The only benefits singles ever receive is if they are in abject poverty.  Singles are not asking for more financial benefits than families, but equivalency to family benefits as applicable as shown in equivalence scales.  They deserve this as citizens of this country.

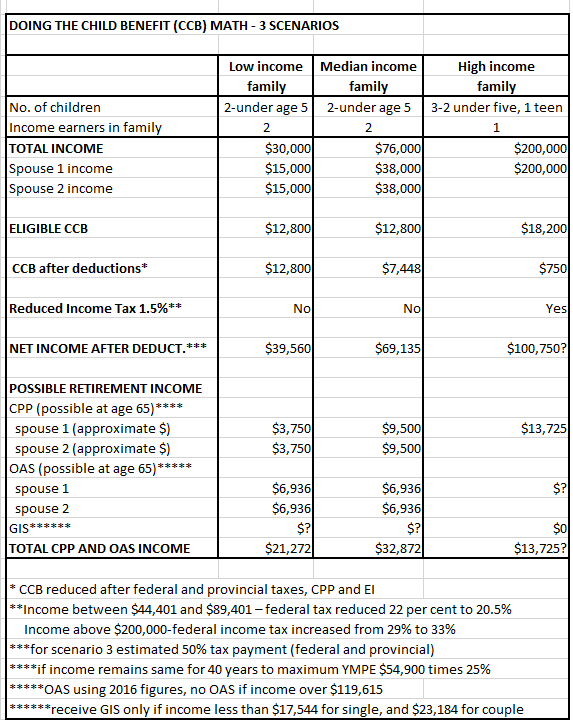
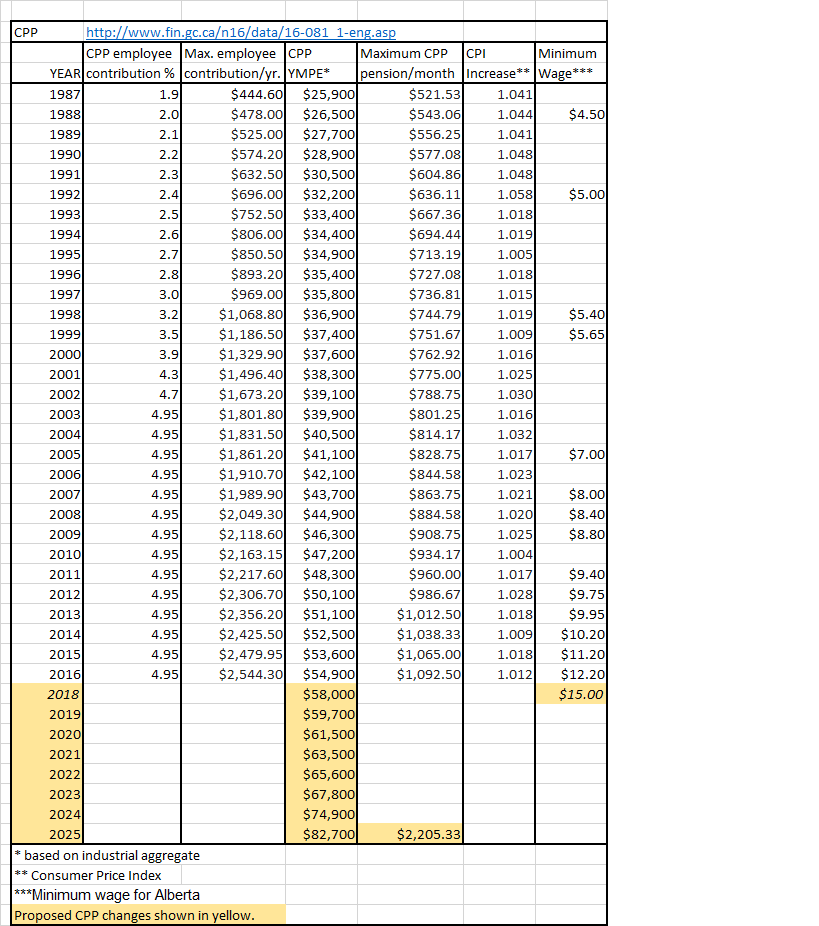
Quite frankly, with all the rhetoric, surveys, solutions and bafflegab, this author is very pessimistic and believes CMHC and others involved in this project are going to fail, and will fail miserably.  Unaffordable housing will not be resolved UNLESS THE MINIMUM WAGE IS RAISED TO A LIVING WAGE AND TO A LIVING WAGE THAT IS INDEXED TO INFLATION.  Success will only be achieved if innovative solutions AND a living wage occur simultaneously.   Everything that occurred in the last decade by government, businesses, and families in regards to financial solutions has benefitted only the upper middle class families, not singles and the poor.  (Blog post on CPP enhancements, August 31, 2016 further supports how lack of minimum wage and schizophrenic programs further discriminate against singles and the poor-CPP a federal program while minimum wage is a provincial program).

List of some of the blog posts regarding housing and financial discrimination of singles and the poor:

  1. False assumptions – ‘Four Ways Senior Singles Lose Out’  (false-assumptions)- December 2, 2015 -describes how one financial analyst shows singles lose out on married or coupled family unit tax advantages, lose out on tax and pension systems tilted to benefit couples, lose out on benefits, face higher tax bill, and face OAS recovery tax.  The sad fact is that this financial analyst was talking about widowed persons, not ever singles.
  2. Senior Singles pay more – Parts 1 to 4 – December 5 (senior-singles), Dec. 9 (part-2), Dec. 12 (part-3), and Dec. 22, 2015 (part-4), – show the many ways that senior singles pay more and get less over their married or coupled family unit counterparts.
  3. To rent or own affordable housing – that is the question January 10, 2016 (to-rent-or-own-affordable-housing)
  4. Continued Financial illiteracy of financial gurus equals financial discrimination of singles – Part 2  February 28, 2016 (financial-illiteracy) – blog author’s perspective on yet another financial analyst (Broadbent Institute) providing incomplete facts about what it costs singles to live, inappropriate classification of singles, and not including home equity as a retirement asset.
  5. Incomplete reporting of news and media articles promote financial inequality of singles to married/coupled persons March 24, 2016 (financial-inequality-of-singles-to-marriedcoupled-persons– inability to say the word ‘single’ or ‘individual’ promotes financial discrimination of singles.
  6. Lost dollar value list to date – April 10, 2016 lost-dollar-value-list) (attached table – please see article for full description of items) lost dollar value table
  7. Singles deserve affordable housing and financial fairness for singles April 13, 2016 (singles-deserve-affordable-housing)– talks about a San Francisco single person who created a private sleeping space in the living room of an apartment he shares with other roommates (one bedroom apartments rent for $3,670 a month).  He sleeps in a wooden box (he calls it a ‘pod’) that is eight feet long,  four and a half feet tall and probably about five or six feet wide)
  8. Rental or affordable housing – misconceptions about psychological impact on singles April 20, 2016 (affordable)
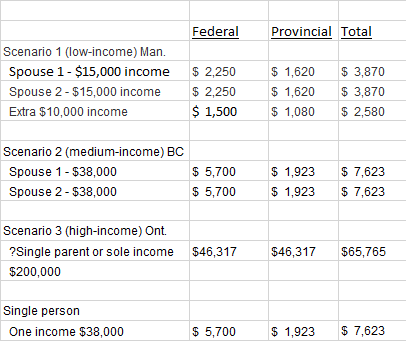
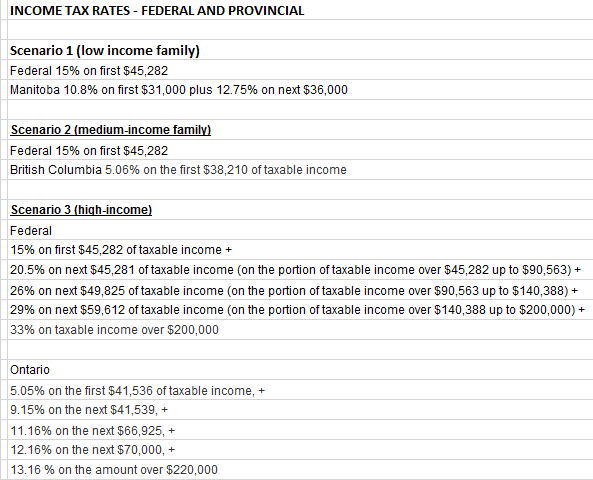
  9. Real financial lives of singles April 24, 2016 (real-financial-lives-of-singles-and-financial-discrimination-of-singles) –  shows financial profiles of three married or coupled family units and three ‘singles’ from various backgrounds
  10. Homelessness in Canada bigger problem for singles and poor single parent families May 23, 2016 (homelessness-in-canada-bigger-problem– study on single employables comprised of singles and single parents and how they are having a very difficult time surviving on low wages and lack of affordable housing
  11. Affordable housing not party of Conservative Party definition July 17, 2016 (affordable-housing-not-part-of-conservative-party-definitionappropriate housing definition and how Conservative party after 40 year reign in Alberta contributed very little to affordable housing during the oil boom)
  12. Improper definition of single status promotes financial discrimination August 7, 2016 (improper-definition-of-single-status-promotes-financial-discrimination)
  13. Equivalence scales August 17, 2016 (equivalence-scales-in-relation-to-cost-of-living see article for further description of scales and application in Canada)equivalence scales
  14. History of family tax credits over decades are financially discriminating to singles Part 2 of 2 August 23, 2016 (history-of-family-tax-credits-over-decades table – see article for full description)

family tax benefits over lifetime

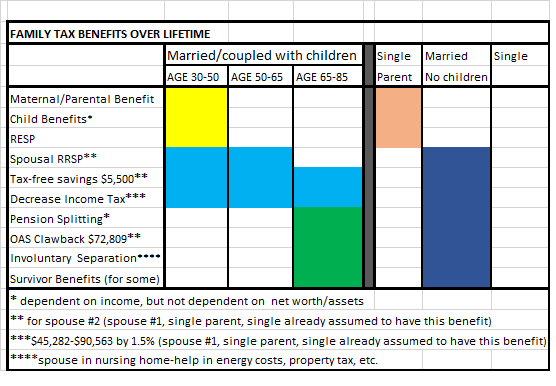
The above table shows benefits available to a married or coupled family units with children from time they are able to use maternal and parental benefits to time of death of one spouse (yellow, blue and green fill in).  Single parents only have benefits related to their children (orange fill in).  Married or coupled family units without children have all the benefits related to having a spouse or partner (navy fill in).  Ever singles and early divorced singles have none of the benefits available to married or coupled family units (fill in is blank because they have none of the benefits of spouse #2.  In addition, they are often are unable to max out RRSP and TFSA contributions).  (While late in life divorced singles have none of the benefits for spouse #2, they may have been able to accumulate more net worth and assets while they had a spouse or partner).

15.  Boutique tax credits pushing singles into poverty Part 1 of 2 June 23, 2016 (boutique-tax-credits) and Part 2 of 2 July 3, 2016 (part-2-of-2) – shows how family tax credits given to families with high net worth (brought in by Liberal party this year) are financially discriminatory to singles and are actually pushing them into poverty

16.  Six Reasons Why Married/Coupled Persons are Able to Achieve More Financial Power (Wealth) than Singles (six-reasons – see article for further description – for marital manna benefits an example of a gourmet ice cream cone where married/coupled persons get additions of chocolate sauce and sprinkles, but singles only get the ice cream and cone)

“LETS TALK HOUSING” survey link (letstalkhousing)

(This blog is of a general nature about financial discrimination of individuals/singles.  It is not intended to provide personal or financial advice.)

POLITICAL STATEMENTS AGAINST THE NDP PARTY ARE BLATANTLY FALSE AND FINANCIALLY DISCRIMINATORY

POLITICAL STATEMENTS AGAINST THE NDP PARTY ARE BLATANTLY FALSE AND FINANCIALLY DISCRIMINATORY

(These thoughts are purely the blunt, no nonsense personal opinions of the author about financial fairness and discrimination and are not intended to provide personal or financial advice).

A recent opinion letter in a local newspaper prompted this blog post.  The letter again targets the Alberta NDP party for socialism of the rich instead of the Conservative party.  “Westhead must be too busy to read history books” (since) he states: ‘Albertans do want to return to the past; but not to this misfit ideological premise about socialism for the rich and austerity for everyone else that the NDP conjured.  While Mr. Westhead mistakenly believes there was socialism for the rich in Conservative Alberta, his solution is a failing socialist ideology for all.  Your government has downloaded a debt, taxes and policies that are a burden to families….voting Conservatives in again in 2019 – Alberta will return to the free enterprise, socially reliable province it once was”. He is referring to many Harper oil pipelines (good) and NDP carbon tax (bad).

Re statements on socialism and left-wing politicians, analysis shows federal and provincial Conservative and Liberal policies surreptitiously and purposefully eliminate the middle class, thus practising selective social democracy (socialism).  Advertently or inadvertently, future class system will consist mainly of the poor, upper-middle class and wealthy while favouring married or coupled family units with multiple ‘marital manna benefits’.

During federal Conservative and Liberal party reigns, even while reducing social programs helping vulnerable populations of aboriginals and veterans, introduced programs like TFSAs (Harper 2009) pension splitting (Harper 2007) and OAS clawback (Harper 2011) particularly benefit the wealthy and married or coupled family units.  In OAS clawback only about five percent of seniors receive reduced OAS pensions, and only two percent lose entire amount.  Why should married or family units who have never had children (double income, possible double TFSA and RRSP) be able to ever use pension splitting, no OAS clawback plus tax avoidance schemes for couples while singles get nothing comparable?

During provincial Conservative party forty year reign and oil boom, just 1,048 new affordable housing units in Calgary were built over the past 14 years.  Two thirds of shelter beds in Canada are filled by people who make relatively infrequent use of shelters and are more likely forced into shelters by economic conditions (due to structural factors, the state of housing and labour markets that destine the very poor to be unable to afford even minimum-quality housing).  In 2001, Alberta Conservatives brought in 10% flat tax, raising the tax rate from 8% to 10% for lowest income Albertans.  There never has been an Alberta Advantage for the poor.

Federal Liberals have continued Conservative benefit programs like Canada Child Benefit in perpetuity which is based on income and number of children, but not net worth and assets, so families may receive large tax free child benefits and continue increasing wealth even while already having huge assets.

Elimination of the middle class is also evident in Liberals’ proposed Canada Pension plan enhancements without an increase in minimum wage (canada-pension-plan).  Persons with highest YMPE of $82,700 (massive jump from 2016 $54,900) and forty years of contributions may receive 33 percent CPP benefit or about $2,300 per month, while those making a minimum wage of $15 per hour, $30,000 annual income with forty years of contributions may receive about $800 per month. CPP pensions are dependent on salaries.  CPP contributions are not collected on boutique tax credits.  Low salary equals low CPP retirement pensions.

Calculations of a simplistic nature on $10 minimum wage and 2,000 hours shows that Alberta family with two children and each spouse earning $20,000 without any other deductions or benefits will pay about 15% Federal tax and 10% AB tax for a total of $5,000 each and receive full Canada Child Benefits (CCB) of $12,800.  Family income will equal about $42,800.  CPP pension at age 65 in 2016 dollars may equal about $5,000 per person annually.  If $15 minimum wage or $30,000 each  is applied, total Federal tax and AB tax will be $7,500 each.  Family income will equal $57,800 with full CCB $12,800 benefits since reductions only begin at $30,000.  CPP pension might equal about $7,500 per person.  

Above calculations easily show increased minimum wage income for a poor family benefits everyone through collection of increased taxes, less dependency on government handouts, greater financial well being and CPP retirement benefits for the income earner, and the economy through increased spending on goods and services.

Schizophrenic political systems exist where CPP pension enhancements are controlled federally, but minimum wages are controlled provincially.  The continued unwillingness of government and business to promote minimum wage increases to indexed living wages means the poor will remain in poverty even with pension systems that are supposed to improve financial quality of life as seniors.  The new NDP childcare program is the right thing to do, but it should be balanced by reductions of other boutique credits.  However, this is impossible, again because of provincial versus federal control.  Continuing to add monetary programs for select family groups will continue to drain the financial system if boutique tax credit programs and tax avoidance schemes where upper-middle class and wealthy benefit the most are not eliminated in their entirety.  Net worth and assets need to be included in any financial program so that the poor and lower class benefit the most from these programs.

The effects of this ‘income redistribution’ and ‘culture of dependency’ that the right claims they are not guilty of will result in future generations being ridden with high taxes because of high debt level to service these programs.  Where are the economists and financial advisors for the government so that outside the box solutions for financial equality of Canadians regardless of marital  status and using a balanced approach so that all financial programs are reviewed against each other for financial validity and fairness?  Canadians deserve much better financially from their political parties.

Upside-down financial systems and marital manna benefits have created a nanny state where families want it all and once these benefits are in place, it is very difficult to eliminate them because of voter entitlement.  Upper middle class and wealthy married/coupled persons have been made irresponsible by their own politicians and government.  The right keep talking about overspending, but they fail to mention that their boutique tax credits have resulted in upper-middle class and wealthy not paying their fair share of taxes.

Financial silos (tax-credit) are filled to the brim for families and married persons, but remain empty for singles and the poor.  Pipelines and boutique tax credits without steady rise of minimum wage and greedy oil salaries without tax avoidance capabilities means less tax revenue to fill financial coffers, less food on the table and demeaningly low CPP pensions in retirement for the poor.  Every political party has been guilty of vote getting tactics.  Canadians are fed up and disheartened by the divisive nature of politics which seems to serve only the political parties and their wealthy constituents.

(This post was updated on November 30, 2016).

(This blog is of a general nature about financial discrimination of individuals/singles.  It is not intended to provide personal or financial advice).

DECEASED CANADIAN SINGLE SOLDIERS AND 9/11 VICTIMS FINANCIALLY WORTH LESS THAN DECEASED MARRIED SOLDIERS AND 9/11 VICTIMS

DECEASED CANADIAN SINGLE SOLDIERS AND 9/11 VICTIMS FINANCIALLY WORTH LESS THAN DECEASED MARRIED SOLDIERS AND 9/11 VICTIMS

(These thoughts are purely the blunt, no nonsense personal opinions of the author about financial fairness and discrimination and are not intended to provide personal or financial advice.)

(singles-need-to-learn-how-to-articulate-financial-discrimination-of-singles)

This post is about the financial discrimination faced by deceased singles.   Two cases outlined include Canadian single soldiers and deceased single 9/11 victims.  The sources of news articles on which the deceased Canadian single soldiers information has been based are included at the end of this post.

FINANCIAL DISCRIMINATION OF DECEASED CANADIAN SINGLE SOLDIERS

Several complaints on what was felt to be financial discrimination against deceased Canadian single soldiers were brought before Canadian federal human-right tribunals.  It appears that these complaints have resulted in gross human rights violations based on marital status.  Some of the names of the deceased involved are Cpl. Matthew Dinning, Pte. Braun Scott Woodfield, Pte. William Cushley, Trooper Jack Bouthillier, Trooper March Diab.

The death benefit in question was the $250,000 lump-sum death benefit to be given only to the families of married or common-law soldiers.  Revisions to the Veterans Charter were approved in 2005 so that when a married or common-law Canadian soldier is killed in action, the surviving spouse and children are eligible for a one-time, $250,000 lump-sum to help them with the costs of transitioning to civilian life. The cash is on top of whatever life insurance the deceased has (Supplementary Death Benefit-covers all Canadian Forces members at two years salary which goes to the person whom they designate-and Military Life Insurance which they can purchase through SISIP).

Under the old system, the federal government paid a supplementary death benefit, calculated at two times the member’s annual earnings.  The cash went to the spouse, or another designated beneficiary of the soldier. If there was no beneficiary, the money would go into the estate.

As of 2011 less than about half of the deceased soldiers in Afghanistan have been single.

The issues behind the complaints are outlined here.

  1. VIOLATION OF CANADIAN LAW AND CANADIAN REVENUE AGENCY (CRA) BY CHANGING MARITAL STATUS

The parents of Pte. William Cushley issued a complaint on why they did not receive same compensation as married or common-law deceased soldiers.  The final result of a federal human-rights tribunal rejected the complaint of Lincoln and Laurie Dinning for Cpl. Matthew Dinning because Veterans Affairs abruptly decided to recognize their son’s girlfriend of a couple of months as his common-law spouse, technically making him no longer single even though she had not lived with him for a year (marital-status).  “An eleventh hour offer by the Department to recognize Dinning’s girlfriend as a common-law spouse was no doubt done to try to quash the hopes of other families challenging the government on the discrimination related to this death benefit.” Definitions clearly state couples have to co-habitat for a year before declaring common-law status.

Veterans Affairs clearly violated the law by changing the marital status of the deceased single soldier from single to common-law spouse.

2.  DECEASED MARRIED SOLDIERS RECEIVE $250,000 DEATH PAYOUTS, BUT DECEASED SINGLE SOLDIERS DO NOT

As stated by one of the parents:  “You have four men killed in the same battle, three of them are paid $250,000, (but) William does not qualify because he is single. It doesn’t make any sense to me.”

3.  DATE OF DEATH FELL OUTSIDE DATE OF APPROVAL

Relatives of Pte. Braun Scott Woodfield, who died in a military vehicle accident in November, would be sharing a $250,000 tax-free payment specially authorized by cabinet to compensate for his death while on duty…..But records released under the Access to Information Act indicate Woodfield’s family was excluded from the cabinet order, which gave a total of $1 million to four other families grieving over military deaths. That’s because Canada’s new Veterans Charter, which for the first time provides a non-taxable $250,000 death benefit, was passed by Parliament on May 13, (2005)  last year but didn’t come into effect until April 1 (2006) this year. Deaths that occurred in the interim were not covered by the charter….  His death benefits were then denied because he was single.

4.  DECEASED SINGLE SOLDIERS DO NOT QUALIFY IF THEY DID NOT MEET DEFINITION OF ‘SURVIVOR’

“But Woodfield’s family will not get a red cent because under the Veterans Charter, only “survivors” can receive the $250,000 death benefit. And because survivors are defined only as dependent children, spouses or common-law partners, Woodfield – as a single man with no children – had no “survivors” to receive any cash.

Instead, the cabinet order provided the money to the surviving spouses, common-law partners and children of three men killed in Afghanistan, as well as to the two daughters of Warrant Officer Charles Sheppard, who died in a parachuting accident at Trenton, Ont., on Oct. 3, 2005.”

“Pte. Woodfield is not eligible because he does not have a survivor or any dependent children,” Veterans Affairs spokeswoman Pamela Price confirmed in an interview. Woodfield’s mother said the Veterans Charter policy should be changed to help the next-of-kin of unattached soldIers.

“In a sense, you felt that my son was less of a person, as a single person,”…..

The death benefit under the Veterans Charter is unusual because of its restriction to so-called “survivors,” since single soldiers with no children have long been unconditionally eligible for almost all other death benefits provided by the military.

For example, the Canadian Forces pays for the funerals and burials of all serving members killed on duty, as it did for Woodfield.

National Defence spokesman John Knoll said the Forces also pay supplementary death benefits – two years of salary, tax-free – to the estate of the member or to his or her designated beneficiary. The military will also provide severance pay to the estate or designated beneficiary, seven days’ pay for each year of service.

And any pension entitlements that had been accrued by deceased members go to a designated beneficiary or the estate if there is no spouse, common-law partner or children, he said.”

5.  VETERAN AFFAIRS ARGUES THAT THIS DEATH BENEFIT IS NOT LIFE INSURANCE AND IS SPECIFICALLY TARGETED TO HELP FAMILIES AFTER SOLDIER’S DEATH AS SPOUSE OR PARENT

Veterans Affairs has argued that the death benefit is not life insurance and the payout is specifically targeted at families to help them transition to civilian life. Lawyers for the department, in written submissions, have said the federal government isn’t obliged to pay compensation in every circumstance.

Other comments from news articles:  “Lincoln Dinning, Matthew’s father, said he would never have filed the human rights complaint, which alleged the government discriminated against single soldiers, had there been a spouse in the picture at the outset”.

“Single soldiers can choose to take out life insurance and make payable, for example, to his or her parents or estate. That kind of insurance can only be obtained through the Service Income Security Insurance Plan (SISIP) Long Term Disability, a government-directed insurance program for the Canadian Forces.  But the Royal Canadian Legion, representing 340,000 members across the country, said the one-time death benefit is clearly meant to cover pain and suffering, not economic loss, which is covered other benefit packages”.

“Errol Mendes of the University of Ottawa says it’s clearly established in law that discrimination based on marital status violates the Charter of Rights and Freedoms and he wonders why Veterans Affairs still supports the practice.  “There is a compelling case on the part of single soldiers,” Prof. Mendes said yesterday. “Whether or not there is a legal case, there is a huge moral, social, ethical and political reason why the government should be covering this.”

Reader comment-”The stated purpose is to help transition the soldier’s immediate family from a military life to a civilian life, due to the loss of income, housing, support network etc. It is not meant to recognize their sacrifice through a financial payout. That being said, if a single soldier has elderly/infirm parents or siblings that he/she is legally responsible for, the money should be paid out in those instances. And hopefully the member made arrangements beforehand in case this happens (setting up trusts etc.).”

Reader comment-Another aspect that cannot be ignored are these scenarios:  “If a single soldier is gravely injured, and an application is subsequently made on their behalf for the Disability Benefit, and they then die more than 30 days later, then the Disability Benefit would be issued to the estate at a rate of 100% disability.  If a single soldier is killed instantly, then no Death Benefit is issued, period.  A 100% Disability Benefit is exactly the same amount as the Death Benefit, but only one of these scenarios generates a benefit – dependent upon when the veteran dies.  Doesn’t sound quite so equal.  I can see why there are arguments that the Death Benefit should be paid to the Estate, not to the survivor.”

Other documents dated after the charter’s implementation, showed veterans groups were concerned about the exclusion of single soldiers from the payment, but Veterans Affairs placated them by saying it was prepared to “explore any gaps or omissions” and to “make changes to the (New Veterans Charter) to the extent possible.”

Comments from Veteran Affairs Canada -“Although other family members, such as parents, also suffer from the loss due to the sudden death of the Canadian Forces member, they do not face the same financial impacts as the spouse/common-law partner and/or dependent children of the Canadian Forces member,” Janice Summerby, a spokeswoman for Veterans Affairs Canada, said in an email statement to the Star.

Summerby added that single soldiers can choose to take out life insurance and make payable, for example, to his or her parents or estate. That kind of insurance can only be obtained through the Service Income Security Insurance Plan (SISIP) Long Term Disability, a government-directed insurance program for the Canadian Forces.  But the Royal Canadian Legion, representing 340,000 members across the country, said the one-time death benefit is clearly meant to cover pain and suffering, not economic loss, which is covered other benefit packages.

“It is one of the deficiencies that we identified in the new Veterans’ Charter . . . that it is a discriminatory practice that married members receive a death benefit but single members don’t receive a death benefit. The Legion believes that all Canadian forces members killed (in the line of duty) … be granted a death benefit,” Andrea Siew, of the Royal Canadian Legion in Ottawa, told the Star.

Siew said the death benefit is not about financial compensation for the loss of income, “it is an award payment for the non-economic loss associated with pain and suffering. It is very clear in the legislation it’s about that.”

FINANCIAL DISCRIMINATION OF 9/11 SINGLE VICTIMS

“What Is the Life of a Single Person Worth?” from ‘Singled Out, How Singles Are Stereotyped, Stigmatized and Ignored, and Still Live Happily Ever After’ by Bella DePaulo, Ph.D., St. Martin’s Griffin, New York, 2006,  page 228 (singlism).

“After the terrorist attacks of September 11, 2001, the U.S. government created a  fund to compensate the families of the victims.  Compensation was calculated separately for each victim, based in part on projected lifetime earnings and other sources of money.  In addition, each family was paid a standard $250,000 for pain and suffering.  The final component was an extra $50,000 for spouses and for each child.  According to these calculations, the lives of single victims are automatically worth less than those of married victims.  The $50,000 that would go to a married victim’s spouse would not go to any living person who cared about the victim who was single.

The Victim Compensation Fund declared in cold, hard numbers that in contemporary American society, the life of a single person is worth less than the life of someone who is married.  That’s only one of the reasons I find it interesting.  The fund also makes another set of values unusually clear.  A relationship with a spouse is considered worthier than any other adult relationship, including even ties to parents or siblings.  Said the mother of one of the 9/11 victims, “When they did this formula, why didn’t they consider the parents?  My daughter-in-law was married for five years.  We had Jonathan for 35 years”

The person in charge of the excruciating task of assigning a dollar value to victims’ lives, attorney Kenneth Feinberg, had second thoughts about the matter after the job was completed.  In the book he wrote about his experiences, he concludes that if Congress ever decides to create such a fund again, all victims should be valued equally”.

CONCLUSION:

From examination of these two cases, it is apparent that even in this era of enlightenment where discrimination is supposed to be recognized and eliminated, financial discrimination of singles is as rampant as it ever was decades ago.

Observations include the following:

  • Financial discrimination of singles continues even when they are deceased.  The financial lives of deceased singles are viewed to be worth less than married or common-law deceased persons.
  • Blatant manipulation of marital status done by Veteran Affairs just to avoid legal ramifications is a violation of the law and human rights of singles.
  • There is a clear legal process to follow in the distribution of financial assets of singles and married or common-law families.  For singles, distribution is determined by wills and estates; for married or common-law families, distribution is determined by spousal and child dependents first, then parents and siblings in accordance with wills, estate and pre-nuptial agreements, so why would Veterans Affairs try to usurp this legal process?
  • In the 9/11 victims article, the following statement is in the eye of the beholder and can be viewed from different angles:  Said the mother of one of the 9/11 victims, “When they did this formula, why didn’t they consider the parents?  My daughter-in-law was married for five years.  We had Jonathan for 35 years.”  First, when children marry, the proper thing for parents to do is to give up their parental rights and allow their children to become their own family units with their own rights, so why should parents feel they are entitled to victim’s benefits over the spouse and children dependents of the victim? Second, as stated above there is a clear legal process for determining who will receive benefits.  Spouses and children take first priority followed by parents and siblings further down if spouse and children are all deceased as determined by law.
  • Kenneth Feinberg, had second thoughts about the matter after the 9/11 job was completed and concluded that if Congress ever decides to create such a fund again, all victims should be valued equally.  (Just a little too late, don’t you think)!
  • It should be very clear how important wills are to prevent possible infighting that can occur over death benefits.
  • All deceased persons deserve the same death benefits regardless of marital status.

MEDIA ARTICLES

Denying death payment to single soldiers’ families discriminatory, family claims from The Canadian Press-The News June 6, 2010 (Denying-death-payment-to-single-soldiers)

‘Family of Canadian Soldier in Afghanistan not getting death  benefit after all’ From Canadian Content at 15:26 on June 18, 2006, EST. By DEAN BEEBY (soldier-family)

Single soldier’s parents denied compensation for his death, The globe and mail, by Dean Beeby,  June 19, 2006 (single-soldiers-parents-denied-compensation-for-his-death)

Extending benefits to families of single soldiers would cost $3M, the Canadian Press, March 20, 2011(extending-benefits-to-families-of-single-soldiers-would-cost-3m)

‘Families of single soldiers say death benefit unfair’, CBC News, The Canadian Press, Dec. 1, 2011 (cbc.ca/news)

Parents of fallen soldiers fight for benefits by Kris Sims, Atlantic Bureau, December 1, 2011 (parents-of-fallen-soldiers-fight-for-benefits)

‘Investigation needed into government treatment of veteran’s families fighting for death benefit’ , NDP website, December 1, 2011 (ndp.ca/news)

‘Family fights for soldier’s death benefit’ by Cathy Dobson, Sarnia Observer, December 3, 2011 (family-fights-for-soldiers-death-benefit)

‘No equality’ in not paying death benefit to single soldiers, says father’ by Richard J. Brennan, National Affairs Writer, Dec. 19, 2011 (thestar)

The Death Benefit for Single Members Merged Thread (p. 33 and 44 of 47) Pages: << < (33/47) > >>

(This blog is of a general nature about financial discrimination of individuals/singles.  It is not intended to provide personal or financial advice.)

DOING THE MATH ON FAMILY TAX CREDITS SHOW FINANCIAL DISCRIMINATION OF POOR, LOWER MIDDLE CLASS FAMILIES AND SINGLES-Part 2 of 2

DOING THE MATH ON FAMILY TAX CREDITS SHOW FINANCIAL DISCRIMINATION OF POOR, LOWER MIDDLE CLASS FAMILIES AND SINGLES-Part 2 of 2

(These thoughts are purely the blunt, no nonsense personal opinions of the author about financial fairness and discrimination and are not intended to provide personal or financial advice.)

Part 2 of 2 of ‘Doing the math…’ provides further discussion on the comments of the financial analysts in Part 1 of 2.  Regarding the Canada Child Benefit, it is difficult once again to understand the financial intelligence of politicians and government and whom they consult when formulating their policies.

Repeated again from part 1 of 2 are the following scenarios from “Doing the child benefit math” by Jamie Golombek (financialpost), Financial Post, September 30, 2016 showing financial evaluation performed by Jay Goodis from Tax Templates Inc.  This evaluation shows the impact of CCB on various levels of income in 2016, the after-tax cash they would keep along with their effective tax rates.

‘Scenario 1 – Low-income family

A Manitoba family has two kids under five and two working parents, each earning $15,000 of employment income. They are eligible for the entire CCB of $12,800; after paying CPP, EI, and a bit of tax, they net $39,560 of cash.

What would happen if one parent was able to work more, or was to get a higher paying job, such that she now made $25,000 — an increase of $10,000?  While she’s still in the lowest federal and Manitoba tax brackets, once you factor in the loss of CCB, the additional tax, CPP, and EI, her take-home extra cash is only $5,563, resulting in an effective marginal tax rate of a whopping 44 per cent (39 per cent if you ignore the additional CPP and EI contributions.)

As Goodis observed: “The CCB skews the progressive tax system and imposes a high effective tax on low income earners with children.”

Scenario 2 – Median-income family

A British Columbia couple has two children under the age of five. Their family’s income, consisting solely of employment income, is $76,000 split equally between each spouse. Their $12,800 of CCB is reduced to $7,448; and after federal and provincial taxes, CPP, and EI, the family nets $69,135 of cash. In other words, even with the clawback of some of their CCB, the couple has kept 91 per cent of their earned income.

Scenario 3 – High-income earner

Finally, consider an Ontario professional with three kids, two under five and one teen, earning $200,000 annually.  His CCB will be about $750 for the year.  If he were to earn an extra $1,000 of income, he would keep only just under $400 of it, resulting in an effective marginal tax rate of just over 60 per cent once loss of CCB is taken into account.’

DISCUSSION

Several points of interest will be discussed in regards to the Canada Child Benefit:  1)  income tax and marginal tax rates with increased income, 2)  CPP contributions and pensions, and 3) the effect of minimum wage and Canada Child benefit on the economy and future entitlements like the Canada Pension Plan (CPP).

NOTE:  The marginal tax rate is the tax rate paid on last dollar of income and rate likely to be paid on next dollar of income-it is usually more than what is actually paid in tax because basic exemptions like CPP contributions and EI, and other benefits on provincial level, GST rebate, etc. have not been taken into consideration.

  1. INCOME TAX RATES FEDERAL AND PROVINCIAL (cra)

The following shows the likely actual federal and provincial tax rates shown in the three scenarios (the federal and provincial rates used in the calculations are shown at the end of the post).

Taxes paid do not show other possible deductions taken off (CPP and EI), non refundable tax credits and additional benefits (GST rebate) added on to income:

income-tax-rate-scenario-1-to-3

In scenario 1 (low-income family), the financial analyst makes the statement that if one spouse earned an extra $10,000 she would pay an effective marginal  tax rate of a whopping 39 per cent factoring in the loss of the CCB and without additional CPP and EI contributions.  Her take-home extra cash is only $5,563.  However, with calculation of possible additional actual tax rate of $2,580, and reduction of $12,800 CCB by $896, her take home income with the additional $10,000 would be $10,000 minus $2,580 minus $896 for CCB for total extra cash of $6,524.  Whether it is an additional $5,500 or $6,500 why is this not considered to be a good thing, when even though she has more income tax deductions and small decrease in CCB, she has much more money to spend on her family while benefitting the Canadian economy through additional use of goods and services and additional income tax to be used for public services?

In scenario 2 (middle-income family), the financial analyst states that ‘ even with the clawback of some of their CCB, the couple has kept 91 per cent of their earned income’.  That is a very good rate of return all because of tax-free CCB.  Another reason why they are able to keep such a large per cent of their earned income is that Province of BC has a 5.06% tax rate on first $38,210 while Manitoba in Scenario 1 has a provincial rate of 10.8% on first $31,000.

In scenario 3 (high earner) the financial analyst states that with just an additional $1,000 income the person will only take home an extra $400 using the marginal tax rate.  For poor people, the reaction might be “so what?” when take home income is already at level of $8,000 to $10,000 per month plus he has been able to use Liberal reduced income rate of 1.5% for income between $44,401 to $89,401 that scenario 1 and 2 have not been able to use.

For single person, income after tax would be approximately $30,377 or about $15 per hour.  This does not equal living wages to prevent homelessness for singles, examples of which are usually greater than $15 per hour (singles-finances).

  1.  CPP CONTRIBUTIONS AND PENSIONS

In scenario 1 (low-income family) it has been estimated that this family will have about $7,500 annual CPP benefits.  With the addition of just $10,000 income (and YMPE), resulting extra CPP contributions and reduced $896 CCB annual benefits, the CPP (using 2016 rates) annual benefits will jump from about $7,500 to $10,000.  This should be viewed as a good thing as the extra CPP benefits outweigh the reduced CCB benefits and will reduce poverty in retirement.

  1.  THE EFFECT OF MINIMUM WAGE AND CANADA CHILD BENEFIT ON THE ECONOMY AND FUTURE ENTITLEMENTS LIKE CPP
  • The more poor are taken out of poverty, the greater the benefits to everyone because the poor will be using less government boutique tax credits and handouts (CCB).
  • Increased minimum wage benefits income earners in retirement years through increased CPP contributions during working years.
  • Increased minimum wage benefits everyone through collection of increased taxes, financial well being of income earner, and the economy through increased spending on goods and services, thereby, increasing value to the economy.
  • Boutique tax credits that benefit only certain segments of society (families and married or coupled persons) and failure to increase the minimum wage are financially discriminatory and detrimental to low income persons and singles.

CONCLUSION

Why do we continue to allow politicians and governments to make bad financial decisions like forever increasing boutique tax credits,  increasing the wealth of the rich and not increasing the minimum wage when it can clearly be shown that increasing the minimum wage benefits everyone?  The creation of financial silos (financial-illiteracy) where one financial decision is made (example:  CPP enhancements) without looking at how this impacts other financial processes makes for very bad financial decisions.  ‘Selective’ social democracy (selective) where some family groups benefit more than other family groups only produce financial discrimination while benefitting the upper-middle class and the wealthy most.

The upside down financial decisions where boutique tax credits are brought in by one political party, eliminated or changed on election of another political party and increasing CPP benefits, but not increasing the minimum wages at the same time does nothing to provide financial stability for Canadian families, married or coupled persons and singles.

Outside the box and critical thinking like tri-partisan (all political parties) cooperation in financial decisions for all Canadians would create better decision making across the board and prevent schizophrenic political processes like CPP increases being controlled by federal governments and minimum wage increases being controlled by provincial governments.  All Canadians deserve better from their politicians and governments in financial decision making.

INCOME TAX RATES by FEDERAL AND PROVINCE (cra)

income-tax-rates


(This blog is of a general nature about financial discrimination of individuals/singles.  It is not intended to provide personal or financial advice.)

DOING THE MATH ON FAMILY TAX CREDITS SHOW FINANCIAL DISCRIMINATION OF POOR, LOWER MIDDLE CLASS FAMILIES AND SINGLES-Part 1 of 2

DOING THE MATH ON FAMILY TAX CREDITS SHOW FINANCIAL DISCRIMINATION OF POOR, LOWER MIDDLE CLASS FAMILIES AND SINGLES-Part 1 of 2

(These thoughts are purely the blunt, no nonsense personal opinions of the author about financial fairness and discrimination and are not intended to provide personal or financial advice.)

The Canada Child Benefit (CCB) consists of tax-free monthly payments that began in July, 2016 and provide maximum annual benefit of up to $6,400 per child under the age of six, and up to $5,400 per child ages six through seventeen.  This benefit is income-tested (but not net worth and assets tested), such that the amount depends not only on the family income, but also on the number of children and their ages.  (These amounts start being reduced when the adjusted family net income (AFNI) is over $30,000 and also is dependent on number of children in the family.  On the portion of adjusted family net income between $30,000 and $65,000, the benefit will be phased out at a rate of 7 per cent for a one-child family, 13.5 per cent for a two-child family, 19 per cent for a three-child family and 23 per cent for larger families. Where adjusted family net income exceeds $65,000, remaining benefits will be phased out at rates of $2,450 and 3.2 per cent for one-child family,  $4,725 and 5.7 per cent for two-child family, $6,650 and 8 per cent for three-child family and $8,050 and 9.5 per cent for larger families on the portion of income above $65,000).

The following scenarios from “Doing the child benefit math” by Jamie Golombek (financialpost), Financial Post September 30, 2016 shows financial evaluation performed by Jay Goodis from Tax Templates Inc.  This evaluation shows the impact of CCB on various levels of income in 2016, the after-tax cash they would keep along with their effective tax rates.

Scenario 1 – Low-income family

A Manitoba family has two kids under five and two working parents, each earning $15,000 of employment income. They are eligible for the entire CCB of $12,800; after paying CPP, EI, and a bit of tax, they net $39,560 of cash.

What would happen if one parent was able to work more, or was to get a higher paying job, such that she now made $25,000 — an increase of $10,000?  While she’s still in the lowest federal and Manitoba tax brackets, once you factor in the loss of CCB, the additional tax, CPP, and EI, her take-home extra cash is only $5,563, resulting in an effective marginal tax rate of a whopping 44 per cent (39 per cent if you ignore the additional CPP and EI contributions.)

As Goodis observed: “The CCB skews the progressive tax system and imposes a high effective tax on low income earners with children.”

Scenario 2 – Median-income family

A British Columbia couple has two children under the age of five. Their family’s income, consisting solely of employment income, is $76,000 split equally between each spouse. Their $12,800 of CCB is reduced to $7,448; and after federal and provincial taxes, CPP, and EI, the family nets $69,135 of cash. In other words, even with the clawback of some of their CCB, the couple has kept 91 per cent of their earned income.

Scenario 3 – High-income earner

Finally, consider an Ontario professional with three kids, two under five and one teen, earning $200,000 annually.  His CCB will be about $750 for the year.  If he were to earn an extra $1,000 of income, he would keep only just under $400 of it, resulting in an effective marginal tax rate of just over 60 per cent once the loss of the CCB is taken into account. (His status is not stated, assume he is a single parent?)

child-benefit-math-3-scenarios

ANALYSIS

With a fuller analysis of the information the following assumptions can be made:

  1. Minimum wage-most minimum wages in provinces range between $10 and $11 per hour, so it is hard to imagine that family in scenario 1 (low-income family) only makes combined income of $30,000.  At 2,000 annual hours of work per year per person, each person’s hourly rate only equals $7.50.  One must assume they are working part time jobs and are unable to find full time work.  Net income after deductions and with CCB of $39,560 still equals net hourly wage of only about $10 per person.   (The other possibility is that this family is wealthy by having huge net worth and assets that are not considered in the CCB and, therefore, do not need to work at full time jobs). For scenario 2 (medium-income family) the net wage after deductions and with CCB earned per hour equals about $17 per person.  For scenario 3 (high-income earner) and assumed 50% tax plus $750 CCB on $200,000 the net wage earned per hour equals about $50 per person.
  2. Income tax reductions-in scenario 1 (low-income family) get none of the 1.5% Liberal tax reduction because each of their incomes do not fall in the $44,401 and $89,401 range.  The same applies to scenario 2 (medium-income family).  Scenario 3 (high-income earner) gets the 1.5% tax deduction for income between $44,401 and $89,401.  Only upper middle-class families with individual spouse’s income over $44,401 to $89,401 would quality for income tax reductions in these scenarios.
  3. Canada Pension Plan (CPP)-both scenario 1 and 2 families will not receive maximum CPP retirement benefits because their individual incomes fall below the 2016 YMPE $54,900 individual income level.  In scenario 3 (high-income earner), he will earn full CPP benefits.  (Fact:  Canada Child benefit tax-free income will not require CPP contributions, so income excluding CCB was used for calculation of CPP retirement benefits.
  4. Canada Child Benefit (CCB)-For scenario 1 (low-income family) this family receives full Canada Child Benefits.  For scenario 2 (medium-income family) reduction is $4,275 and 5.7% for $76,000 income for total $5,352 CCB reduction. Reduction for scenario 3 (high-income earner) is $18,200 minus $6,650 and 8% for $200,000 income which equals total $17,450 CCB reduction.
  5. Understanding other calculations-For scenario 1 (low-income family) it is stated that an additional $10,000 in income would ‘produce take-home extra cash of only $5,563, resulting in an effective marginal tax rate (tax rate paid on last dollar of income and rate likely to be paid on next dollar of income-it is usually more than what is actually paid because basic exemptions, etc. have not been taken into consideration) of a whopping 44 per cent’. (Fifteen percent federal income tax on $10,000 equals $1,500, about 12% Manitoba provincial tax equals $1,200 and 13.5% Canada Child Benefit reduction on $10,000 equals $1,350 for a total of $4,050 not including additional CPP and EI payments).In scenario 3 (high-income earner, ?single parent) it is stated that with only an additional $1,000 income he would keep just under $400 of it, resulting in an effective marginal tax rate of just over 60 per cent once the loss of the CCB is taken into account.  When one takes into account that he is possibly taking home over $8,000 per month, it is likely that he will be able to max out his RRSP and TFSA accounts and will have maximum CPP benefits on retirement at age 65 if he works 40 years as well as RRSP and TFSA accounts to supplement his retirement income).
  6. Under-reporting of actual benefits received-Marginal tax rate-Since Canada operates on tax brackets, taxpayer will pay more tax when more is earned. However, it’s worth noting that tax rate paid is based on the income in each bracket. So the marginal tax rate doesn’t reflect the total that is paid on income. In fact, what taxpayer actually ends up paying, in terms of a percentage of income, is probably going to be lower than the marginal tax rate.  It should be noted that further possible provincial child assistance and family employment, GST rebate benefits and basic exemptions are not included in these examples.  Therefore, each scenario likely has more benefits than have been described in the examples.

CONCLUSION

As stated above by the financial analyst, statement is repeated here again:   “The CCB skews the progressive tax system and imposes a high effective (marginal used in these examples) tax on low income earners with children.”  Unfortunately, they create financial silos by including only one benefit without taking into consideration of the effect of other benefits.  In this post, attempt was made to include Liberal income tax deductions and possible retirement benefits to provide a better ‘across the board’ analysis of how upper-middle class families and wealthy benefit most.

While many families may view the CCB to be a wonderful program, boutique tax credits when taken into consideration with other programs can be shown to be less financially beneficial to low income and middle income families, especially with a stagnant minimum wage.  A stagnant minimum wage (minimum-wage) with a Canada Child Benefit may provide a better income for low income families for twenty or twenty five years during child-rearing, but will result in lower Canada Pension Plan benefits for seniors during their twenty years as seniors.  A higher minimum wage during child-rearing years will result in a higher income during child-rearing years, lower CCB along with higher CPP during senior years.  It is in the eye of the beholder and financial analysts to determine which is the better scenario.  A higher minimum wage appears to be the better scenario.

Another negative thing that can be said about the Canada Child Benefit program is that reductions of the benefit appear to decrease slightly with the addition of each child (resulting in a little more CCB being paid out with addition of each child).  This progression in CCB reductions appear to not follow equivalence scales (finances) where it is shown that cost of living per family does not increase times each additional child, but rather decreases per addition of each child.  (Example: cost of living square root equivalence scale one adult 1.0, two adults 1.4, two adults one child 1.7, two adults two children 2.0, two adults three children 2.2).  In scenario 2 (medium-income family) CCB benefit would be $3,598 for 1 child under 5, $7,448 for 2 children under five and $11,670 for three children under 5.  So, in fact scenario 2 family with three children would receive $292 more per child than family with one child even though equivalence scales show the cost of living per child is less for three children than it is for one child.

As has been stated in past blog posts, both the Liberal and Conservative parties, while handing out marital manna benefits and family benefits, have at the same time handed out benefits that favor upper-middle class families and wealthy the most. (Singles get none of these family credits and are unable to purchase homes and max out RRSP and TFSA accounts unless they have substantial incomes.) Some of these benefits include Liberal income tax reductions, maximum CPP benefits and exclusion of net worth and assets testing while failing to increase the minimum wage to an indexed living wage.  Politicians and governments continue to financially discriminate against singles and the poor while allowing the upper-middle class and wealthy to increase their wealth.

(This blog is of a general nature about financial discrimination of individuals/singles.  It is not intended to provide personal or financial advice.)

OPINION LETTER ON ‘LEFT’S BIG LIE…’ AND FINANCIAL DISCRIMINATION BASED ON MINIMUM WAGE CONTROVERSY

OPINION LETTER ON ‘LEFT’S BIG LIE…’ AND FINANCIAL DISCRIMINATION BASED ON MINIMUM WAGE CONTROVERSY

(These thoughts are purely the blunt, no nonsense personal opinions of the author about financial fairness and discrimination and are not intended to provide personal or financial advice.)

This blog post was submitted as an opinion letter to a local newspaper on October 27, 2016 in response to three opinion letters entered in the paper on left and right wing political parties.  It should be noted that this opinion letter was edited and shortened by the newspaper because there are often only so many words that can be submitted to newspapers. The title of the opinion letter was ‘Notley is a champion.’  The three opinion letters on which this post was based are outlined at the end of this blog post’.  The ‘The left’s big lie…’ does not appear in its entirety.

October 13 and 20, 2016 letters ‘The left’s big lie…’, ‘Only right and wrong’ and ‘Minimum wage increase won’t help anyone’ letters only produce financial misinformation and reduce political process to shoes (Conservative-minded folks are in the right and the wrong party Liberal -socialist species are in the wrong-the left should only refer to shoes).

Re ‘The left’s big lie…’ statements on socialism and left-wing politicians, analysis shows Conservative and Liberal policies surreptitiously and purposefully eliminate the middle class, thus practising ‘selective’ social democracy (democratic).  Advertently or inadvertently, future class system will consist mainly of the poor, upper-middle class and wealthy while favouring married or coupled family units with multiple ‘marital manna benefits’.  Square root equivalence scale (if value of ‘1’ is used for a single person, then a value of ‘1.4’ is applied for two adults since it costs them less to live) and ‘financial fairness for singles’ are ignored (singles-finances).

During federal Conservative and Liberal party reigns, even while reducing social programs helping vulnerable populations of aboriginals and veterans, introduced programs like pension splitting and OAS clawback particularly benefit the wealthy and married or coupled family units.  In OAS clawback only about five percent of seniors receive reduced OAS pensions, and only two percent lose entire amount.  The very program that is supposed to provide a ‘very modest pension to low and middle-income seniors’ has been redesigned to benefit the upper-middle class.

During provincial Conservative party forty year reign and oil boom, just 1,048 new affordable housing units in Calgary were built over the past 14 years.  Two thirds of shelter beds in Canada are filled by people who make relatively infrequent use of shelters and are more likely forced into shelters by economic conditions (due to structural factors, the state of housing and labour markets that destine the very poor to be unable to afford even minimum-quality housing).

Federal Liberals have continued Conservative benefit programs like Canada Child Benefit in perpetuity which is based on income and number of children, but not net worth and assets, so families may receive large tax free child benefits and continue increasing wealth even while already having huge assets (tax-credit).  

Elimination of the middle class is also evident in Liberals’ proposed Canada Pension plan enhancements (canada-pension-plan).  Premise remains the same – individuals with highest YMPE will receive the most CPP, while those at lower income levels will receive the least CPP benefits. Persons with highest YMPE of $82,700 (massive jump from 2016 $54,900) and forty years of contributions will receive 33 percent CPP benefit or about $2,300 per month, while those making a minimum wage of $15 per hour, $30,000 annual income with forty years of contributions will receive about $800 per month.  A single person earning $15 per hour minimum wage would have to work two and half full time jobs for forty years to equal the $82,700 YMPE.  

Schizophrenic political systems exist where CPP pension enhancements are controlled federally, but minimum wages are controlled provincially.  The continued unwillingness of government and business to promote minimum wage increases to indexed living wages means the poor will remain in poverty even with pension systems that are supposed to improve financial quality of life as seniors.

The words ‘hard-working people’ has been used again to ad nauseum.  The idea that minimum wage only increases having to pay more income tax is ludicrous. Yes, increase in minimum wage may increase income tax deductions by, for example, 20 percent but these recipients will also have 80 percent more income to spend which will be used to increase product and services.  Increasing CPP, but not increasing minimum wage means children in the future who are living in poverty will receive less CPP, while their wealthy CPP parents and family members will receive the bulk of the CPP enhancements.

We are all responsible for not fighting financial greed of plutocracy, big government and corporations like Walmart, tax loopholes, Wallstreet, outrageous salaries and prices in the entertainment, sports industries, housing and gentrification of cities.  This has resulted in small businesses not flourishing and poverty increasing to an unprecedented level. Failure to increase the minimum wage instead of dealing with real underlying problems equals fighting the wrong fight.

More champions for the vulnerable like Rachel Notley and Bernie Sanders are needed. Bring it  on!  (End of opinion letter)

The three opinion letters that this blog post refers to are included as follows:

‘The Left’s Big Lie…’ October 13, 2016 local newspaper

The totality of this article talks about climate change and ‘The radical environmental movement as well as left-wing Canadian political parties, most notably the Alberta NDP, are telling the BIG LIE about our energy industry and the global environment.’…..To explain, it goes back to the goal of socialism, which is to “restrict private enterprise and control the economy”…..If we continue down the path dictated by our left wing politicians, the standard of living in Alberta will continue to decline…..Albertans must come together and take back government from these politicians who put their radical ideology ahead of the interests of all the hard-working people in our great province.’

‘Only right and wrong’ October 20, 2016 local newspaper

‘Great letter (The left’s big lie).  However we have to get this right and left idea straight.  The only thing in my home that is left is my shoe.  In politics, it should be referred to as follows:  Conservative-minded folks are on the right.  Liberal-socialist species are on the wrong.  Wrong being the proper opposite of right unless you are describing an object such as my shoe.’

‘Minimum wage increase won’t help anyone’ Oct 20, 2016 local newspaper

‘I do believe all people should make a living wage, but driving up the minimum wage does not have that effect.  If you look at the numbers according to the Government of Alberta website there are 290,000 people in Alberta that make minimum wage.  If they all get $1/hr. raise at approximately 40 hours per week the economy needs to breakout an additional $638 million, with no real increase in product or service.  The cost of all things go up and still we have no living wage, but those on minimum wage now pay more income tax.  So, now the NDP has made political points as well as more tax revenue, while some have lost hours or jobs.  All fixed income people, like vets and seniors, are hit most because they get no raise in pay.’ (End of post)

(This blog is of a general nature about financial discrimination of individuals/singles.  It is not intended to provide personal or financial advice.)

OAS CLAWBACK OUTRAGEOUSLY BENEFICIAL TO UPPER MIDDLE-CLASS MARRIED OR COUPLED SENIORS, BUT FINANCIALLY DISCRIMINATORY TO SINGLES AND POOR – ADDENDUM

OAS CLAWBACK OUTRAGEOUSLY BENEFICIAL TO UPPER MIDDLE-CLASS MARRIED OR COUPLED SENIORS, BUT FINANCIALLY DISCRIMINATORY TO SINGLES AND POOR – ADDENDUM

(These thoughts are purely the blunt, no nonsense personal opinions of the author about financial fairness and discrimination and are not intended to provide personal or financial advice.)

One of our past blog posts (oason subject of the OAS Clawback (proper name is OAS Recovery tax as per Canada Revenue Agency) and the financial discriminatory properties behind the program was discussed.

This blog post further emphasizes the financial atrocities and discrimination that senior singles face with the OAS Recovery program.  The Old Age Security (OAS) is a federal social program designed to provide a very modest pension to low- and middle-income retirees.  It is part of the Universal government benefits for seniors (pillar 1) to ensure income security for senior Canadians (so stated in government and Canada Revenue Agency information sites).

As previously shown the clawback of OAS benefits in 2016 starts with a net income per person of $72,809 (couple $145,618)  and completely eliminates OAS with income of $118,055 (couple $236,110).  The repayment calculation is based on the difference between personal income and the threshold amount for the year. The  repayment of OAS is 15 percent of that amount.  All OAS is clawed back if personal income is over $118,055 per person.   In 2016 the OAS benefit is $6,680 for single person and $13,760 for a couple.

One should note that OAS recovery for a couple begins with each spouse earning maximum net income of $72,809 each (total $145,618) the OAS is only partially recovered for a couple with net income over $145,618 and a single over $72,809  The couple, therefore, continues to get to keep a portion of the OAS benefit for each person with the full financial benefits of additional up to $72,809 ($145,618 minus $72,809) net income than for a single person.

The complete clawback of the OAS benefit only occurs at $236,110 for a married or coupled family unit, but for a single person it is $118,055.  The couple, therefore, only has complete clawback of the OAS benefit with the full financial benefits of additional up to $118,055 ($236,110 minus $118,055) net income than for a single person.

Another point is that partial OAS recovery only begins at $145,618 for a married or coupled family unit while complete recovery (elimination of OAS) has already occurred for a single at $118,055.  In other words, married or coupled family units have been given the financial privilege of up to an additional net income of $27,563 to manipulate at their will ($145,618 minus $118,055); this has already been completed eliminated for a single senior.

CONCLUSION

If one carefully looks at the above, can a conclusion of double-dipping (triple-dipping, etc.) of finances for married or coupled family units be reached? (reasons) In majority of cases, upper-middle class married or coupled family units get to keep partial OAS benefits plus have benefits of additional net income plus pension splitting plus double TFSA limits, etc. The double-dipping, triple-dipping, etc. is even more pronounced as it has been clearly shown that it costs more for single persons to live than married or coupled family units.

The irony of the statement  ‘OAS program is designed to provide a very modest pension to low- and middle-income retirees’ at the beginning of this post should not be lost to the reader.  The very program that is supposed to provide a ‘very modest pension to low and middle-income seniors’ has been designed to ‘line the financial pockets’ of upper-middle class married and coupled family units who have more than a modest pension.

This once again shows how politicians and the government surreptitiously and purposefully implement benefit programs that increase the wealth of upper-middle class married or coupled seniors over single person seniors.  Politicians and governments are surreptitiously and purposefully creating a middle-class system where the upper-middle class are replacing the middle class.  What is advertently or inadvertenly being created is a class system comprised mainly of the poor, upper-middle class and the wealthy and favouring married or coupled family units.

(This blog is of a general nature about financial discrimination of individuals/singles.  It is not intended to provide personal or financial advice.)

WHO IS THE MIDDLE CLASS? AND FINANCIAL DISCRIMINATION OF SINGLES AND THE POOR

WHO IS THE MIDDLE CLASS? AND FINANCIAL DISCRIMINATION OF SINGLES AND THE POOR

(These thoughts are purely the blunt, no nonsense personal opinions of the author about financial fairness and discrimination and are not intended to provide personal or financial advice.)

There has been much discussion in the last few years about who the middle class is and whether the middle class is disappearing.

Certainly, if one looks back technology has improved the quality of life.  Some of us older folks, but not that old, remember housework like laundry that included heating water on the stove, wringer washers and drying clothes on the line.

Other changes over the decades include the following:

  • Families have become smaller so income goes further (due to socio-economic pressures)
  • Day care and  college/university education have become very expensive, but health care and grade 1-12 education are covered under government programs
  • Certain occupations face high operating costs (farm machinery and price of farmland)
  • Social issues and cyberspace has made child rearing more complex
  • Knowledge’ and automation revolutions have replaced certain higher wage jobs with low wage jobs (service)

The definition of the stereotypical ‘American Dream Family: ’they own their own home, have more than one car, can afford to send their children to college, have access to healthcare and benefits, and have spare time to vacation or simply have free time in general.

INCOMES AND NET WORTH OF THE CANADIAN MIDDLE CLASS

In Canada it would appear that the middle class primarily includes those earning between $40,000 and $80,000.  However, when the Canadian population is divided into unattached family units and family units of two or more persons, the income levels are quite different. According to Statistics Canada 2013 (statcan.gc.ca/daily) the median after tax income for unattached persons over 65 is $25,700, for unattached persons under 65 $29,800, and female lone parent families $39,400.  For two parent families with children the median after tax income is $85,000 and senior families $52,500.  (After-tax income is defined as the total of market income and government transfers, less income tax).

The median net worth according to Statistics Canada 2012 (statcan) is as follows: Unattached person under 65 $22,700, unattached person over 65 $246,000, senior families $650,000, non-senior families couples only $365,200, non-senior families with children under 18 $302,100, lone parent families $37,000 and other non-senior families $423,000.

The following information from MoneySense shows Stats. Can. 2011 income and net worth data divided into quintiles:

INCOME TABLE (MoneySense based on Stats. Can. 2011 macleans)

INCOME (PRE-TAX) – HOW DOES YOUR PAY STACK UP

Quintiles Unattached Individuals Families of Two or More
Bottom 20 % $0 to $18,717 $0 to $38,754
Lower-Middle 20% $18,718 to $23,356 $38,755 to $61,928
Middle 20% $23,357 to $36,859 $61,929 to $88,074
Upper-Middle 20% $36,860 to $55,498 $88,075 to $125,009
Highest 20% $55,499 and up $125,010 and up

NET WORTH TABLE

Quintiles Unattached Individuals Families of Two or More
Bottom 20 % Negative to $2,468 Negative to $67,970
Lower-Middle 20% $2,469 to $19,264 $67,971 to $263,656
Middle 20% $19,265 to $128,087 $263,657 to $589,686
Upper-Middle 20% $128,088 to $455,876 $589,687 to $1,139,488
Highest 20% $455,877 and over $1,139,489 and up

(Caveat:  It is difficult to determine if unattached individuals includes widowers who often have more net worth than ever singles, early in life divorced persons and single parents).

DEFINING MIDDLE CLASS IN CANADA

Defining middle class in Canada by Sanita Fejzic (middle-class) article gives an interesting perspective on the middle class.

‘There are two ways of looking at the middle class. The first is to focus all the attention on the baby boomers and define middle class based on their experience. While this is problematic, it also makes sense for two reasons: (1) baby boomers make up a large portion of Canada’s total population, so, in terms of simple number crunching, their experience results in a national average and (2) because baby boomers are the majority, their votes become valuable and therefore most of the political rhetoric on middle class inevitably revolves around their experience. The hiccup with this scenario is that middle class baby boomers are relatively financially wealthy.

The second way of seeing middle class acknowledges the situation from an intergenerational point of view.

“Data suggests it’s really important to be careful about using the language of the middle class squeeze,” adds Paul Kershaw, Interim Associate Director, Human Early Learning Partnership at the University of British Columbia and Founder of Generation Squeeze Campaign. “While this language is popular among some political parties, it hides the reality that the squeeze is much more of an age issue.”

As Kershaw points out, high housing prices explain why the median 55-64 year old today reports wealth that has nearly tripled compared to the same age group a generation ago. “That’s not a middle class squeeze,” says Kershaw. “That’s the middle of a demographic nearing retirement with more wealth than the country has ever seen.”

High home prices that were good for people who bought homes decades ago are crushing their kids and grandchildren’s dreams of home ownership. “Gens X and Y pay housing prices that have nearly doubled after adjusting for the CPI, with wages that are down $3/hour, even though they are more than twice as likely to have post secondary [education] today compared to the past, and take jobs that are far less likely to pay generous pensions,” he explains. “In sum, the squeeze is primarily on younger generations.”

Political focus is on the baby boomer middle class.

As 93% of Canadians (see link) self-identify as middle class, all three political parties have high stakes when it comes to winning the hearts of middle class voters.

The middle class is the political battleground,” states  Leslie Pal, Professor of Public Policy and Administration and Director of the Centre on Governance and Public Management at the University of Carleton. “And it’s not about which parties benefit the middle class but how they are appealing to an older, greying middle class.”

In other words, the three parties are either completely ignoring the generational aspect of the problem or simply don’t understand it. Instead, their energy is going into securing the votes of middle class baby boomers.

According to Pal, there are two broad directions the three parties have taken to appeal to the baby boomer middle class. “One is what I call the jelly bean policy and the other is policy that tackles major problems,” he says.

In jelly bean policy, small offerings are made to baby boomer middle class voters because they’re already living relatively comfortably and have no sense of urgency.

Here we see the Conservatives’ tax breaks on sports equipment, bus passes and policy that unbundles cable packages and the NDP’s messages regarding high ATM fees. “They’re tiny policies,” says Pal. “Like giving jelly beans, it’s sweet and tasty, but it doesn’t fix the problem.”

The other direction solves larger problems, with a focus on reforming the pension system. Much has been done to this regard and there is much to do.

“The use of the term middle class [in the political arena] is rhetorical to some extent,” says Pal. “The Tories have crafted a package whose appeal is sharper [to the baby boomers.]” They’re tough on crime, focused on tax breaks and have strict immigration policy.

The Liberals’ middle class rhetoric is lighter on policing and immigration and focuses on minorities, making ends meet and affordable education, while the NDP is focusing on household debt and lowering credit card fees. The NDP has created a number of social support systems that have safeguarded the middle class, including Medicare. However, their focus has traditionally been about protecting main-street workers and minorities.

But none of the three parties are drafting policy that addresses the threat of a disappearing middle class in the future. As they get ready for the 2015 election — and with the help of sophisticated technology to micro-target various demographic groups — they’ll have to remember to tailor real policies aimed at the group that’s potentially got the most to lose, generation squeeze’. (End)

THE DISAPPEARING MIDDLE CLASS AND HOUSING

(disappearing-middle-class) An Excerpt from Joel Kotkin’s Forthcoming book The New Class Conflict

‘…..This process has been greeted with enthusiasm by financial hegemons, who have stepped in with billions to buy foreclosed homes and then rent them; in some states this has accounted for upwards of twenty percent of all new house purchases. Having undermined the housing market with their “innovations,” notably backing subprime and zero down loans, they now look to profit from the middle orders’ decline by getting them to pay the investment classes’ mortgages through rents.

Part of this shift has been exacerbated by the movement of large investment groups like Blackstone to buy up single family houses for rent, representing a kind of neo-feudalist landscape, where landlords replace owner occupiers, perhaps for the long-run.

The very idea of homeownership is widely ridiculed in the media as a bad investment and many journalists, both left and right, deride the investment in homes as misplaced, and suggest people invest their resources on Wall Street, which, of course, would be of great benefit to the plutocracy. One New York Times writer even suggested that people should buy housing like food, largely ignoring the societal benefits associated with homeownership on children and the stability of communities.  Traditional American notion of independence, permanency and identity with neighborhood are given short shrift in this approach.

This odd alliance between the Clerisy and Wall Street works directly against the interest of the middle and aspiring working class. After all, the house is the primary asset of the middle orders, who have far less in terms of stocks and other financial assets than the highly affluent. Having deemed high-density housing and renting superior, the confluence of Clerical ideals and Wall Street money has the effect on creating an ever greater, and perhaps long-lasting, gap between the investor class and the yeomanry’.  (End)

INCREASE OF SQUARE FOOTAGE IN HOUSING SINCE THE 40’S AND 50’S

“Why Canada’s houses are getting smaller”, Tristin Hopper, National Post, July 13, 2012 (shrinking-home)

‘From post-war bungalows to 1990s McMansions, the Canadian House has spent the last 60 years progressively ballooning into one of the largest domiciles in history….In 1947, to accommodate a wave of post-war home construction, houses were often no bigger than 1,000 square feet.  Then came powder rooms, family rooms, enclosed garages; by 1975 home sizes had jumped to 1,075 square feet.  But still, their children, the Baby Boomers, shared bedrooms and cope with the weekday morning ritual of waiting for a spot in the home’s only bathroom.

Crazed for elbow room, when the Boomers finally seized the reins of home ownership in the 1980s, all hell broke loose.  Wide hallways, gargantuan entrance halls, mud rooms.  By the turn of the millennium, Canadians lived in some of the world’s largest houses – and were filling them with some of the world’s smallest families….

But then, by 2007, the meteoric growth of Canadian houses began to a slow to a trickle…the average new home size had dropped to 1,900 square feet – well down from a mid-2000s peak of 2,300 square feet….over the years, lot sizes stayed pretty much the same, but builders added storeys, dug out basements and pushed the front steps to the sidewalk….Canada, too, is witnessing the slow death of walk-in closets, hobby rooms and even the once-ubiquitous living room…..

The Millennials, the generation born from 1983 onwards, enjoyed a childhood free of bunk beds or even shared bathrooms.  Growing up in plush mega homes undoubtedly helped them become, in the words of one author, ‘self-centered, needy, and entitled with unrealistic work expectations.  Oddly, it also spawned a group of people patently unimpressed with backyards and breakfast nooks….

Under current economic forecasts, Millennials are poised to spend their early adulthood decidedly less affluent than their parents.  They are also facing a housing market that has outpaced income growth for well over a decade….

Except, of course, in Alberta, in the land of $85,000 median wages and dirt-cheap housing lots, young families are still snapping up giant, single-family homes like it’s still 1985….Edmonton has more space per person than any major city in Canada….In Calgary, even the condos are 4,000 square foot ‘monsters’.’ (End)

WHAT DETERMINES HOW THE MIDDLE CLASS IS CREATED

Michael Lind, “Are We Still a Middle-Class Nation?” The Atlantic Monthly 293, no. 1 (January/February 2004) (issues).

Michael Lind goes so far as to claim “each of America’s successive middle classes has been artificially created by government-sponsored social engineering—a fact that is profoundly important for us to admit as we think about the future of middle-class America.” (End)

Andrew Coyne: “Forget the Liberal mythology, Canada’s middle class is not struggling” (middle)

This has always been implicit in Liberal rhetoric about “the one per cent,” but now it is policy. If the rich have been “taking” from the middle class, then the Liberals want you to know they will take it back: a cut of one-and-a-half percentage points in the lower-middle bracket, paid for by an increase of four percentage points in the top rate of tax. Fairness demands nothing less.

Seldom have the politics of “gimme that” been expressed quite so nakedly. It is one thing to redistribute from rich to poor, or from the broader society to those on its margins. But the beneficiaries in this case are not the poor, or even the median: as the NDP helpfully pointed out, the $44,701 threshold at which the Liberal tax cut would kick in would benefit only the top one-third of tax filers.” (End)

CONCLUSION

Wants have changed, it seems new homeowners all want hardwood floors and granite countertops and will pursue those dreams and accumulate high debt even with out of reach house prices.

Many wealthy Canadians (mainly married or coupled person family units)  think they are only middle class, but own their homes outright, have multiple properties, recreation vehicles, winter in Arizona or Florida, and have huge net worth and assets. Many also have multiple income sources from their net worth and assets in their senior years.  Many will buy properties with their increased wealth to rent out to those at the bottom of the wealth pile.  The rent charged is set at levels of greed to not only cover the mortgage and other costs, but also make 3 or 4% profit on their investments (affordable)

As stated above, 93% of Canadians believe they are in the middle class.  Yet MoneySense statistics presented above shows that 40% of Canadian families of two or more persons have incomes above $88,000 and have net worth and assets above $600,000.  THIS LAST STATEMENT BEARS REPEATING AGAIN.  Forty per cent of Canadian families have incredible wealth and yet think it is okay to lie to themselves and other Canadian singles and poor families about their wealth. They continue to spin these lies and this spin is perpetuated by government and politicians.

As has been shown in past blog posts, government and politicians have created upside side down and schizophrenic financial policies that benefit upper middle class families more than ‘middle of the road’ middle class families, singles and the poor (government-program).  Baby boomers and families because of their voting power are considered to be more financially important than other generational persons such as millennials.

What’s the point of hard work and common decency if the financial system is stacked against singles and the poor?  The values that have actually enriched the wealthy and upper middle class appear to be greed, over consumption, arrogance, dishonesty and telling lies upon lies upon lies about their wealth (especially with regards to affordable housing) .

‘Hard working’ phrase is used ad nauseum, but many middle class families  think they should not have to work til age 65 due to a sense of entitlement.

Even with having one of the highest standards of living in the world,  middle class Canadian families are still unhappy and want more and appear to have no qualms about financially discriminating against the lower middle class, singles and the poor.

(This blog is of a general nature about financial discrimination of individuals/singles.  It is not intended to provide personal or financial advice.)

STAGNANT MINIMUM WAGE AND LOW INCOME IMPACT ON CPP ENHANCEMENTS

STAGNANT MINIMUM WAGE AND LOW INCOME IMPACT ON CPP ENHANCEMENTS

(These thoughts are purely the blunt, no nonsense personal opinions of the author about financial fairness and discrimination and are not intended to provide personal or financial advice.)

Occasionally there are events or things in life that will ‘rock you to your core’, ‘knock your socks off’, or ‘set you back on your heels’.  On writing for this blog, one of these things or events is the minimum wage or low income and what an impact this has on financial lives of the poor and low income regards to proposed CPP enhancements.

From Department of Finance, “Background on Agreement in Principle on Canada Pension Plan Enhancement” (fin.gc) for proposed enhancement of CPP states the following:

‘Today, middle class Canadians are working harder than ever, but many are worried that they won’t have put away enough for their retirement.  Each year, fewer and fewer Canadians have workplace pensions to fall back on.  To address this, we made a commitment to Canadians to strengthen the Canada Pension Plan (CPP) in order to help them to achieve their goal of a strong, secure and stable retirement……

There will be gradual 7-year phase-in below the Yearly Maximum Pensionable Earnings (YMPE), followed by a 2-year phase-in of the upper earnings limit….

The maximum amount of earnings subject to CPP (from 2023 to 2025) will be increased by 14%.  The upper earnings limit will be targeted at $82,700 upon full implementation in 2025…..

In 2023, the CPP contribution rate is estimated to be 1% higher for both employers and employees on earnings up to the YMPE.  Beginning in 2024, a separate contribution rate (expected to be 4% each for employers and employees) will be implemented for earnings above the then prevailing YMPE.

All working Canadians will benefit from an enhancement of the CPP. This enhancement will increase income replacement from one-quarter (25%)  to one-third (33%) of pensionable earnings.

As the CPP enhancement will be fully funded, each year of contributing to the enhanced CPP will allow workers to accrue partial additional benefits. In general, full enhanced CPP benefits will be available after about 40 years of making contributions. Partial benefits will be available sooner and will be based on years of contributions.’

The following information regarding the middle class has been taken from (theglobeandmail):

A 2013 internal government document, entitled “What We Know about the Middle Class in Canada,” draws the lines more precisely, deeming the middle class as those whose after-tax income falls between 75 per cent and 150 per cent of the national median – which, using 2012 figures, would include any family taking home $54,150 to $108,300 a year.  “Family,” however, is a catch-all demographic that includes couples of all ages, with or without children, single or double-earners, and single parents. Single people are excluded entirely – one of the fastest growing groups in Canada and a big chunk of the middle class – whose income, using the same government calculation above, would fall between $21,150 and $42,300…..This is one reason why so many millionaires (44 per cent of those who responded to a recent survey by CNBC) outrageously define themselves as middle class when, in fact, once your personal income closes in on $200,000, you leap into the top 1 per cent of earners in Canada….(and top twenty per cent have salaries over $116,000).

Average income (before taxes and transfers) by quintile, all family types, 2013

  • Lowest: Up to $13,000
  • Second: $13,100-$37,000
  • Middle: $37,000-$66,500
  • Fourth: $66,500-$111,600
  • Highest: $111,600 and up

Source, Income Statistics Division, Statistics Canada

What the numbers say: Income levels have fluctuated over the last four decades, with lasting growth concentrated among the wealthiest. In 2011, the incomes of the bottom three quintiles were still lower than in 1976, adjusting for inflation. The top 40 per cent had jumped ahead, with the largest gains made by the top 20 per cent. Compared with 1976, they were the only Canadian households who saw their share of income rise….

What the numbers say: Between 1999 and 2012, the median net worth of Canadian families rose nearly 78 per cent, from $137,200 to $243,800. Most of this wealth is concentrated in housing, especially for lower-income groups. This new wealth wasn’t evenly distributed, however. Gains were higher, the wealthier the family. While median net worth grew by 107 per cent for the richest families, for the bottom 20 per cent it rose just 14.5 per cent. Within the middle class, richer Canadians also did better – the upper middle income saw their worth grow by 90 per cent; the lower middle income by 60 per cent…..

Baby boomers are working longer than expected, debts are rising, and grandma’s housing bonanza is pricing her grandchildren out of the real-estate market, especially in big cities where the best jobs are increasingly concentrated. Paul Kershaw, who studies generational equity at the University of British Columbia’s School of Population and Public Health, has calculated that Canadians in their late 20s and early 30s will have to save, on average, five years longer to produce a down payment, and work one month a year more than their peers in 1976 to cover their mortgage. And according to a June report from the Canadian Centre for Policy Alternatives, thirty-somethings are the only age group with a lower overall net worth in 2012 than they had in 1999…..’

READER COMMENT on above article:

‘This is the reality of Canadians in their twenties and thirties.  They are buffeted on the one hand by a regressive Service Sector (Service Sector-more than fast food outlets- includes banking, insurance, and information technology) senior management style reminiscent of pre industrial revolution feudal management and owners who believe that the 15% federal tax is excessive and should be demolished.  On the other hand these all important Canadians under forty years are hopelessly burdened by the same senior management who are responsible for policy that has created unmanageable long term student debt, unconscionable large mortgages with no long term rate matching to amortization and no defined benefit pension plans….the existing Bank Act and Insurance Act as well as Competition Law provides ample power for an enlightened government to bring fairness to our most important asset – Canadians under forty years old’.

MoneySense (middle-class)data based on Stats.Can. 2011 figures – Middle 20% pre-tax income for unattached individuals is $23,357 to $36,859 and for families of two or more $61,929 to $88,074.

In 2013, Stats.Can. data shows median after-tax income for unattached singles over 65 to be $25,700 and under 65 to be $29,800.  For female lone parent families $39,400, for two parent families with children $85,000 and senior families $52,500.

Living Wage Dollars (politicians) (a basic wage that keeps poor working Canadians off the streets) for 2013 Guelph, Wellington and 2012 Grande Prairie range from $19,284 to $25,380 for unattached singles and $56,796 to $62,844 for two parent, two children family unit.  Living Wage for Guelph/Wellington for 2015 has been set at $16.50 for family unit of two parents and two children. The City of Vancouver employee living wage for 2016 is $20.64.  The calculated living wage for Toronto family unit of four for 2015 is $18.52.

Minimum wage in 2015 (minimum) in provinces looked like this – British Columbia $10.25, Alberta $10.20 ($11.20 in Oct. 2015), Saskatchewan $10.20, Manitoba $10.70, Ontario $11.00, Quebec $10.35, New Brunswick $10.30, Nova Scotia $10.60, Prince Edward Island, $10.35, Newfoundland $10.25, Yukon $10.72, Northwest Territories $10.00, Nunavut $11.00.  For 2016, provincial minimum wage ranges from $10.65 to $13.00.  Very few provinces index minimum wage to inflation.  The Alberta NDP party who came into power in 2014 promises to raise minimum wage to $15 by 2018.

The following table shows CPP contribution and benefit rates from 1987 to 2025.  Future proposed rates are shown in yellow.  It is interesting to note that the maximum CPP pension payout does not equal 25% of the YMPE.  Rather it seems to average around 24%.  Where did the remaining dollars go – perhaps for administrative costs?  Payout for 2025 has been calculated at 32% rather than 33%.

cpp-enhancements

ANALYSIS

  1. Minimum wage or living wage in relation to CPP enhancement – A minimum wage averaging between $10.00 and $11.00 in Canada or approximately $20,000 and $22,000 annual wage for 2,000 worked hours per year means these employees working for forty years will receive virtually nothing in CPP payments in comparison to those employees whose maximum CPP YMPE will be $82,700.  If the estimated amount of CPP after forty years of contribution for $82,700 maximum YMPE will equal about $2,000 per month, then the CPP benefit for $20,000 annual salary could be estimated to be 25% or $500 per month.  Even with a living wage of $20.00 per hour or $40,000 annual salary for 2,000 worked hours will possibly only equal 50% or $1,000 (equivalent to rent or mortgage) CPP benefit per month.  Just what incentive is there for the poor and low income to work when the YMPE will rise to a level that is higher than the middle quintile income of  $37,000-$66,500 and when one of the criteria is working for forty years?  While it is understood that incomes will likely rise over the next forty years, past history has shown that it will repeat itself by not increasing the minimum wage to a living wage equally in proportion to CPP contributions and benefits.  Ever singles and early divorced singles without children deserve better when they  have worked for forty years, never used EI, never used family benefits like maternity or parental benefits, child rearing dropout credits, child benefits and widowed person benefits along with all the marital manna benefits (pension splitting). Question to be answered:  Will the minimum wage along with OAS and GIS rise to same level that CPP YMPE will rise and will they be indexed to same level (33% would be nice) so that CPP, OAS and GIS benefits for the poor and low income will be at least a living wage level throughout their senior lives?
  1.  Upper-middle class will benefit the most while the poor and low income Canadians have been left out of the formula – Politicians and governments continue to coddle the middle class and especially the upper-middle class (so stated by financial government officials themselves in above article “middle class Canadians are working harder than ever”).  The Canadians who will benefit the most from the proposed CPP YMPE are the top two quintiles earning $82,000 and up per year (fourth quintile $66,500-$111,600 average income for all family types as shown in above statistics).  As the CPP YMPE rises at a level that is exponentially higher than the average income level of the middle class, so will the CPP payouts rise at a level that is exponentially higher for the upper middle class.  In the table shown above, the yearly YMPE has risen at a relatively steady rate for each year.  Examples:  The YMPE rose $600 for years 2000 to 2001, $1,200 for 2015 to 2016 and proposed $1,100 for 2022 to 2023.  The YMPE will take a dramatic jump of $7,100 ($67,800 to $74,899) for 2023 to 2024 and $7,800 ($74,900 to $82,700) for 2024 to 2025.  The YMPE, which used to be more ‘middle of the road’ middle class, will now rise to upper middle class levels just like all other defined benefit plans in this country, the higher the salary-the higher the benefit.   (Widowed persons of higher income deceased spouses also benefit more from these plans, but have not made contributions equal to the pension payouts, even though as widowed persons they are now technically single).  It almost certainly can be guaranteed that annual incomes will not increase by that amount for any of the lower income groups and especially for the poor and low income groups.  Pension plans in this country have been made schizophrenic and financially upside-down when they are controlled by the federal government, but minimum wages are controlled by the provinces, while ensuring the wealthy will get wealthier and the poor will remain poor.
  1.  Four things that need to happen to eliminate financial discrimination of CPP enhancements – What is the incentive for ever singles, early divorced singles and poor families to work when government, politicians and businesses purposely implement financial policies that work against them?? Four things need to happen – one. raise minimum wage to a living wage with indexing; two, exponentially increase indexing of OAS and GIS to same level of $82,700 CPP YMPE; three, eliminate marital manna benefits that privilege high income families such as pension splitting and revise programs such as OAS recovery tax so they truly do progressively eliminate OAS according to income for the upper-middle class; and four, review all retirement benefits and retirement programs in totality and with each other (both on federal and provincial level) to prevent creation of financial silos that privilege the wealthy few.

SOLUTION

In addition to the above four items, how about adding six years of CPP benefits to total years worked for singles (ever singles and early divorced singles, excluding widowers), equivalent to child rearing dropout credits? (Added Sept. 26, 2016 but then, singles already work forty years so that idea won’t work.  So how about applying the equivalence scale of 1.4 to the CPP benefits that singles have earned while working)?  It is a known fact that it costs unattached singles more to live (senior-singles-pay-more) than married or coupled family units.  The Canada Revenue Agency knows who singles are as they have indicate themselves as such on their income tax submissions.  Now, wouldn’t that be a novel idea to eliminate financial discrimination and promote financial fairness for singles?

(This blog is of a general nature about financial discrimination of individuals/singles.  It is not intended to provide personal or financial advice.)

CAUSE AND EFFECT OF FINANCIAL POLICIES PROMOTING FINANCIAL DISCRIMINATION OF SINGLES AND THE POOR

CAUSE AND EFFECT OF FINANCIAL POLICIES PROMOTING FINANCIAL DISCRIMINATION OF SINGLES AND THE POOR

(These thoughts are purely the blunt, no nonsense personal opinions of the author about financial fairness and discrimination and are not intended to provide personal or financial advice.)

This blog has attempted to describe some of the many government, politician, business and family financial policy decisions that lead to financial discrimination of singles and the poor.

The question that can be asked is:  “Is there a  cause and effect relationship to these decisions?”

From Wikipedia and other online sources (study) the definition of ‘cause and effect’ is follows: – Causality (also referred to as causation, or cause and effect) is the agency or efficacy that connects one process (the cause) with another process or state (the effect), where the first is understood to be partly responsible for the second, and the second is dependent on the first. In general, a process has many causes, which are said to be causal factors for it, and all lie in its past. An effect can in turn be a cause of many other effects.

A cause-effect relationship is a relationship in which one event (the cause) makes another event happen (the effect). One cause can have several effects. Cause-Effect Criteria – In order to establish a cause-effect relationship, three criteria must be met. The first criterion is that the cause has to occur before the effect. If the causes occurred before the effects, then the first criterion is met.  Second, whenever the cause happens, the effect must also occur.  Consequently, if the cause does not happen, then the effect must not take place. The strength of the cause also determines the strength of the effect when criterion two is met.  The final criterion is that there are no other factors that can explain the relationship between the cause and effect.

A cause is why something happens.  An effect is what happens.

While no scientific ‘cause and effect’ relationship (i.e. fishbone diagrams) has been applied in this blog, certainly many of the financial discriminatory effects of policy decisions (or causes) have been described.  Some of these effects are listed below.

Boutique tax credits

  • Every political party has introduced tax credits to give financial benefits to certain members of the population more than others. June 16/16 (credit)

Business policies

  • Financial decisions by businesses such as not wanting to have minimum wage increase and not wishing to pay proposed increase of CPP employer contributions continue to help disintegrate the financial well being of singles and the poor. Sept. 12/16 (canada-pension-plan)

CPP

  • Financial discrimination of the CPP plan.  Aug 31/16 (plan)

CPP enhancements

  • Financial discrimination of CPP enhancements includes higher income earners only paying 8 percent instead of 11 percent CPP contributions on earnings between $72,000 and $82,700. Sept 12/16 (canada-pension-plan)

Family tax credits

  • Marital manna and family tax credits given over the years have continually increased the financial discrimination of singles and the poor.  Many of these benefits have been implemented by the Federal Conservative government over the last decade and perpetuated by the Federal Liberal party since coming into power in 2015 as well as provincial parties.  Aug 2/16 (credits)

Housing Affordability

  • Just 1,048 new affordable housing units in Calgary have been built over the past 14 years; the need for affordable housing was great in 2002 and it remains so today (most of these years were under provincial forty year reign of the Conservative party). July 17/16 (housing)
  • Homelessness – Two thirds of shelter beds in Canada are filled by people who make relatively infrequent use of shelters and are more likely forced into shelters by economic conditions (due to structural factors, the state of housing and labour markets that destine the very poor to be unable to afford even minimum-quality housing)…attacking housing affordability from the other side, by reducing housing costs, would also be effective….vast majority of homeless shelter users are single. May 23, 2016 (homelessness) and July 17/16 (housing)

Housing Upside Down Pricing and Financing

  • Upside down pricing of housing where purchasers of smaller units pay more per square foot means they will proportionately pay more house taxes, education taxes, mortgage interest and real estate fees on less house and less take home pay. Nov. 19/15 (upside-down)

Income tax privileging for the middle class and the wealthy

  • Tax cuts on both federal and provincial levels have targeted the middle class and the wealthy while making poor pay same amount or more in taxes.
  • Alberta flat tax of 10 percent increased from 8 percent for low income. May 23/16 (homelessness
  • Federal tax by federal Liberal party decreased by 1.5% for those earning between $45,282 and $90,563. Aug. 23/16 (family)

Lost Dollar value

  • Lost dollar value list was created to show lost dollars experienced by singles because married or coupled persons are able to achieve more financial benefits.  Some of these include pension splitting, reward programs and Employment Insurance (EI). April 10/16 (value)

Marital manna benefits

  • 1% spousal lending rate, spousal RRSP, TFSAs times two with no cap on total amounts accumulated over years are all within legal limits of financial laws – Six Reasons….(six)

Marrying for money pays off

  • Study shows persons who marry and stay married accumulate nearly twice as much personal wealth as a person who is single or divorced.  Jan. 17/16 (pays)

Maternity and parental benefits

  • Studies have shown that middle class and wealthy families benefit more from maternity and parental benefits.  Many poor families cannot afford take full maternity and parental leave.  August 23/17 (family)

Minimum wage/living wage

  • Decisions and arguments to not increase minimum wage or implement living wage have a dramatic impact on financial well being of singles and the poor.  May 4/16 (discriminatory) and Sept. 12/16 (canada-pension-plan)

Net worth and assets

  • When net worth and assets are not included in family benefit formulas, benefits are often given to those who need these benefits less (middle class and the wealthy) than the poor who have less net worth and assets.  August 17/16 (assets)

OAS recovery tax (OAS clawback)

  • OAS clawback benefits wealthy couples and some widows the most.  OAS for couples only begins at net income of $145,618 ($72,809 per person) thus allowing them to receive full OAS of $13,760 as a couple.  Not many senior singles (except some widowed persons) who could ever hope to achieve a net income of $72,809. Aug. 29/16 (oas)

Pension splitting

  • Pension splitting benefits only wealthy married or coupled family units.  Singles don’t get to pension split. Jan. 31/16 (government) and May 4/16 (selective).

Reward programs, company perks, money benefit programs, and fee schedules benefit families the most

‘Selective’ social democracy

  • There has been much that is good about democratic socialism, but there also has been some negative outcomes .  One outcome is ‘selective’ democratic socialism where certain members of society receive more social benefits than others. May 4/16 (selective)

Senior singles pay more

  • Senior singles often ‘pay more, get less’ because they are not included equally in financial formulas.  Singles also help support widowed persons and survivor pension plans. Dec. 22/15 (senior) and June 2/16 (retirement)

Singles not included or improperly identified in family definition

  • Ever singles (never married, no kids) are often not properly identified in family definitions.  Widowed persons and single parents are not ever singles.  Widowed persons and single parents are afforded some benefits that ever singles do not receive.  Dec. 2/15 (false) and Aug. 7/16 (definition)

CONCLUSION

It is very clear from the many examples above that government, politician, business and family financial policy decisions are often made in isolation and in financial silo fashion.  Continuation of these practises without a clear path to proper evaluation of all ‘across the board’ financial formulas and their ‘cause and effect’ on each other will only lead to perverse financial privileging of the middle class and wealthy while continuing financial discrimination of ever singles, early in life divorced singles, single parents and the poor.

(This blog is of a general nature about financial discrimination of individuals/singles.  It is not intended to provide personal or financial advice.)