BOUTIQUE TAX CREDITS PUSHING SINGLES INTO POVERTY-Part 1 of 2
These thoughts are purely the blunt, no nonsense personal opinions of the author and are not intended to provide personal or financial advice. (six-reasons-why-married-coupled-persons-are-able-to-achieve-more-financial-power-wealth)
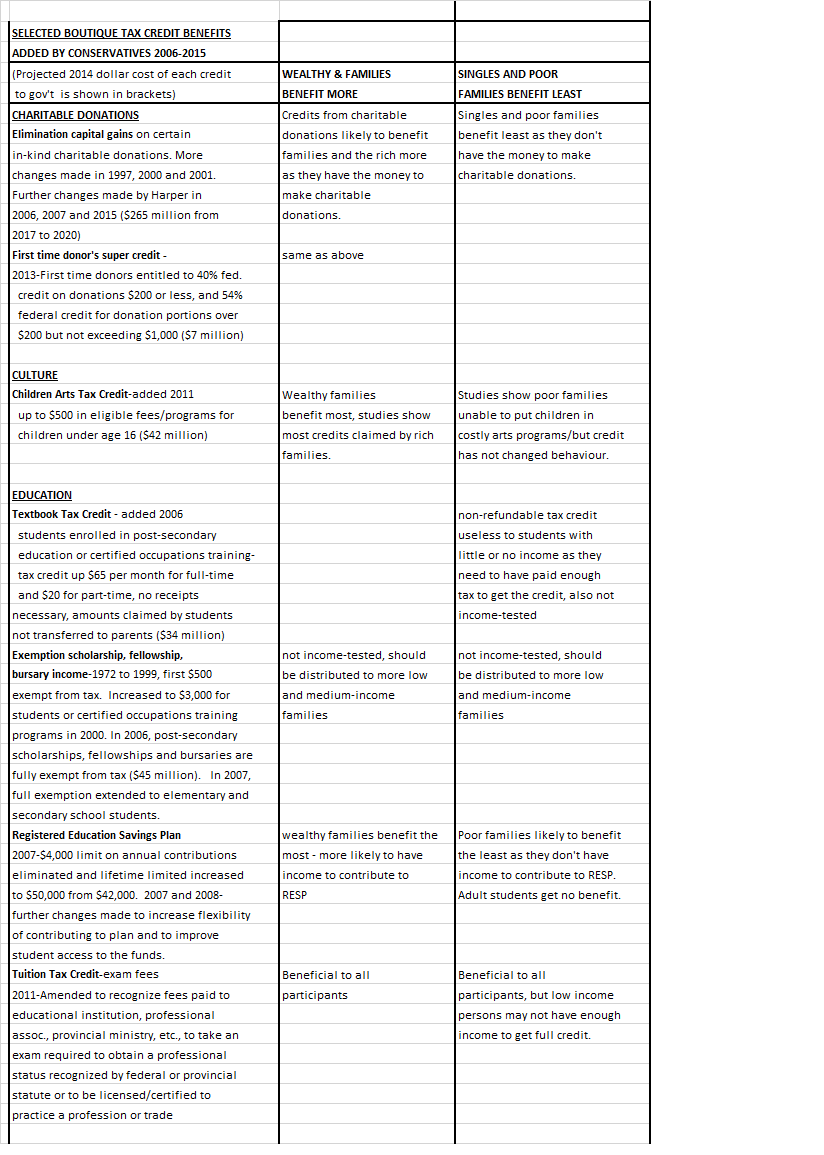
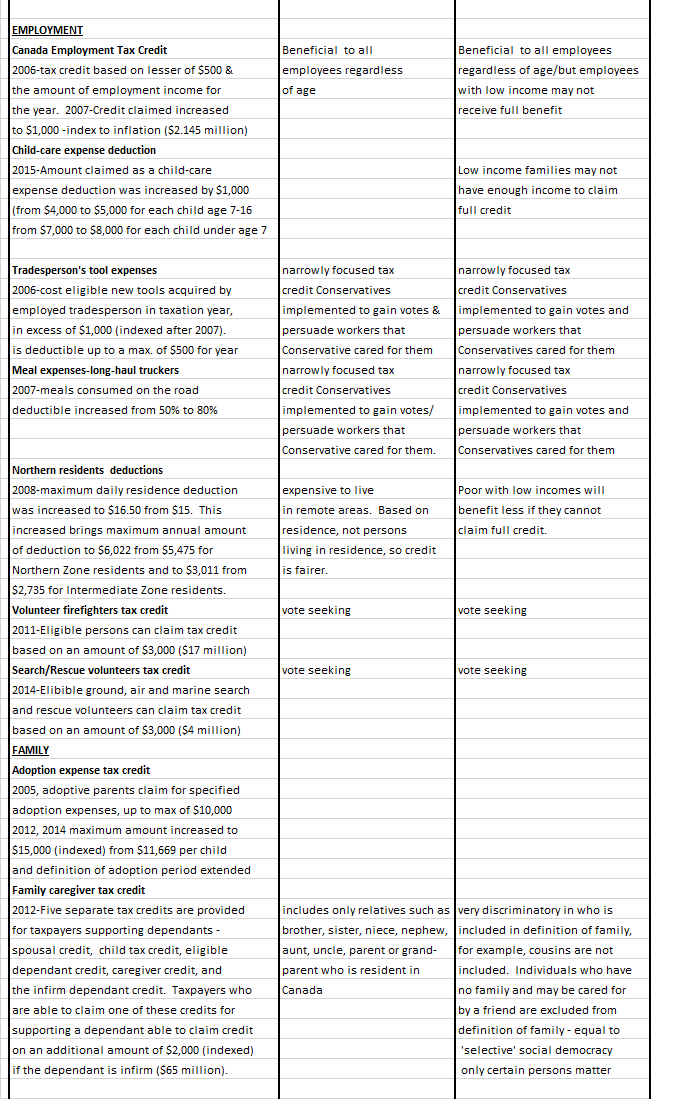
(The last two posts discussed how detrimental boutique tax credits can become to the financial well-being of a country and its citizens. Boutique tax credits once they have been implemented are very hard to repeal because of voter sense of entitlement. These were based on ‘Policy Forum: The Case Against Boutique Tax Credit and Similar Expenditures’ by Neil brooks). This post was updated on July 8, 2014.
This post itemizes a personal finance case showing how certain family units benefit far more from boutique tax credits than other family units like ever singles. One could say this case is totally bizarre in how benefits can be doled out in excess while recipients pay little or no tax). This post was updated on June 24, 2016.
CASE 1 – Financial Post Personal Finance Plan, June 11, 2016 – ‘Farm Plan Risky for Couple with 4 Kids’ (financialpost)
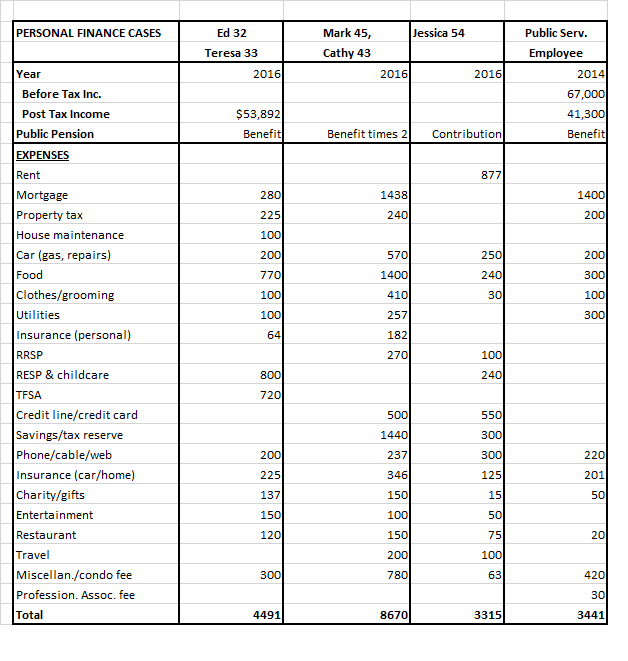
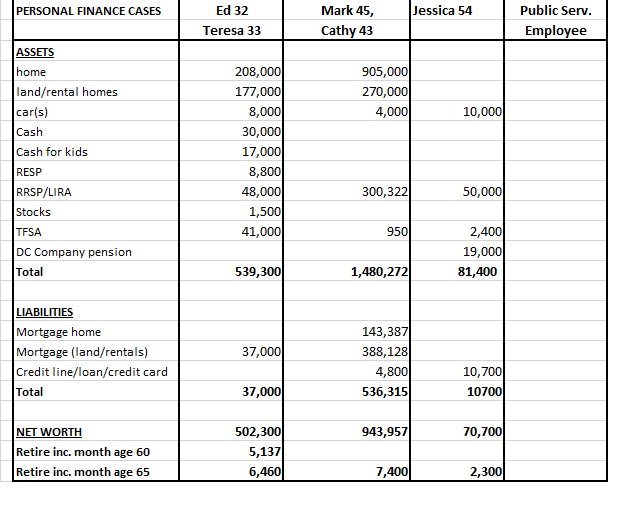
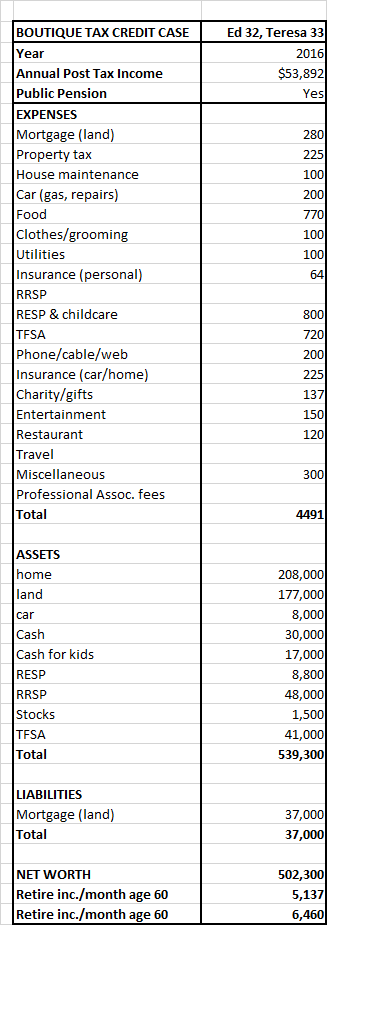
Ed age 32 and Teresa 33 have four children ages 5, 3, 1 and newborn in British Columbia. Ed works for a government agency and Teresa is a homemaker. At age 32 and 33, they already have a net worth of $502,000. Their $208,000 home is not in the Vancouver area and is fully paid for. Their land is valued at 177,000 with $37,000 (21%) owing on the mortgage. They would like to sell their house, move out of town and set up a small farm. Ed would give up his government job and they would get income by selling eggs and produce, hopefully at a profit. Their plan is to retire comfortably and securely with about $4,000 in present-day dollars and after tax. At age 32 and 33, they also already have a net worth of half a million dollars ($502,000).
Ed brings home $2,680 per month. They will receive the new, non-taxable Canada Child Benefit (CCB) (brought in by the ruling Liberal Party to replace the Conservative Universal Child Care Benefit) at $1,811 for their four children, all under the age of 6. This brings their total family disposable income to $4,491 per month. The CCB makes a huge difference by contributing about 40 per cent to take-home income.
(When all four children are ages 6 to 17, the CCB will be $1,478 a month based on 2016 rates).
Financial Planner’s Recommendations – Apply $17,000 cash already reserved for kids to Registered Education Savings Plans (RESP), so they can capture the Canada Education Savings Grant (CESG) of the lesser of 20 per cent of contributions or $500 per beneficiary. Using the children’s present ages of 5, 3, 1, and one month, subsequent annual contributions of $2,500 per child plus the $500 CESG (to a maximum of $7,200 per beneficiary) with a three per cent annual growth after inflation would generate a total of about $270,000 or about $67,500 per child for post secondary-education.
Re job, advice is that Ed continue working until the age of 60 and when the youngest child is 18. Advice is also given for purchase of the farm, details of which will not be discussed here. Each spouse would add $5,500 to their TFSAs for each year until Ed is age 60.
Re retirement, if Ed retires at age 60 and Teresa continues as a stay at home spouse, in 2016 dollars he and Teresa would have his $26,208 defined benefit pension and the $7,200 bridge, Registered Retirement Savings Plan (RRSP) payments of $5,727 a year and Tax Free Savings Account (TFSA) payments of $29,360 for a total pre-tax income of $68,495, or $5,137 per month to spend after 10 per cent tax and no tax on TFSA payments. At age 65, Ed would lose the $7,200 bridge but gain $11,176 in annual Canada Pension Plan (CPP), plus Old Age Security (OAS) payments of $6,846 each spouse, for total income of $86,163 with no tax on TFSA payouts and pension and age credits. After tax, they would have $6,460 a month to spend. Both before and after 65, they would have achieved beyond expectations their goal of $4,000 monthly income.
The unknowns of this plan are the cost of farm and whether it will make a profit. The financial planner states:
“As a retirement plan, it is a wonderful goal. As a financial endeavour, it is speculative.”
ANALYSIS
All calculations in 2016 dollars and assumes there is no wage increase for Ed and Teresa will remain stay at home spouse and all federal benefit plans and credits will remain the same.
Child benefit non taxable:
All four children up to and including age 5 – $1,811 per month times 12 months times 5 years (not fully calculated for age) = approximately $108,000
All four children age 6 up to and including 17 – $1,478 per month times 12 months times 13 years = approximately $231,000
Total benefit for eighteen years = approximately $339,000
TFSA contributions in after-tax dollars and tax free and not including interest earned $5,500 times two persons times to sixty years of age (Ed) $11,000 times 28 years = $308,000
RESP contributions $2,500 per child per year times four equals $10,000 per year plus $500 up to maximum $7,200 grant per child will generate with three per cent growth a total of about $270,000 education savings for children.
$7,200 grant per child times four = $28,800.
Retirement – they want to retire at age 60, will pay only 10 per cent tax on $68,495 pre-tax including tax-free TFSA income or $5,137 per month. At 65 they will have total income of $86,143 and with pension splitting will have $6,460 after-tax monthly income (not able to calculate total benefits received).
These calculations do not include other possible GST/HST credits and tax credits offered by the provinces (example: BC Low Income Climate Action Tax Credit even though this family unit of six will use far more resources affecting climate change than a family unit of one person). These calculations also do not include benefits of reduced fees, etc. that families get, but ever singles do not.
If Ed retires at age 60, when his youngest child is age 18, he will never have worked a year where full taxes were paid.
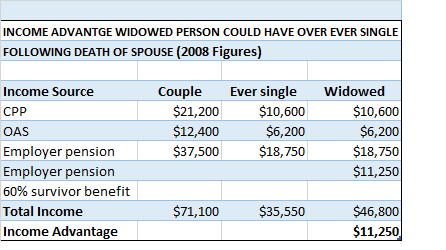
All things being equal, this couple will receive benefit upon benefit from present year to when they retire at age 60 and beyond age 65. If Ed is deceased before Teresa, as a widower Teresa will receive even more benefits as a survivor with survivor pension benefits.
In reality, they likely will receive approximately $1 million dollars in benefits which is essentially the cost of raising their children and their children will have healthy education accounts. The parents will retire with even more income than they had while raising their children, and have accumulated a healthy sum in assets. With assets and value of assets remaining same at age 60 retirement, parents will have $485,000 in farm, $48,000 in RRSPs and $349,000 in TFSAs for total of $882,000. So, they will essentially be close to millionaire status while receiving multiple benefits and paying almost no taxes.
This couple from the time they are married until one spouse is deceased will have received shower, wedding, baby gifts, possible maternity/paternity leaves, child benefits times four children, TFSA benefits times two, reduced taxes, pension splitting, possible survivor pension benefits, and retirement before age 65.
While it is understood that is expensive to raise children, it is bizarre that parents believe they can raise children, retire before age 65 and pay very little in taxes to support the benefits they believe they are entitled to. Why should these families get benefits beyond raising their children like pension splitting when they have huge TFSA tax free accounts including other assets? (Neil Brooks calls the pension splitting tax credit outrageous). The plethora of benefits given to parents with children is what the blog author calls ‘selective’ social democracy or situation where benefits are given to one segment of the population so they can achieve more wealth at the expense other segments of the population such as ever singles and divorced persons without children.
CONCLUSION
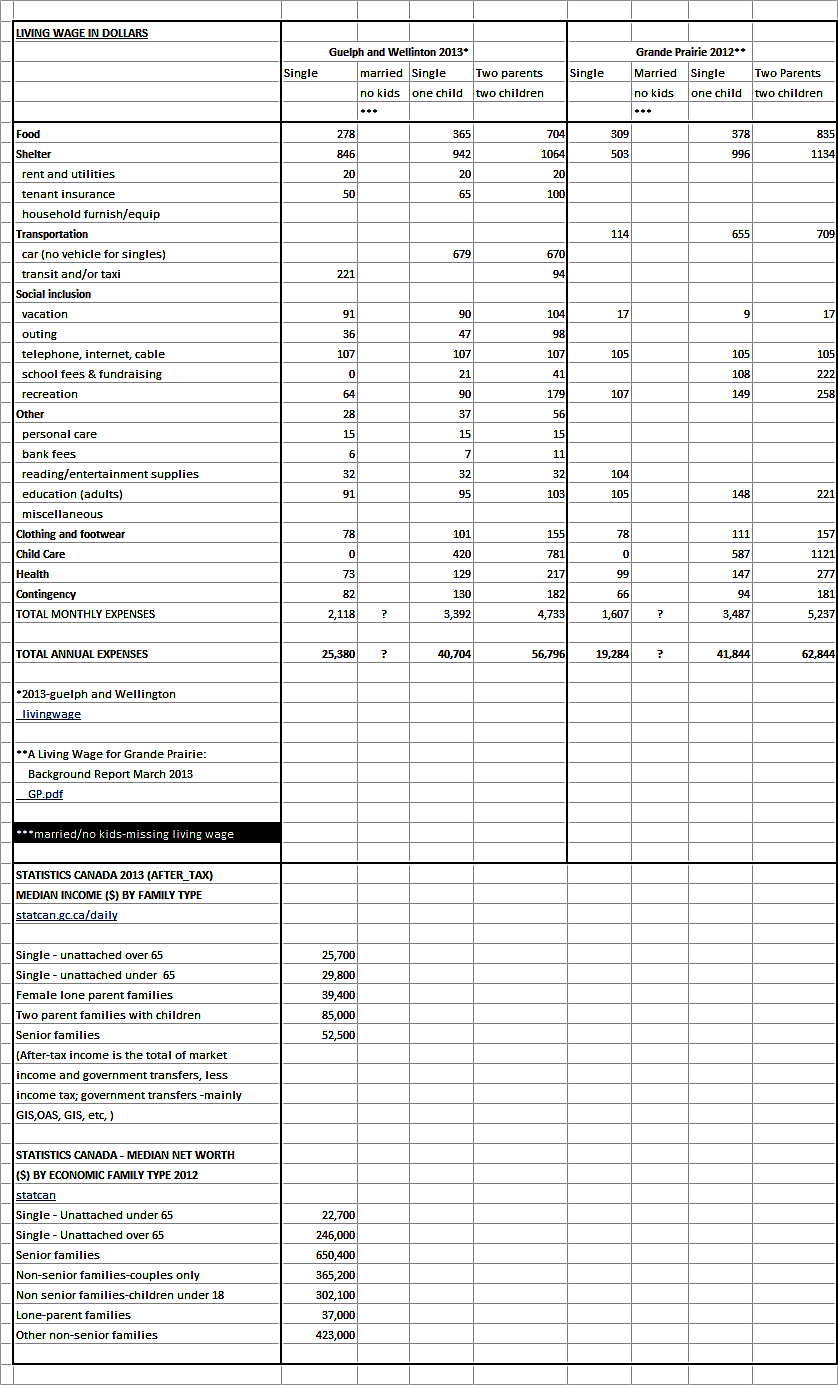
So who is paying for all of this? One group of Canadian citizens subsidizing families as in case above are ever singles (never married, no kids) and divorced persons without children. They will never achieve a monthly income of $4,500 per month unless they are making a very good income. They don’t have the money to max out TFSA amounts like this couple has. The only benefits ever singles and divorced persons without children will ever receive is if they are in an abject state of poverty. They also will never be able to accumulate the retirement and other assets that this couple has. They are never likely able to retire at age 60 unless they have equivalent income to the above couple (at least $60,000 per year). A middle quintile income for unattached singles is $23,357 to $36,859. At $55,499 income an unattached single is considered to be in top quintile of income for the country (moneysense), but they have problems living on this income as has been shown in previous posts.
Ever singles and divorced persons without children with before-tax income equivalent to this couple will pay much more tax, for (example $60,000 to $70,000 income). If one calculates the income tax contributed by an ever single at $15,000 per year time 40 years of employment total contributed to Canadian coffers is $600,000 over working life. Employment insurance deductions (used in large part for maternal/paternal leaves) at $1,000 per year adds another $40,000 to the total. Ever singles never get any of this back because they pay more taxes, can’t pension split and are not considered to be part of the financial family by politicians, government and even their own families and married/coupled siblings.. All political parties are guilty of excluding ever singles from financial formulas. Ever singles have very little financial and voting power because they are a minority in a society where parents and children rule.
Ever singles and divorced persons without children are being pushed into a state of poverty by the plethora of tax credits given only to families, but for which ever singles and divorced persons without kids have to pay without getting equivalent of same benefits.
This blog is of a general nature about financial discrimination of individuals/singles. It is not intended to provide personal or financial advice.