RETIREMENT INCOME SECURITY FINANCIALLY DISCRIMINATORY FOR EVER SINGLES AND EARLY DIVORCED/SEPARATED PERSONS

RETIREMENT INCOME SECURITY FINANCIALLY DISCRIMINATORY FOR EVER SINGLES AND EARLY DIVORCED/SEPARATED PERSONS

(These thoughts are purely the blunt, no nonsense personal opinions of the author and are not intended to provide personal or financial advice).

This blog post was updated on December 1, 2017 replacing 70% information with 1.4 equivalence scale for couples to that of singles, not 2.0.

So here we go again, several organizations, primarily Chambers of Commerce and financial planning and insurance associations, have taken out a full page in newspapers across the country for an article called “It’s time for national cooperation on retirement income security” and is addressed to Federal, Provincial and Territorial Finance Ministers (clhia).  In this article, widowed elderly are highlighted over single elderly seniors in regards to living below the poverty level.

The article talks about being proud of Canada’s retirement system.  It then goes on to say: ‘That said, there are pockets of our population who are not as well-prepared for retirement as they could be.  These shortfalls are specific to certain segments of our populations. Hence, any ‘one-size-fits all’ approach could prove harmful to the economy as a whole and be unnecessary for many.We believe that the time has come to take a targeted approach to addressing any shortfalls.  Such an approach should be national in scope..  It should be fair, so that it doesn’t introduce inter-generational transfers or require over-saving where it is not needed.  It should be cost efficient and easy to implement.  It should minimize administrative burdens for employers.  And it should be good for the economy.

There are three specific segments not on track to maintain their standard of living in retirement:

  1. A small percentage of lower-income Canadians live below the poverty level, particularly the widowed elderly.  The commitment in the federal budget to increase Guaranteed Income Supplement (GIS) payments will provide some assistance in easing this situation  But more could and should be done, such as eliminating the claw-back for a surviving spouse under the Canada/Quebec Pension Plan.
  2. Up to 25% of modest-income Canadians (say above $27,500) are not on track, largely because they do not save outside of the public system and/or do not have workplace plans.  This group could benefit most from a modest increase in C/QPP contributions that would help meet their needs.
  3. Up to a third of higher-income Canadians are not on track to maintain their standard of living in retirement because they do not have a workplace plan or don’t maximize their participation in one, or they do not have sufficient private savings.  This group as well as all Canadians should have access to a retirement plan at the workplace, where it is easiest to save.

The undersigned urge all government to pursue a national, multi-faceted approach to improve retirement income security for all Canadians’.

The article is then signed by fifteen different organizations.

Statistics show that in 2014 there approximately 6 million seniors age 65 and over.  From BMO “Retirement for One-By Chance or By Design” (bmo) in 2008, approximately 57 percent of seniors were married; of the remaining 43 per cent of single status, 30 per cent were widowed and 13 per cent were divorced/separated or never married (ever singles).

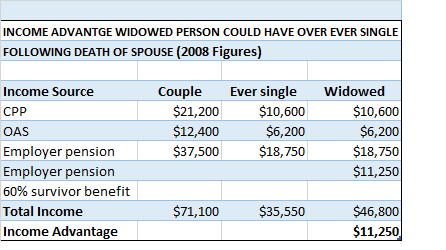
BMO goes on to say that one of the realities for ever singles is that they lack survivor benefits.  The following table shows that ever singles and widowed persons, both with employer pensions will still probably have the same income.  For widowers with a spouse who also had an employer pension, the widower will have a higher income level from spousal employer pension survivor benefit.

income advantage senior widow over ever single2

Persons who become widowed are now ‘single’ so why should they receive special privileges like no income claw back for surviving spouses?  What do ever singles and early divorced/separated persons get that is comparable?   Studies repeatedly show that according to equivalence scales (equivalence-scales) it costs a married/coupled person family unit without kids 1.4 times that of a single person household, not double..

This blog has published several posts where it has been shown that financial advisors have no clue about the financial affairs of ever singles and early in life divorced/separated persons.  One wonders what  financial experience Chambers of Commerce have that they can comment on the financial affairs of singles.

Once again, the widowed elderly have been highlighted as an area of concern while ever singles and early divorced/separated persons are left out of the financial discussion.

There is complete financial illiteracy by most people on what it truly costs to live as a single person.  The post ‘Real Financial Lives of Singles’ (singles) gives five case studies, four of which contribute to employer pension plans, and one widowed person who has considerable wealth and is concerned that he can no longer pension split and may have his OAS clawed back.  Even with an employer pension plan it is not easy for singles to have a decent financial life.  Another post ‘Continued Financial Illiteracy of Financial Gurus Equals Financial Discrimination of Senior Singles’ (senior-singles) shows the financial silos that have been created by governments where married/coupled persons as one family unit and some widowed persons as one family unit receive more financial  benefits than ever singles and early divorced/separated persons family units.

To ensure financial equality between singles, widowers and married/coupled persons, the following measures need to be taken:

    • change financial formulas so that senior couples receive 1.4 equivalence scale only of whatever is given to a single senior person household as it costs more for single senior person household to live than it does married/coupled family units because of economies of scale
    • financial formulas should be revised to include all senior persons regardless of marital status in one financial formula.  To eliminate financial silos that benefit married/coupled persons most, delete benefits already given to married/coupled persons such as pension splitting (benefits the rich most) so that there is a level financial playing field for all regardless of marital status. (It is understood that it is expensive to raise children and  benefits given for children should last for first twenty years of the life of the child. However, beyond the twenty years of the children, any other benefits given to married/coupled persons should be deleted or revised to a rate of 1.4 to that of a single person)
    • create a side-by-side list of all possible benefits under categories of married/coupled, widowed and single and analyze what each category gets in benefits.  Financial formulas should be created equally for all categories, not just the married/coupled and widowed.
    • delete allowance benefit that has been ruled to be discriminatory by the courts
    • education, education and more education on financial literacy for singles.  Think tanks, financial gurus and married/coupled people need to educate themselves on what it really costs singles to live.
    • financial benefits should be income-tested for all family unit types.  Income testing should include housing and savings.  It is likely to cost ever singles more to live as they are more likely to rent while widowers are more likely to own their own homes.
    • all financial formulas for singles should include ever singles, early divorced/separated persons and widowers on an equal basis.

This blog is of a general nature about financial discrimination of individuals/singles.  It is not intended to provide personal or financial advice.

EMPLOYMENT INSURANCE FINANCIALLY DISCRIMINATES AGAINST THOSE WITHOUT CHILDREN

EMPLOYMENT INSURANCE FINANCIALLY DISCRIMINATES AGAINST THOSE WITHOUT CHILDREN (‘EVER’ SINGLES)

These thoughts are purely the blunt, no nonsense personal opinions of the author and are not intended to provide personal or financial advice.

There has been much discussion lately about Employment Insurance (EI) in Canada particularly in those provinces who have been hit hard by the crash in oil prices.

There is also much that is unequal in how EI is paid out and the ruling Liberal party has stated that they will be looking at reforming the EI system.  One example is most Albertans need 700 hours of work to qualify for EI in sharp contrast to the 420 hours of work required for most Atlantic Canadians.

With inequities in how EI is paid out, one also needs to look at how much EI is paid out for maternity/paternity leaves.  It is very difficult to find statistics on how much EI is paid out for maternal/paternal leave versus that paid for the rest of the population (those who have lost their jobs).

Current Rules

EI maternity benefits are offered to mothers who cannot work because they are pregnant or have recently given birth. A maximum of 15 weeks of EI maternity benefits is available. The 15 weeks can start as early as eight weeks before the expected date of birth, and can end as late as 17 weeks after the actual date of birth.

EI parental benefits are offered to parents who are caring for a newborn or newly adopted child. A maximum of 35 weeks of parental benefits is available to parents. The two parents can share these 35 weeks of benefits.

Many companies top up their EI benefits for maternal/paternal benefits to one year.

Who pays for EI?

Every employed person pays EI premiums up to maximum of $930.60 per year (in 2015) plus employer contributions.

How are EI dollars used in maternal/paternal leaves?

For maternal/paternal EI leave, all things being equal, it is understood that each working parent will pay EI premiums.

One could say that with the birth of two children, the EI premiums paid by each parent have been used up.  With the birth of each additional child after two children, the parents have not only used up their EI premiums and are now drawing from the EI system that has been paid for by their employers and other Canadians.  In addition, if they are unemployed and have used EI premiums for two children, they again are drawing monies from the EI system that have been paid for by their employers and other Canadians.

Now consider those persons who have paid EI premiums, have never had any children and have been gainfully employed throughout their entire lives without drawing any EI benefits.  These persons are supporting/subsidizing those parents who have taken maternal/paternal leaves for their children.

Singles are forced to help pay for maternity/paternity benefits for not only one generation, but possibly two generations (if single works from age 25 to 65 years, span of 40 years could mean paying for more than one generation).  In addition to being forced to help pay for maternity/paternity benefits, there is the expectation to contribute to wedding/baby shower gifts for fellow generations (again could possibly be for more than one generation), but singles never get anything in return.  (This paragraph was added to post on April 20, 2016).

ANALYSIS

The Liberal party, with the present crash in oil prices, has actually used some outside the box thinking and given extra EI benefits to those older employees who have never used EI benefits in the past.  Long-tenured workers in the 12 regions identified in the budget as suffering the sharpest jumps in joblessness will be eligible for an extra 20 weeks of benefits to a maximum of 70 weeks.

Another outside the box thinking idea should be rebating at least some EI premiums back to senior employees without children who have never used EI benefits throughout their working lives.  They deserve as much for having supported families for many, many years.

LOST DOLLAR VALUE

For a person (‘ever’ single and married/coupled persons without children) who has been gainfully employed for forty years and paid an average of $900.00 per year (which is now at a maximum of $930.60 per year), the Lost Dollar Value would be $36,000 per person.(Updated April 10, 2016 as review of data over a couple of decades reveals EI amounts have been as low of approximately $800.00 to high of over $1000.00.)

ADDENDUM  (April 7, 2016)

For some who have applied for EI benefits this can be a demoralizing process, particularly if the person processing the application on the other side of the table is not very helpful. Families using EI for maternal/paternal  benefits do not have to face these obstacles.

‘Ever’ singles (never married, no kids) are never recognized or thanked for the contributions they have made to support families, one big contribution being EI benefits.  Adding insult to injury, all political parties over the years have used extra EI monies collected from employees and employers to pad budgets not related to EI.

“Ever’ singles in their senior years face huge obstacles in attaining the same financial standard of living as families and married/coupled persons because they are always forced to pay more and get less.  They also are not given the same level of benefits such as pension splitting which can provide thousands of dollars in tax savings for married/coupled seniors.

Financial fairness for ‘ever’ singles requires outside the box thinking.  One idea would be to give ‘ever’ senior singles a $2,000 or $3,000 annual totally refundable tax credit that would provide an extra $200-$300 per month to compensate for the EI monies they have given to families over the years.  (It would be very easy to identify ‘ever’ singles as marital status  is a required piece of information on tax returns.)

This blog is of a general nature about financial discrimination of individuals/singles.  It is not intended to provide personal or financial advice.

EVALUATION OF MONEYSENSE ARTICLES RE THE COST OF RETIRING WELL: COUPLES VERSUS SINGLES, DECEMBER, 2014 AND JANUARY, 2015.

EVALUATION OF MONEYSENSE ARTICLES RE THE COST OF RETIRING WELL:   COUPLES VERSUS SINGLES, DECEMBER, 2014 AND JANUARY, 2015.

These thoughts are purely the blunt, no nonsense personal opinions of the author and are not intended to provide personal or financial advice.

SOURCES OF INFORMATION FOR THIS BLOG POST

MoneySense, December, 2014, “The Cost of Retirement Happiness” by David Aston (couples) /the-cost-of-retirement-happiness/

MoneySense January, 2015, “Single Retirees: The Power of One” by David Aston (singles) /single-retirees-the-power-of-one/

Kudos to MoneySense-they are one of the few sources of information that identify what it truly costs singles to live in comparison to married/coupled persons.

——————————————————————————————————————–

The above articles for couples and singles were presented in two different timeframes by MoneySense.  financialfairnessforsingles.ca thought it would be an interesting exercise to combine the figures from both articles and complete an analysis of the figures for the married/coupled retirees versus the singles retirees.  (It is important to note that the definition of ‘single’ status by MoneySense is not the same definition used by financialfairnessforsingles.ca and Statistics Canada.  The only person who is truly single in the six profiles is Spencer as an ‘ever’ single person (never married, no children), while Reynolds is divorced and McDonald is widowed.  This is based on and justified by the Canadian Income Tax forms where the status of the tax filer has to be entered re status of married, single, divorced/separated or widowed and Statistics Canada definitions of marital status).

MoneySense Comments on Retirees Incomes

Couples – According to MoneySense author, a couple should be able to have a middle-class retirement lifestyle spending $42,000 to $72,000 a year including income taxes and assuming there is a paid-for home and no debt.  After tax, that will leave about $38,000 to $62,000 a year to spend as couples choose.  The minimum of about $38,000 (excluding taxes) should be sufficient to cover the basics, including operating a car and eating healthy.  Money Coaches Canada advises keeping annual spending on the basics within the $25,000 to $35,000 range, while trying to ensure there is at least $10,000 for extras, (Dec. /14, article).

Singles – According to MoneySense author, a middle class single retiree should count on spending approximately $30,000 to $50,000 a year including taxes and assuming there is a paid-for home and no debt.  This is about 70% of what is required for a couple since it costs about 70% of the couple’s rate for a single to maintain the same lifestyle as a couple.

For $30,000 income, taxes would be about $2,000 to $3,000 for older singles and $3,800 to $5,100 for younger singles below age 65.  After taxes and if budget is tight, singles should allow at least $20,000 to $25,000 a year for the basics (including shelter, groceries, transportation and clothing) and at least $5,000 for the extras like entertainment and travel, (Jan. /15, article).

Detailed Financial Information

Couples

Case #1 – It is stated that the Taylors live frugally but comfortably.  They have a paid-for three-bedroom home in a nice neighborhood and a ten-year old mid-level car. They eat out occasionally and take regular vacations.  They spend just over $25,000 on the basics, which leaves enough left over to spend almost $12,000 on the extras.  They both have university educations and held high-paying jobs in the technology industry while raising one child, who now lives independently.  Their modest spending habits allowed them to build their savings quickly while working, so they were able to retire in their early 50s and have a large nest egg.

Many advisers tell prospective retirees that they need to replace 70% to 80% of the peak income they had while working, but the Taylors live on less than 20% of the $250,000 they earned while working.

Case #2 – The Statscan couple depicts the average spending by senior couple.  (Source: Statistics Canada, Survey of household spending in 2010) plus inflation adjustments using the Consumer Price Index.

Case #3 – The Coopers, both close to 70, have lots of money to do the things they consider important, but don’t live a lavish lifestyle.  They spend modestly on the basics, which leaves plenty for the extras that give them the most satisfaction, like travel.  Their basic spending, at just under $45,000, isn’t much more than that of the Statscan couple.  But by economizing on the basics, they can afford to spend about $36,000 on the extras.  They learned frugality early on in life.  During their working years, they lived on his public sector professional salary while she had primary responsibility for the household and raising three children.  They also benefitted from his pension plan and saved by living well within their means and invested wisely. They have two vehicles (buy them used and keep them well beyond ten years).  Now they have far more money than they need to support their accustomed lifestyle.

The Coopers love to spend money for the benefit of their extended family.  They have a two-bedroom condo in the city as well as a vacation property.  They use their $16,000 travel budget for regular vacations.  They even spend some of their budget to cover the cost of extended family joining them on vacation.  They also contribute to their grandkids’ RESPs.  And while the $6,000 they budget for charitable and personal gifts is not enormous, they have distributed around $500,000 to their kids over the years to give them a good start.

Singles

Case #1 – ‘Ever’ single Spencer is in her early 60s and had to stop working at her physically demanding public sector job over a year ago due to a repetitive stress injury.  She hopes to return to work in some role, but even if she is unable to work again she feels she can live comfortably and sustainably on what she now has in savings, as well as government and employer pensions.  She has a $38,000 budget and pays $5,000 in income tax. Based on having a paid-for home she will spend about $23,000 on basics which leaves about $10,000 left for the extras.  She recently made the choice to move to a small town, mainly for the small town lifestyle, but also for the lower cost of living as well.  Money has been set aside to purchase a modest home.  (She does state that earlier in life she had some bad spending habits; however, she has learned to make careful, purposeful spending choices).

Case #2 – Reynolds in her early 60s (split up with her partner about ten years ago and no children?) is intent on making the most of retirement and has above-average means to do so.  Recently retired after a career in the public sector, she has a budget of $73,000 a year, including about $33,000 for the basics, and a sizeable $25,000 for the extras.  She likes to travel and has about $6,000 a year allocated to it.  In the early years of her career she was fixated on saving, which helped provide the ample nest egg she has today, including a group RRSP.

Case #3 – McDonald, a widower in his late 60s, has an above average budget of about $81,000, including $41,000 for the basics and $21,000 for the extras.  He uses his money to support hobbies, travel and spending on his two grown children and their families.  He is trying to find a balance between spending his money and leaving a large legacy.  He takes two to three trips a year with his $10,000 budget.  His budget also covers some travel for his children and relatives.  He spends quite a bit on groceries and restaurants, including paying for meals with extended family.  He happily spends less than his ample means would allow.

Qualifying Statements by MoneySense about the two articles

The MoneySense author along with Money Coaches Canada notes that the category ‘shelter’ includes property taxes, utilities, maintenance, house insurance, rent and mortgage payments.  Case #3 Statscan figures include a small proportion of costs attributable to a second home.  For the ‘vehicle’ category, $2,000 a year has been added for depreciation.  The category ‘home and garden’ includes cleaning supplies, furnishings, appliances, garden supplies and services.  The category ‘recreation and entertainment’ includes computer equipment and supplies, recreation vehicles, games of chance, and educational costs.

The author also makes the following qualifying statements: “If you are single, you know that retirement planning is tougher for you than it is for couples.  You have no one to rely on but yourself, and you can’t share expenses or split income.  As a result, you can’t just take the cost of retirement for couples and divide it by two. Situations vary, but a single person will need to spend roughly 70% as much as a couple to enjoy an equivalent lifestyle in retirement…The figure for couples isn’t twice the figure for singles–it is only about 40% higher because spouses are able to share costs for things like housing and cars.  The higher per-person income singles need also results in higher taxes”.

Table

The following table combines the financial profiles of the three couples and three singles from the two articles into one table.

Following the table are financialfairnessforsingles.ca comments evaluating the results of the financial profiles.
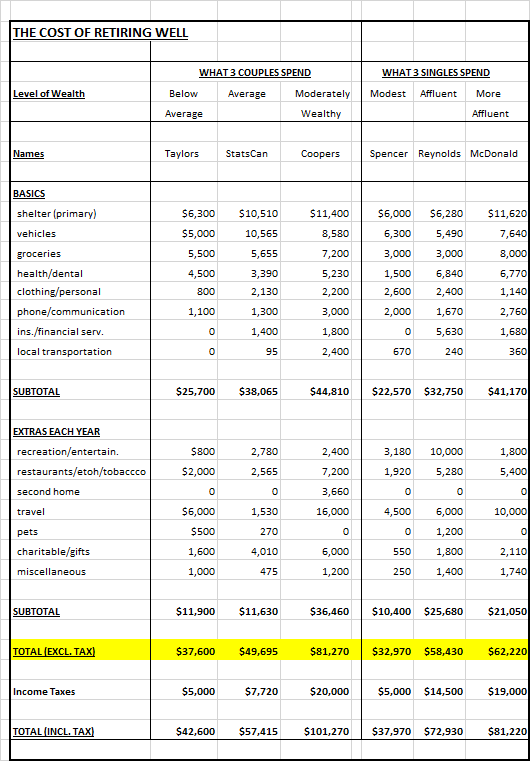
moneysense cost of retiring well

Analysis of the Financial Profiles of Couples Versus Singles

Marital Status

First, it is important to get one fact straight.  Couples who divorce/separate and persons who are widowed are not singles.  The only person who is truly single in the six profiles is Spencer as an ‘ever’ single person (never married, no children).  The profile of the ‘ever’ single person shows that she is likely at the bottom of the financial status list in terms of wealth as she is the one with a modest home in a small town where it is cheaper to live.  The separated person likely has a better financial profile because she was able to accumulate wealth as a coupled person for twenty-five or thirty years and was separated later in life (if she had separated earlier in life, she likely would have a financial profile more equal to the ‘ever’ single profile).  All of the other profiles show that they have more wealth and homes in nice neighborhoods and even second homes (Coopers).

Benefits

Marital status also determines who is likely to have more benefits.  It can be assumed that the couples have the higher financial status simply because they are married or widowed.  The married profiles will most likely pay less income tax than the single profiles because couples receive two of everything, have the ability to pension split and can get survivor benefits when widowed, etc.   As retirees, the two profiles that lose on benefits are the ‘ever’ single person and the person who is separated.

It is stated that most of the couples have lived so frugally that they now have more money than they need, but at same time have three bedroom houses in nice neighborhood, vacation home, and can retire in their 50s and 60s with a very comfortable lifestyles.  This implies, even with frugality, they had plenty of money to spend and save as married/coupled families with children.

The single person is the one that has to move to a smaller town to lower living expenses while others are living in what appears to be substantial housing.

Taxes

On examination of the profiles, it is easy to see that the persons who are paying the most taxes are the ever single person, the separated person and the widowed person.  The Taylor couple pays the same taxes as the ‘ever’ single person (Spencer), but they have approximately $5,000 more in income and appear to have much more wealth in terms of assets (must be the pension splitting).  It pays to be married.  The Statscan couple pays less income tax (almost one half of the amount equal to 13.4%) than the separated Reynolds person (20%), but her income does not come even close to double of the Statscan couple.  The Coopers are paying only $20,000 on $100,000 income (20%).

The widowed person (McDonald) with all of his wealth is most likely receiving survivor benefits.  Did he pay extra for these benefits and why is he portrayed as being single?   If he is now single why should he receive anything more than the ‘ever’ single person and the separated person?

Benefits to Families of Coupled People

The profiles of the coupled persons and the previously coupled person (widower McDonald) blatantly state that they have more money than they can spend and have given generous monetary gifts, paid for the meals of their kids, grandchildren and extended family members, etc.

Married/coupled people or previously coupled people are often able to give exorbitant gifts, inheritances, etc. to family and extended family.  Does this not create a sense of entitlement for family, children and grandchildren who begin to expect this all the time? How does this extravagance teach frugality?

Emergency Monies

Where in any of these profiles has money been set aside for emergencies?  The person most likely to be unable to pay for financial emergencies due to illness, financial issues, etc. is the ever single person with the least accumulation of wealth.

Education, Education, Education!!!

It is beyond comprehension on how governments, families, society and think tanks lack knowledge and are financially illiterate on the true facts of how ‘ever’ singles and divorced/separated retirees are financially robbed to subsidize married/coupled retirees by paying more taxes while getting less benefits like pension splitting and widower benefits in this country.

Singles require 70% of the income/wealth of Couples

How many ways can this fact be stated and how many different sources of information does the government and society need to make changes on how singles are financially discriminated against in this country??  Do Members of Parliament ever think to include singles when making important decisions like pension splitting and benefits that benefit only the married/coupled and families of this country?  Government, businesses, society and media only ever talk about middle class families. Singles meanwhile have been financially discriminated against by their government and society.

 How expensive is it to raise a child?

So how expensive is it to raise one child, two children, and three children and still come out on top in terms of wealth in the personal profiles?  Governments, society and families, think tanks continue to talk about how expensive it is to raise a child, and yet many families are able to leave large legacies/inheritances to their children.  Unfortunately, based on the facts this seems to be based on the half-truths and lies of governments, society, families and think tanks.

Profiling

Singles are often profiled as having excessive spending habits/lifestyles while married/coupled persons are usually profiled as being frugal.  Married/coupled persons in their retired state are still profiled as being frugal even though they can give extravagant gifts (in one case around $500,000) to their children and grandchildren and spend more money on items like vacations.

 Happy, happy, happy!!!!!

In both articles the profiles and the author comments seem to imply that everyone is happy, happy, and happy with their financial status.  ‘Ever’ singles and divorced/separated retirees are blatantly told they should be happy with what they have even though they have been discriminated against financially.

‘Ever’ single persons and divorced/separated persons not so lucky to have achieved equivalent wealth (70%) of married/coupled persons as shown in above examples wish to state they are not happy with being financially discriminated against on every level of government and society.  They are not asking for more than married/coupled people.  They are asking for financial fairness.

FINAL STATEMENT

Governments, businesses, society, families, think tanks all maintain that the middle class is being affected most by poverty.  The real truth is that ‘ever’ singles, singles with kids, persons divorced/separated early in marriage/coupling, and families with low incomes are being affected most by poverty.  Singles (‘ever’ and divorced/separated) in this country are not happy with always being excluded from financial formulas and conversations.  They are human and in their humanity are equal to married/coupled people, and it is time that they are treated with the same financial fairness, dignity and respect as married/coupled people.

This blog is of a general nature about financial discrimination of individuals/singles.  It is not intended to provide personal or financial advice.

REWARD PROGRAMS BENEFIT MARRIED/COUPLED PERSONS AND FAMILIES MORE THAN SINGLES

REWARD PROGRAMS BENEFIT MARRIED/COUPLED PERSONS AND FAMILIES MORE THAN SINGLES

These thoughts are purely the blunt, no nonsense personal opinions of the author and are not intended to provide personal or financial advice.

In the last post money programs such as the Alaska Permanent Fund Dividend program was discussed on how these programs benefit married/coupled persons and families.

This post discusses ‘freebie’ programs like fuel discounts, and giveaways like glassware, etc.  Safeway Canada in Alberta will be used as the company of choice in the examples outlined here (note:  reward programs may vary from province to province).  A family of four will be compared to a single person’s grocery budget.  For ease of comparison a family grocery budget of $840 a month or $210 per week will be used and for a single person $200 a month or $50 per week (remember, previous reader opinion letters have stated singles should be able to live on  $200 a month for groceries /reader-opinion-letters/).  For ease of comparison a vehicle with 100 litre fuel capacity will be used for both family units and singles, even though it is recognized families are more likely to have vehicles with larger fuel capacity than singles.

(Caveat:  food budgets are dependent on region, what is included in food budget and the age of the children.  Some regions have very expensive food costs, some budgets include paper and cleaning products, and food budgets will increase as children get older.)

Present Safeway ‘freebie’ programs running at the present time include:

  • Fuel Spend $35, get 5 cents off per litre
    • Spend $70, get 6 cents off per litre
    • Spend $105, get 7 cents off per litre
    • Spend $210, get 10 cents off per litre
  • Air Miles Points program –  Collect 95 cash miles – get $10 off grocery purchase (for comparison here only the coupon for ‘spend $100, get 100 air miles’ once per month will be used.  Additional air miles for buying certain products will not be used as it would be too difficult to calculate).
  • Glassware (Spiegelau) program – collect stamps from Oct 30, 2015 to March 3, 2016.  For every $10 spent in groceries, one stamp would be received at the checkout.  For every 50 stamps collected, purchaser would be eligible for one pair of glasses (for example, white wine, red wine glasses, etc.).  Safeway retail price stated in brochure is $39.99 for a pair of glasses.

COMPARISON

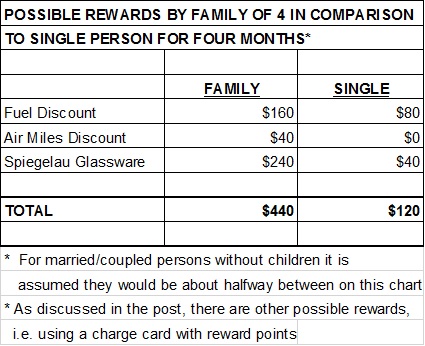
Fuel – For comparison purposes here, it will be assumed that families will spend $210 per week on groceries and, therefore, will receive 10 cents off per litre of gas.  For a vehicle with 100 litre fuel capacity requiring a complete refuel, the fuel discount would be $10 times four weeks for a total of $40 per month for a family and $5 time 4 or $20 a month for a single.  The total discount for four months for a family would be $160 for a family and $80 for a single; therefore, totals of $160 and $80 will be entered on chart.

Air Miles – If coupon ‘spend $100, get 100 air miles’ is used once per month families would be able to get a discount of approximately $40 on groceries (for every 95 Air Miles get $10 off) for four months, while singles would not be able to use this coupon as they have not spent $100 to get 100 air miles points.  On chart $40 will be entered for families and $0 will be entered for singles.

Glassware Rewards – Groceries by family at $840 per month times four months equals $3360.   This amount divided by $10 equals 336 stamps divided by 50 stamps gives possibility of acquiring 6 sets of glassware (2 glasses per set).  The value of six sets of glasses at approximately $40 or $240 will be entered on the chart.

Groceries for a single person at $50 per month equals $200 times four months for a total of $800.  This amount divided by $10 equals 80 stamps divided by 50 stamps gives a single person the possibility of acquiring only one set of glasses (2 glasses per set).  The value of one set of glasses at approximately $40 will be entered on the chart.

reward programs1

FINAL EVALUATION

For this particular example, families have been able to receive rewards totalling approximately $440 to that of $120 for a single person.  Married/coupled persons would probably fall halfway between families and single persons.

It should also be noted that even more rewards are possible if, for example, charge cards with reward points are used to buy groceries provided that the charge cards are paid every month in a responsible fashion so as not to have to pay interest charges.

It is also recognized that those ‘with the money’ (for example, the rich, middle class families and married/coupled persons) will be able to acquire more rewards value , than the poor and singles because the setup of the reward programs makes it possible for those ‘with the money’ and families to get more rewards.

LOST DOLLAR VALUE

This list is still a work in progress.  However, for the list a ’lost dollar value’ for singles $240 for fuel rebates will be used ($160 minus $80 times three for total of 12 months).  The only ‘lost dollar value’ that will be added to the list is the fuel rebate as this is the only constant available and easily calculated for an entire year.  (Lifetime total age 25 to 85, $240 times 60 years equals $14,000.)

CONCLUSION

Initially, examination of the fuel discount program reveals that this is a good program for those with less money to spend as only $35 needs to be spent to get a 5 cent discount, but $210 (six times more in dollars) needs to be spent to  get 10 cent or double discount. However, in the end, extra dollars spent on groceries and stacked rewards still means family of four will get a greater discount than the single person.

Manipulation of reward point programs can also occur in many ways.   It is known that some spouses of married/coupled persons and families will split the grocery bill between them.  A family with a $210 grocery bill will split bill between each spouse at $105 to each get 7 cents fuel discount and 100 air miles  Each spouse can fill up their vehicles once week and get 7 cent discount.

What can one say about rewards programs?  Not much, except to say that reward programs benefit the rich, married/coupled persons and middle class families the most. Can anything be done to level the playing field on reward programs for the poor and singles?  Probably not, except maybe to put a cap on the programs or eliminate them completely.  Elimination would mean everyone would be on level financial playing field with everyone paying same price.

Once again, most married/coupled persons, families and rich are completely unaware of the financial power and  advantage they have over the poor and singles.  And, imagine what other financial advantages are out there as this is only one reward program out of many.

The benefits of reward programs are in the eye of the beholder.  Of course, those who benefit the most relish the thought of accumulating whatever they can, often tier upon tier upon tier. Many believe that one should be rewarded more if one spends more, even if it is at the expense of the disadvantaged and those who have limited food budgets.

And, it does not help for singles to band together (for example two people)to buy groceries as half a discount on a tank of gas is only half a discount.  Half of a set of glassware is only one glass.  Singles are told over and over again that they spend too much.  The reality is that reward programs force them to pay more and get less for the necessities of life like groceries.

“OUR BIG FAT WALLET” BLOGGER’S OPINION -new-pilot-program-are-bigger-fuel-discounts-ahead/

The blog “Our Big Fat Wallet” talks about reward programs in the post ‘Safeway’s New Pilot Program:  Are Bigger Fuel Discounts Ahead?’  Some interesting comments are made on reward programs as well as reader comments as follows:

“Tiered Savings Programs

I’m hoping the pilot program is implemented permanently and other stores follow suit by increasing their fuel savings.

Ideally I would like to see stores have a tiered savings program like Safeway – that rewards bigger spenders with bigger savings. I like to eat – a lot – so our grocery costs tend to be higher than most.

A tiered savings program would benefit anyone who spends a decent amount each month on groceries and if all stores implemented a similar program, it wouldn’t matter what store you buy your groceries at.

If you spend more than $200 in-store, you should be rewarded with a larger fuel discount than someone who only spends $35. With food prices climbing higher and higher, it’s becoming even easier to reach new heights on grocery bills so any additional discount at the pumps would help.


Reader comment:

Interesting! When will we know whether the “test program” is put in for good? I’m secretly hoping it is as my husband and I spend way more on groceries than we should so any place we can save a buck or two helps


Another reader comment:

I love fuel money tied to grocery stores. Where I live, gas prices are provincially regulated, so there is no option of driving down the street a kilometer and saving an extra $0.02/L, so these programs are the only way to get discounts.

A while ago, Sobey’s had a deal where if you bought $200 in GCs you would get $0.10/L off. And you could stack them. Then, if you used them at their gas station, you got $0.035/L to use in the grocery store. It was an awesome circle because you sometimes they’d let you buy gift cards with other gift cards. We got a few very cheap tanks of gas, LOL.

“Our Big Fat Wallet Blogger comment”:

I actually didn’t know gas prices could be provincially regulated. Using gift cards to buy gift cards – now that’s a sweet deal!


Another reader comment:

It’s really nice that it works in your favor, especially since you spend a lot on groceries. Well, hopefully they will implement it permanently!

“Our Big Fat Wallet” Blogger’s response to this reader’s comment:

I am hoping they will implement the program for good and that other retailers will be forced to offer more incentives so we can all start to get bigger fuel discounts”

This concludes the post.

This blog is of a general nature about financial discrimination of individuals/singles.  It is not intended to provide personal or financial advice.
 

MONEY BENEFIT PROGRAMS FINANCIALLY BENEFIT MARRIED/COUPLED PERSONS AND FAMILIES MORE THAN SINGLES

MONEY BENEFIT PROGRAMS FINANCIALLY  BENEFIT MARRIED/COUPLED PERSONS AND FAMILIES MORE THAN SINGLES

These thoughts are purely the blunt, no nonsense personal opinions of the author and are not intended to provide personal or financial advice.

Married/coupled persons and families often receive ‘free money’benefits that financially benefit them much more than singles.

Two very good examples of these benefits are the Alaska Permanent Fund Dividend and the ‘Ralph Klein $400 Bucks’ Program.

Alaska Permanent Funds Dividends

The Alaska Permanent Fund Dividend (PFD) program implemented in 1982 is an annual payment paid to individuals (children as well as adults) rather than households.  It is paid irrespective of any income from other sources and does not require the performance of work or the willingness to accept a job if offered.  Unlike social assistance programs, it is not means-tested.

The book “Alaska’s Permanent Fund Dividend:  Examining Its Suitability as a Model”, edited by Karl Widerquist and Michael W. Howard states the following:

‘…..In 2008, when the PFD reached its highest level at $2,069, the individual  poverty threshold in the United States was approximately $11,000; for a family of four it was approximately $22,000.  Thus, at its highest level, the PFD would have provided less than 20 percent of the income necessary for an to individual to reach the poverty threshold, but almost 40 percent of the income necessary for a family of four to reach the poverty threshold……Thus, on basis of its level alone, the PFD is at best a partial basic income…

Finally, because of its flat and universal nature, the PFD on its own makes a very modest contribution to the reduction of inequality.  But the PFD together with the elimination of the state individual income tax that was part of its founding has an overall regressive effect on income distribution.  To have a significant redistributive effect, the PFD would have to be recouped from wealthy individuals; in the absence of a progressive state income, consumption, or wealth tax, the PF would have to be distributed on a sliding scale with larger dividends given to those with less income from other sources, rather than as a uniform flat payment….

The PFD does serve as an excellent model for the conceptualization of natural resources as commonly owned—an important step along the path to acceptance of the idea of a basic income.  It provides a model of cash transfers to individuals without any stigma of dependence, fraud, waste, or failure—attributes often attached recipients of other government cash transfers.  The PFD’s funding source in natural resources rather than in taxes on individual income or wealth seems to exempt it recipients from any need to justify their use of the dividend, and to exempt the transfer as a whole from the ‘socialist’ label….’

It has been argued that it is preferable to have oil profits distributed broadly rather than end up in the pockets of only a few corporate executives, wealthy shareholders, and political cronies.

Alaska is the only state that does not collect sales tax or levy an individual income tax on any type of of personal income, either earned or unearned.  Every Alaskan, children as well as adults, receives a payment each year from the Alaska Permanent Fund Corporation.  The USA does not have child benefits, although there is a child tax credit system for parents or guardians of children under 17 who meet certain requirements.  (The PFD is taxable by the Federal government).

Further review of information shows that in 2002, the poorest 20% of Alaskans relied on their dividend for 25% of their total income….some Alaskans depend on their dividend for up to a quarter of their yearly income, especially Native Alaskans, who make up 15% of the population. Those in poverty brackets and many of those living a subsistence lifestyle cannot afford to lose the dividend as a source of income.

However, review of articles on this program also states that the sense of entitlement has been established where it is very difficult to reduce state spending in this particular benefit at the expense of politicians losing their jobs, because state residents view these dividends as ‘rights’, not ‘privileges’.

One could argue that monies are being given to children who have not earned that privilege.  They have earned no money and have not paid any taxes.

If one looks at the PFD contributions over a twenty year period (lifetime of a family with children) in comparison to singles /individuals, the financial unfairness becomes apparent very quickly.  From 1996 to 2015,the benefits have ranged from a low of $846 to a high of $2,072 annually.  For a family of four the twenty year total amounts to $113,156 and for a single/individual person the amount is $28,289.  A lot more can be done with $113,000 than $28,000.

Prosperity Bonus (‘Ralph Klein $400 Bucks’) Program

The Prosperity Bonus, also nicknamed Ralph (Premier of Alberta at that time) bucks, announced in September 2005, was the name given to a program designed to pay money back to residents of the province of Alberta as a result of a massive oil-fuelled provincial budget surplus.  This program gave $400 to every citizen of Albertan in the year 2005.

For a family of four, the benefit was $1,600, while a single/individual received $400.

ANALYSIS

‘Free Money’ Benefits allow families to achieve greater wealth than singles/individuals even though the children of these families have not earned any income or paid any taxes. Married/coupled persons without children also achieve greater financial benefits because of accumulated assets times two.

SOLUTIONS

To achieve greater financial equality between singles/individuals and married/coupled persons and families, the following suggestions are submitted:

  • Eliminate children from these programs until they reach the age majority since they have not made any contributions to the coffers in the form of salaries or taxes; rather, they are using resources such as education instead of contributing to them.
  • Top up benefits to singles at rate of 70 percent 1.4 Market Basket Measure to that of married/coupled persons as it costs more for singles to live than married/coupled persons living as a single unit (updated August 31, 2018).

This blog is of a general nature about financial discrimination of individuals/singles.  It is not intended to provide personal or financial advice.


HOW MARITAL STATUS IMPACTS DEDUCTIONS, CREDITS FOR MARRIED/COUPLED PERSONS

HOW MARITAL STATUS IMPACTS DEDUCTIONS, CREDITS FOR MARRIED/COUPLED PERSONS

These thoughts are purely the blunt, no nonsense personal opinions of the author and are not intended to provide personal or financial advice.

(While researching online for information on last two posts, this article came up:   “Love and taxes: Canadians confused on how marital status impacts deductions, credits” by Darah Hansen and published in Yahoo Finances on February 12, 2016 just before Valentine’s day.  This article and the comments following the article provide some interesting insight into thoughts of Canadian citizens on reporting of marital status on income tax forms.  This article and comments is also a good follow-up to the information entered in the last two posts.

Comments of the author of this post are shown in italics.)

Quotes From Article

Quote from article states:

  • ‘Recent survey by Leger, on behalf of H&R Block Canada, found that more than half of us mistakenly think that married and common-law spouses can file a joint return to save money on their taxes. Another 40 per cent believe it’s up to us to decide whether to claim our marital status on our tax returns, while a handful of respondents doubt the CRA (Canada Revenue Agency) has guidelines to determine that status.
  • Couples are required by law to check the correct status box in tax forms.
  • Family incomes in Canada are not combined for the purpose of calculating tax; however, they can be for the purpose of calculating income-tested benefits, such as the GST/HST credit or the National Child Benefit supplement.
  • Couples also stand to benefit from combining their charitable donations, transit passes and medical expenses.
  • And, new this year, parents of children under 18 years stand to gain from a newly announced federal tax credit. Often referred to as the “family tax cut”, the new measure allows a higher earning spouse to transfer in kind up to $50,000 in income to his or her spouse in order to collect a tax credit of up to $2,000.Canadian taxpayers are required by law to answer the marital status question correctly.  “If you lie, it’s tax fraud,” says Golombek…..
  • To be considered common-law, two people must live together in a conjugal relationship for 12 months or immediately if you have a child together. If you receive benefits you are not entitled to because of an incorrect marital status, you can bank on being asked to repay them.
  • One final misconception: About 44 per cent of Canadians believe that once you are divorced, you can claim as single the following year. But once you have filed as married, you can never claim single. You are instead classified as separated, divorced or widowed’, (end of quote).

Comments from Readers

The comments following the article, of which there were many, resulted in very different viewpoints.  Indeed, some comments turned out to be very derogatory and inflammatory as often occurs in forums of this kind.  Families with children call singles ‘selfish’ and single call families with children ‘breeders’, etc.  Analysis of the comments revealed some commonalities.

A large majority of Canadian citizens, it seems, don’t have a clue about declaration of their marital status on income tax forms, especially those that are married, divorced, separated, or living common-law.  Canada Revenue Agency (CRA) has very clear definitions of marital status, so why the confusion?

Some of the reasons why incorrect reporting of marital status on income tax forms are as follows, (these are comments that were submitted by the readers):

Unhealthy or unequal relationships with their significant other.  

  • One comment:  ‘good luck in filling as common-law in my case my partner refuses to file common-law, said his taxes are complicated, and we been together now for 5 years. I look at it he is hiding something and don’t want me to know his business.’

Some don’t seem to want to record their marital status as outlined in CRA rules. One of the biggest issues on recording marital status seems to revolve around those that are divorced/separated and what they will have to give to the other spouse in the way of child and spousal support.

  • ‘Once you are legally married you can never again claim “single”. If you divorce, you must say “divorced”, even if you were divorced 40 years ago. If you remarry, of course, you then check the “married” box once again. Until your partner dies, whereby you become “widowed” until you remarry or die yourself.  To be “common law” you will have been living together for 12 months prior to filing your taxes, – or right away if you have a child together and it happens to be less than that.  (Even if divorced for many year, marital status would still be divorced).’
  • ‘Making a “stupid decision” not to inform CRA about this issue will often come back to bite you.’
  • ‘There are more tax breaks for single moms then for being married. It is actually scary to tell them when you finally do get married. There goes everything.’
  • ‘Seems strange, usually you marry the mom not the kids. Not sure why she would stop getting benefits to support her kids. Note to self, stay clear of single moms and the tax man will pin you with the responsibility.’
  • ‘So why (does)  Revenue Canada have different category for divorced people? to have a reason to garnish…  They do this because people who are separated or divorced often have separation agreements/court orders for making support payments. Spousal support payments are taxable in the hands of the recipient and deductible for the payer. Since there are no slips that go with these payments they want to make sure that both parties are claiming it or including it correctly (i.e. not just being deducted by the payer and not included in income for the recipient).’

Many income tax filers have no clue what benefits they will get and how marital status will affect those benefits.  Married/coupled persons don’t seem to realize they will receive more benefits throughout their married/coupled lives than will singles, particularly ‘ever’ (never married, no kids) singles.

  • ‘Single working professionals get taxed the hardest with the fewest deductions.’
  • ‘There is no benefit in being married. Stay single especially single mothers.’ (Married/coupled persons seem to never be happy with the benefits they get).
  • ‘don’t forget to add to move in with your boyfriend either, if you want the benefits or to minimize your tax, of course based on that rationale they should struggle on one income just to get benefits is quite irrational thinking.’  (This presumably was a tongue-in-cheek remark to the above comment.)
  • ‘You may not see the benefits of being married when it comes to taxes, but financially there are a lot of benefits to not be single. Sharing costs like same  housing is huge and when finances are done with purpose in mind can lead to wealth creation.’ (This is known as being able to live more cheaply because of economies of scale-Six Reasons why Married/Coupled Persons able to Achieve More Wealth). six-reasons-why-married-coupled-persons-are-able-to-achieve-wealth/
  • ‘But there is no denying  that two people going in the direction accomplish way more than one person by him/herself….. those who stay together are better off statistically in a financial sense than those who go about it alone.’ (This is because of  ability to accumulate wealth times two persons and ‘rule of 72’ -Six Reasons why Married/Coupled Persons able to Achieve More Wealth)
  • ‘Couples can transfer unused credits to each other. Singles lose unused tax credits.’  (This is because of marital manna benefits – Six Reasons why \Married/Coupled Persons able to Achieve More Wealth)
  • ‘I was once told by my neighbour that he and his wife would be better off financially if they divorced. Obviously not ALL Canadians are confused about tax credits and deductions. (Next comment) Not so. Couples can transfer unused credits to each other. Singles lose unused tax credits.’  (This is known as manipulation of assets as stated in ‘Six Reasons why Married/Coupled Persons able to Achieve More Wealth).
  • ‘I have never paid more than what I owe based on my income whether single, married or divorced. The only difference it makes is for benefits like GST rebates, etc….’
  • ‘Family incomes in Canada are not combined for the purpose of calculating tax.’  
  • ‘They are only combined for potential benefits such as GST tax credits… etc…..you can transfer unused tax credits to lower the spouse’s taxable income, thereby reducing their taxes. CRA combines them for the purpose of calculating GIS benefits and HST refunds.’

Some tax filers choose to falsely record their marital status, though they know they are committing fraud.

  • ‘Most Canadians play dumb as they are fully aware they are breaking the rules and pretend like they didn’t know. They cheat hoping they will not get caught.’
  • ‘If you are married the tax form asks for your spouse’s name, SIN and whatever.’
  • .It’s not your fault you didn’t get caught. It is your fault for claiming single while married. Let me simplify this for you. Two scenarios. Husband and wife. Both make $35k. If they claim single each pays tax on $35k. If they claim married EACH pays tax on $35k. The combining is only for tax credit purposes. Percents don’t change due to marriage or not. Govt fraud is irrelevant to this conversation. And if it is true… then so what … two wrongs make a right? Seriously you need to get professional advice. Just because you have not ‘been caught’ yet does not mean it won’t happen. You are cheating and if you are getting tax credits fraudulently, you will pay a penalty if caught.
  • For those who don’t think there are repercussions to false filing, you can view the convictions from each province at Google “CRA Criminal investigations actions, charges, and convictions”.

Many more comments were made and are too numerous to be included here.

CONCLUSIONS

  • If there is confusion about how to record marital status on tax forms, get professional help.
  • Incorrect filing of marital status on tax forms constitutes fraud.
  • Education, education, education – married/coupled persons need to educate themselves on all the benefits they receive from date of marriage to after their spouse is deceased.  They need to realize that singles have been left out of financial formulas and do not receive benefits such as transfer of spousal credits, pension splitting, tax relief if one spouse is in nursing home, etc. even though it costs singles more to live than married/coupled persons living as a single unit.
  • Singles deserve to be included in financial formulas at 70% of that given to married/coupled persons.  Many singles have worked throughout their entire lives  (35, 40, 45 years) and,with their taxes have supported  married/coupled persons and their families; therefore singles deserve equal financial representation in financial formulas.
  • Problems that divorced/separated persons have with spousal/child support, etc. should not be the problem of singles and should not be a reason to say that ‘singles’ are lying on tax forms (especially ‘ever’ singles who only have one option to record on tax forms, that is ‘single’).

This blog is of a general nature about financial discrimination of individuals/singles.  It is not intended to provide personal or financial advice.
CONTINUED FINANCIAL ILLITERACY OF FINANCIAL GURUS EQUALS FINANCIAL DISCRIMINATION OF SENIOR SINGLES (Part 2 of 2)

CONTINUED FINANCIAL ILLITERACY OF FINANCIAL GURUS EQUALS FINANCIAL DISCRIMINATION OF SENIOR SINGLES (Part 2 of 2)

(These thoughts are purely the blunt, no nonsense personal opinions of the author and are not intended to provide personal or financial advice.)

This blog post is a comment on the Broadbent Institute Report on the economic circumstances of Canadian seniors.  The Broadbent Institute is a left-leaning social democratic think tank founded by Ed Broadbent who was a past leader of the New Democratic Party .  It describes itself as an independent, non-partisan organization championing progressive change through the promotion of democracy, equality, and sustainability and the training of a new generation of leaders.  Its mission is to “Support, develop, and promote social democratic principles for the 21st century”, “Propose new solutions for a more equal society”, and “Equip a new generation of progressive campaigners & thinkers with the tools they need to build a social democratic society through training and education”.

This post addresses excerpts from the report first (Part 1), and then is followed by comments on the report (Part 2).

COMMENTS ON  REPORT – PART 2 OF 2

In February, 2016 the Broadbent Institute in Canada and Richard Shillington of Tristat Resources published the report:  “An Analysis of the Economic Circumstances of Canadian Seniors”.       (analysis_of_the_economic_circumstances_of_canadian_seniors)

The report information is mainly directed towards poverty of seniors without an employer pension plan (roughly 47 per cent) and therefore, many of these seniors have wholly inadequate retirement savings.

(It should be noted in the report that single seniors does not refer to marital status, but the fact that they live alone.  Therefore, single seniors includes ‘ever’-never married, no kids-singles, divorced/separated, and widowed seniors living alone).

Review of the report reveals some points that are very disconcerting.

  • The true facts of what it costs singles to live is under-reported.  Married/coupled persons and, indeed, the author of the Broadbent report do not seem to realize that the widowed (married/coupled persons whose spouses are deceased) are a part of the singles population.  It is a well known fact that it costs singles approximately 70 per cent of what it costs married/coupled persons to live as a single unit.  This fact is never addressed in the report. (Using LIM 11.1 percent of seniors live in poverty–719,000 seniors:  419,000 singles and 250,000 living in an economic family.  The poverty is astonishingly high at almost 30 per cent for senior singles without employer pension plans).  (Widowed persons and the extra benefits they get are discussed later in this post).
  • All the extra benefits that have been given to married/coupled persons are never addressed.  Governments continue to create financial silos where more and more benefits are given to married/coupled persons even though they are able to live with less because of economies of scale, but not to singles resulting in financial inequality.  (Following table was updated on March 8, 2016 with additional information).

financial silos6

  • It is ludicrous that this report does not treat home equity as a retirement asset.  Those who have to rent are at a much greater financial disadvantage than those who own their own home.  Quote from report : “ …..Many of those who argue that there is no looming pension crisis have included home equity as a liquid asset.  This analysis has not treated home equity as a retirement asset because the replacement rate analysis has as its objective an income that allows one to enjoy a lifestyle comparable to that which existed pre-retirement.  We do not include home equity here because we accept that the pre-retirement lifestyle for many middle- and moderate-income Canadians include continued homeownership”, (Page 19).

According to Statistics Canada 2011 articles “Living Arrangements of Seniors” and “Homeownership and Shelter Costs in Canada”:      (statcan.gc.ca) and (statcan)

  • The average household total income for couple-family households was about twice that of non-family households (which were primarily one-person households) and lone-parent households ($101,000 per year versus $43,000 per year and $55,000 per year respectively).  Thus, while lone-parent households and non-family households had a lower cost than couple-family households, the lower household total income results in a higher proportion exceeding the affordability threshold”.
  • Approximately 69 per cent of Canadians own their own home.  About  four out of five (82.4%) married/coupled people own their own home, while less than half (48.5%) of non-family households (singles) own their dwellings.  Just over half (55.6%) of lone-parent households own their dwelling.  (It stands to reason that more senior married/coupled and widowed persons will own their own homes, while senior singles–‘ever’ single and early divorced)–are more likely to have to rent placing them in greater income inequality and a lower standard of living and quality of life). Regardless of housing tenure, the proportion of non-family households and lone-parent households that paid 30% or more of total income towards shelter costs was about twice the proportion of the couple-family households.
  • Quote “approximately 56.4 per cent of the senior population (5 million total seniors in 2011) live as part of a couple and about 24.6 per cent of the senior population live alone (excludes those living with someone else, in senior citizen facilities and collective housing).

Singles are constantly told to ‘go live with someone’ when they have difficulties paying for housing; meanwhile married/coupled and widowed persons may be living in their big houses (enjoying the same lifestyle they had before pre-retirement) and seeking help with paying their taxes while refusing to move to a less expensive dwelling.  (senior-singles-pay-more-part-3-of-4)

  • It is ludicrous for this report to state that seventy per cent  income replacement should be a benchmark in the formulas.  Seventy per cent income replacement is entirely different for those who own their own home versus those who rent.  It is selfish to think that the rich and married/coupled persons should be able to live same lifestyle post-retirement as pre-retirement when singles and early divorced generally will have a poorer lifestyle throughout their entire lives.

An example is the Financial Post financial evaluation “Bright Future Despite Big Debt, Small Income” published in Calgary Herald on February 20, 2016 where Ontario young couple’s after tax income is $4,800 per month and their food budget is $800 and entertainment $160 per month for two people.  Just these two items are 20 per cent of their budget.  Either they live in an area with very high food costs or they are living the high life for one of the necessities of life in Maslow’s Hierarchy of need.  Seventy per cent replacement at retirement would give this couple an unreasonably high style of life for food in comparison to singles.   Reader letter mentioned above in ‘senior-singles-pay-more-part 3-of-4’ link suggested singles should be able to live on just $200 per month for food.

  • It is ludicrous to suggest that persons without employer pension plans cannot save, especially those with incomes over $100,000.

Quote from report:  “For those with incomes in $50,000-$100,000 range, the median value (savings) is only $21,000” (Page 3).

If those with pension plans have forced saving, it it is ridiculous to say that those without pension plans are not able to save.  For example, a $75,000 before-tax income may result in $600-$700 per month being deducted from pay cheque (employer deductions are excluded in this discussion).   It is also ridiculous to say that in this First World country persons with $100,000 plus incomes cannot save.  One of the principles of good finances is to save 10 per cent.  Whole report promotes greed of looking for more benefits and not planning for the future if there is no plan for saving during working years.

  • Reporting false information on marital status is a crime.  Quote from report states:  “Table 7 represents the results of increasing the single and married GIS amounts by the same percentage.  One should keep in mind that there is an incentive for seniors to appear as singles to governments even if they are living as a couple.  This is because the GIS for senior couples is less than twice the amount for singles.  An increase in the GIS for singles only (with no increase for couples) would increase this so-called ‘tax on marriage’ and associated incentives.  This would encourage couples to hide their cohabitation from the authorities for financial reasons”, (Page 21).

GIS for senior couples should, repeat, should be less than twice the amount for singles.  Singles (particularly ‘ever’ and early divorced singles including the author of this blog) have worked very hard to have financial formulas include singles at 70 per cent of married/coupled persons living as a single unit.  The GIS for senior singles is more than married/coupled persons because it costs more for singles (including widowed persons)  to live than it does for married/coupled persons living as a single unit.  Why can’t married/coupled persons understand this?  When married/widowed persons become widowed their living costs will go up.

The statement  “An increase in the GIS for singles only (with no increase for couples) would increase this so-called ‘tax on marriage’ and associated incentives. This would encourage couples to hide their cohabitation from the authorities for financial reasons” is absurd and selfish.  Tax on marriage, why can’t married/coupled persons realize all the extra benefits they receive as outlined in table above???  When is ‘enough’ ever going to be ‘enough’ for them???

The notation (# 28) at the bottom of page 21 states:  “While legislation treats those cohabiting the same regardless of their marital status, it is easier to deceive the government if you are not married”.  This statement is false and backwards.  If it is anyone being deceitful, it is the married/coupled persons.  Can someone explain why it would be easier to deceive the government if you are not married (‘ever’ single)?  The issue with false reporting lies with those who are married/coupled, divorced or separated.  They are trying to ‘milk’ the system by falsely reporting their marital status even though the Canada Revenue income tax rules clearly define the parameters of marital status.

False reporting is a crime.  It would be very easy to track deceit by following income tax declaration of marital status and address of residence over several years.  Deceit of married/coupled persons would incrementally increase the monetary value they would receive from the deceit as it costs them less to live as a couple than it does single persons.

It seems married/coupled persons want it all even if they have to lie about it.  So what will they do when their spouse goes to a nursing home or is deceased?  In order to collect the benefits they are entitled to as one spouse living at home and the the other in a nursing home and widowers, they will need to lie again and change their marital status from single to married/coupled or widowed when filing their income taxes.

‘Ever’ singles (never married, no kids) throughout their entire working lives pay same amount of taxes as each individual (with equal income to the single person) reporting income tax in a married/coupled relationship and have supported/subsidized families who use mom/baby hospital care, EI benefits for maternal/paternal leaves, etc.  They are never recognized for their tax support and for using less resources than families.  Since singles have paid supportive taxes throughout their entire working lives, they deserve to live with the same financial dignity and respect as seniors and as married/coupled persons.  As seniors, ‘ever’ singles deserve to have their own space and their own bathroom and not be forced to cohabitate with other persons.

The real financial lives of singles is revealed when a simple math calculation is used for the targeted tax relief where a single senior can now earn $20,360 and a senior couple $40,720 before paying federal income tax.  This so called tax relief for seniors allows federal tax relief for singles equal to $1,697 per month and for senior couples $3,393 per month.  The tax relief for senior singles hardly covers a rent or mortgage payment of $1,200 and $250 for food per month (Maslow’s Hierarchy of Need), but amply covers this amount for a senior couple.  For a couple $1200 for rent or mortgage and $500 for food leaves $1693 (or 50% of $40,000) for other necessities and maybe even a nice little vacation all tax free.

CONCLUSION

It is incredible how in just a few paragraphs a think-tank can undo the hard work that singles have been trying to achieve in seeking financial equality.  Think-tanks and financial gurus continue to practice financial illiteracy on what it truly costs singles to live.   (false-assumptions-four-ways-seniors-singles-lose outand (financial-gurus-financially-illiterate-about-singles-finances)

Even though the final statement of the report states:  The GIS is the most effective federal mechanism in the short term for reducing the poverty rate and the impact of poverty on seniors, and it can be targeted at senior singles who need it the most”, there are many shortcomings to this report.

This report is encouraging irresponsible financial behavior.  It is morally, ethically and socially reprehensible in a First world country to say that one cannot save with an income over $100,000 and to promote financial inequality and discrimination of singles.

The Broadbent Institute is supposed to be about ‘a more equal society’, so where is the financial equality?

SOLUTIONS

In order to ensure financial equality between singles (including widowers) and married/coupled persons the following measures need to be taken:

    • change financial formulas so that senior singles receive 70 per cent of whatever is given to married/coupled senior persons as it costs more for singles to live than it does married/coupled persons because of economies of scale
    • financial formulas should be revised to include all senior persons regardless of marital status in one financial formula.  To eliminate financial silos that benefit married/coupled persons most, delete benefits already given to married/coupled persons such as pension splitting (benefits the rich most) so that there is a level financial playing field for all regardless of marital status. (It is understood that it is expensive to raise children and  benefits given for children should last for first twenty years of the life of the child.  However, beyond the twenty years of the children, any other benefits given to married/coupled persons should be deleted or should also be given equally to singles at rate of 70 per cent)
    • create a side-by-side list of all possible benefits under categories of married/coupled, widowed and single and analyze the total value of benefits in each category (see table above).  Financial formulas should be created equally for all categories, not just the married/coupled and widowed.
    • delete allowance benefit that has been ruled to be discriminatory by the courts
    • education, education and more education on financial literacy for singles.  Think tanks, financial gurus and married/coupled people need to educate themselves on what it really costs singles to live.

(These thoughts are purely the blunt, no nonsense personal opinions of the author and are not intended to provide personal or financial advice.)


CONTINUED FINANCIAL ILLITERACY OF FINANCIAL GURUS EQUALS FINANCIAL DISCRIMINATION OF SENIOR SINGLES (Part 1 of 2)

CONTINUED FINANCIAL ILLITERACY OF FINANCIAL GURUS EQUALS FINANCIAL DISCRIMINATION OF SENIOR SINGLES (Part 1 of 2)

(This blog is of a general nature about financial discrimination of individuals/singles.  It is not intended to provide personal or financial advice.)

In February, 2016 the Broadbent Institute and Richard Shillington of Tristat Resources in Canada has published the report:  “An Analysis of the Economic Circumstances of Canadian Seniors” http://goo.gl/HNP2Ee

The report information is mainly directed towards poverty of seniors without an employer pension plan (roughly 47 per cent) and therefore, many of these seniors have wholly inadequate retirement savings.

Using LIM (low-income measure) senior poverty has increased from a low of 3.9 per cent in 1995 to 11.1 per, or one in nine, in 2013.  The poverty rates for single seniors, particularly women (at nearly 30 per cent), are very high and need to be addressed, (Page 2).   (LICO, or Low Income Cut Off, is not used here because it is not a true income poverty indicator as it was set in 1992 where families spend 20 per cent more of their income on necessities than was typical and has not been reset since.)

(It should be noted in the report that single seniors does not refer to marital status, but the fact that they live alone.  Therefore, single seniors includes ‘ever’ singles, divorced/separated, and widowed seniors living alone.)

In Canada, the income-tested OAS (Old Age Security) and GIS (Guaranteed Income Supplement) benefits together provide a regular minimum economic guarantee and are used to supplement regular income (from CPP-Canadian Pension Plan, private pensions and private savings) to lift seniors out of poverty.

Some of  the key findings of the report include:

  • The proportion of the population receiving the GIS is higher for senior singles than couples, and higher for single women (between 44 per cent and 48 per cent) than for single men (between 31 percent and 37 per cent), (Page 3).
  • ‘Roughly half of those aged 55-64 with no employer pension  benefits….. have savings that represent less than one year’s worth of the resources they need to supplement OAS/GIS and CPP.  Fewer than 20 per cent have enough savings to support the supplemented resources required for at least five years, (Page 3)…..For those with incomes in $50,000-$100,000 range, the median value is only $21,000…..(Page 3).
  • The overall median value of retirement assets of those aged 55-64 with no accrued pension benefits is just over $3,000.  For those with annual incomes in the range of $25,000-$50,000. the median value is just over $250.  For those with incomes in the $50,000-$100,000 range, the median value is only $21,000, (Page 3).
  • Only a small minority (roughly 15-20 per cent) of middle-income Canadians retiring without an employee pension plan have saved….enough for retirement.  The vast majority of those families with annual incomes of $50,000 and more will be hard pressed to save enough in their remaining period to retirement (less than 10 years)…..(Page 3).
  • The seniors’ poverty gap is $2.5 billion in aggregate annually, due to the 719,000 poor seniors (469,000 singles and 250,000 living in an economic family.)  A 10 per cent benefit increase in the GIS to address this gap would cost $1,628 million, and would reduce the number of poor seniors (married/coupled and singles) by about 149,000, (Page 3).
  • In the recent election, the Federal Liberal Party promised to increase the GIS by 10 per cent for single seniors.  (NOTE:  this does not include coupled seniors).  A simulation using Statistics Canada’s Social Policy Simulation Database and Model (SPSD/M) suggests this would cost $700 million and remove about 85,000 single seniors from the poverty roles, with a reduction in the singles poverty rate of 5.7 percentage points, (Page 3).  (Singles poverty rate of 5.7 percentage points from approximately  28 per cent for senior single females, and 24 per cent for senior single males, that’s all???)

Factors Affecting Seniors Poverty

As of July 2015, the income-tested maximum annual OAS/GIS benefits for seniors aged 65 and over with no other source of income were $15,970 for singles and $25,746 for couples…..The GIS is phased out as income rises and is reduced to zero above an annual income (thus calculated) of $17,136 for single seniors and $22,068 for senior couples, (Page 9).

Reliance on the GIS is greater for single seniors than it is for senior couples across all age ranges…..  For example, 41 per cent of all seniors over 85 receive the GIS, while only 30 per cent of seniors aged 66-69 receive it. (Page 9).

Pension Coverage (Page 12)

The difference in incomes at retirement between those seniors with and without a pension income is stark…..The difference is not all due simply to the presence or absence of an employer pension plan.  Those who have had an employer pension plan are more likely to have had better paying jobs, and jobs with health and other benefits.  As well, it is possible for those who seek out jobs with a pension are more likely to be those motivated to save for retirement.  But certainly, participating in a pension offers advantages that make it easier to have a higher income at retirement, (Page 12).

For couples, those without pension income have significantly lower total incomes ($52,000) to compared to those with pension income ($68,000).  This is despite their higher income from earnings ($19,100 for those without pension income, compared to $7,200 for those with pension income).

For individuals, the story is very different:  They are more likely than couples to be over the age of 70, and much less likely to be employed.  For single women, the median incomes are $18,000 for those without a pension and $30,400 for those with a pension  For men, the medians are $19,000 and $37,300, respectively.  These gaps are significant, (Page 12).

LIM (Low Income Measure) is used in this report and is based on after-tax income to assess poverty of seniors.  This measure shows what proportion of persons have after-tax incomes that are less than half of the median or midpoint to comparable families.

Two criterion to assess adequacy of income at retirement are:  1)  poverty criterion, and 2) replacement rate concept, (Page 13).

Generally,  the median incomes for those without pension income is just over half for those with pension income, (Page 13).

The report goes on “to suggest that a significant proportion of those without an employer pension plan will not have saved adequately for retirement and will suffer a major loss of income”.

Retirement savings without employer pension (Page 14-16)

Report states that from Survey of Financial Security for 2012 about half of families (what is the definition of family here?) aged 55-64 without an employer pension have virtually no savings; indeed 78 per of them have less than $100,000 in retirement savings.  Lower-income families eligible for OAS/GIS along with CPP may still have little or no drop in income, however inadequate that income might be, (Page 14).

….Vast majority of these families with annual incomes of $50,000 and more will be hard pressed to save enough in their remaining period of retirement (less than 10 years) to avoid a significant fall in income.  It appears that at least 25 per cent have very limited retirement assets despite incomes of $50,000-$200,000, (Page 15).

The report does state that ‘analysis presented in tables is somewhat simplistic because it ignores the impact of public benefits (OAS/GIS and CPP) on the amount that future seniors need to save.  It is also accepted that many seniors need less income in retirement in order to maintain the standard of living that they had pre-retirement.  The actual replacement rate required-the ratio of post-retirement to pre-retirement income-varies by how it is measured (pre- or post-tax).  Seventy per cent is commonly used, although it varies by individual circumstances and tastes; higher values are more appropriate for the poor, and lower values are more appropriate for the very wealthy’, (Page 15-16).

Retirement savings compared to income (Page 16-20)

Tables show widespread under-saving using calculations of 70 per cent pre-tax replacement rate…

Some do not need to save for retirement to get 70 per cent replacement because their income is quite low (below $21,429 for singles and $35,714 for couples).  These individuals and couples were deleted from table 5…..,(Page 16).

To illustrate, a family with an income of $100,000 (pre-tax) is assumed to need $70,000 (70 per cent of $100,000), and will get roughly $25,000 in public support.  Thus, they will need to make up $45,000 per year from their private savings, (Page 16).

Even those with an income of more than $100,000 are unlikely to have more than five years worth of the required supplemental income in their retirement savings; only 21 per cent meet this criterion……(Page 17).

In summary, regardless of income, few of these families have enough savings to supplement their income for even one year.  Only 15-20 per cent have enough for five or more years. (Page 17).

…..Many of those who argue that there is no looming pension crisis have included home equity as a liquid asset.  This analysis has not treated home equity as a retirement asset because the replacement rate analysis has as its objective an income that allows one to enjoy a lifestyle comparable to that which existed pre-retirement.  We do not include home equity here because we accept that the pre-retirement lifestyle for many middle- and moderate-income Canadians include continued homeownership, (Page 19).

One Option:  Reducing seniors poverty with GIS

The report then makes suggestions for decreasing poverty rate. One option is reducing seniors poverty with short term changes to GIS.  One of the paragraphs is as follows:

Table 6 presents estimates of the poverty gap using Statistics Canada’s SPSD/M microsimulation model. The poverty gap is the total amount of money that would be needed to raise the incomes of all poor seniors to the LIM poverty line-ignoring any  behavioral impacts of the transfer programs used to achieve that goal…..The poverty gap is $2.5 billion in aggregate, which is due to the 719,000 seniors:  419,000 singles and 250,000 living in an economic family.  The average gap is $2,400 for singles and $5,500 for seniors in a family, (Page 20-21).

Table 7 represents the results of increasing the single and married GIS amounts by the same percentage.  One should keep in mind that there is an incentive for seniors to appear as singles to governments even if they are living as a couple.  This is because the GIS for senior couples is less than twice the amount for singles.  An increase in the GIS for singles only (with no increase for couples) would increase this so-called ‘tax on marriage’ and associated incentives.  This would encourage couples to hide their cohabitation from the authorities for financial reasons, (Page 21).

The notation (# 28) at the bottom of page 21 states:  While legislation treats those cohabiting the same regardless of their marital status, it is easier to deceive the government if you are not married.  (Really???  How is this so when single status needs to reported on income tax returns; lying about marital status is a felony?).

Taking one example (from Table 7) of the tabulated results, a 10.0 increase is estimated to increase the cost of the GIS by $1,628 million to yield a poverty rate of 10.5 per cent and to reduce the number of poor seniors by about 149,000, (Page 22).

The (Federal) Liberal Party’s proposal in the recent election was to increase the GIS by 10 per cent for single seniors.  The SPSD/M simulation suggests that this would cost $700 million and remove about 85,000 single seniors from poverty, with a reduction in the singles poverty rate of 5.7 percentage points.  While a reasonable starting point, clearly much more can be done to reduce the poverty rate, (Page 22).

Conclusions

Poverty rates for seniors have been trending up since 1995.  Rates remain unacceptably high for single seniors-particularly women-and the worsening trends in pension coverage point to further increases in poverty in the future.  The GIS is the most effective federal mechanism in the short term for reducing the poverty rate and the impact of poverty on seniors, and it can be targeted at senior singles who need it the most, (Page 23).

(This blog is of a general nature about financial discrimination of individuals/singles.  It is not intended to provide personal or financial advice.)


COMPANY PERKS BENEFIT FAMILIES MORE THAN SINGLES CAUSING FINANCIAL UNFAIRNESS

SOME COMPANY PERKS BENEFIT FAMILIES MORE THAN SINGLES (SINGLES ARE SUBSIDIZING THESE PROGRAMS)

(These thoughts are purely the blunt, no nonsense personal opinions of the author and are not intended to provide personal or financial advice.)

The Province of Alberta has once again released its Top 70 Employers for 2016.

In addition to the usual maternity, paternity leaves, day-care etc., perks that benefit families more than singles include the following:

  • Academic scholarship program for children of employees who are interested in pursuing post-secondary education, up to $1,000 per child. (This is in addition to federal and provincial education benefit programs).
  • Helps newcomers gain Canadian work experience with short-term internships, offered in partnership with Immigrant Services and Centre for Newcomers. (While it is recognized that this is a good thing for immigrants, this program should be offered equally to Canadians.  Immigrant families are favoured over single immigrants in relocation programs to Canada).
  • Compassionate top-up payments for employees who are called upon to care for a loved one. (The problem with this is often the definition of “loved one”.  It is often very inclusive to only close members of the family).
  • Parent employees with college-bound kids have access to an academic scholarship program, as well as summer, co-op and internship employment programs. (This program is again very inclusive to parent employees).
  • Academic scholarship program to encourage children of employees to pursue post-secondary studies (up to $3,000 per child). (While this employer does offer first perk of long-term development of its employees through tuition subsidies for courses taken at outside institutions (up to $5,000), parent employees get second perk for their children on top of  third perk of federal and provincial education benefit programs for their children).
  • Offers parents-to-be a generous subsidy for in-vitro fertilization (IVF) treatments up to $5,000.

Almost all employers offer some form of compassionate/bereavement programs (and this is a good thing).  However, these are often restricted to  close family members and in-laws.  Families often fail to recognize that they have double benefits as these programs compensate both sides of the family.  Singles tend to use less of these benefits, and therefore, it could be said that they are subsidizing families in this regard.  Singles through their taxes also support the mother/baby hospital care, maternal/paternal leaves and EI (employment insurance) programs for parents.

This blog is of a general nature about financial discrimination of individuals/singles.  It is not intended to provide personal or financial advice.
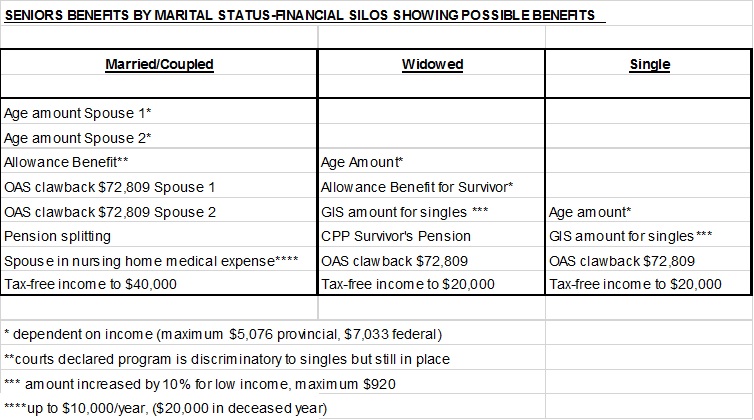
GOVERNMENT CPP BAFFLEGAB MORE IMPORTANT THAN FINANCIAL DISCRIMINATION OF SINGLES AND QUALITY OF LIFE

GOVERNMENT CPP BAFFLEGAB MORE IMPORTANT THAN FINANCIAL DISCRIMINATION AND QUALITY OF LIFE OF CANADIAN SINGLES

These thoughts are purely the blunt, no nonsense personal opinions of the author and are not intended to provide personal or financial advice.

There has been much discussion lately as to whether the CPP (Canada Pension Plan) system should be changed.  The objective of the government is for country to live in a society that takes care of its citizens.  The reality is that some citizens are being taken care of more than others, that is the rich and married/coupled persons while singles and low income are being financially discriminated against.

EXAMPLES OF FINANCIAL DISCRIMINATION

  • TARGETED TAX RELIEF PROGRAMS FOR SENIORS-The Federal Conservative government has a targeted tax relief program where a single senior can now earn $20,360 and a senior couple $40,720 before paying federal income tax.  Program claims that approximately 400,000 seniors (or 7 to 8% of total Canadian seniors) have been removed from the tax rolls altogether.  This so called tax relief for seniors allows federal tax relief for senior singles equal to $1,697 per month and for senior couples $3,393 per month.

The tax relief for senior singles hardly covers a rent or mortgage payment of $1,200 and $250 for food per month (Maslow’s Hierarchy of Need), but amply covers this amount for a senior couple.  For a couple $1200 for rent or mortgage and $500 for food leaves $1693 (or 50% of $40,000) for other necessities and medications and maybe even a nice little vacation all tax free.

It is a well-known fact that singles require more income to that of a married/coupled persons living as a single unit.  In Equivalence scales (Statistics Canada 75F0002M – Section 2 ‘The LIM and proposed Modifications’ (75f0002) (equivalence-scales) if singles are assigned a value of 1.0, then couples require 1.4 times for income, not 2.0. $20,360 times 1.4 equals $28,504 ($2,375 per month) (updated November 18, 2017).  If the federal government cared about income equality and quality of life for senior singles, it would increase the tax free amount for singles.  By not applying equivalence scales to  income for senior singles, they lose $678 a month or approximately $8,000 Lost Dollar Value annually in quality of  life to married/couple retired persons.  (From age 65 to 90, this amounts to $20,000).

When income for senior married/coupled persons is over $40,000 they again get another benefit, that is pension splitting, which singles cannot use increasing quality of life for married/coupled persons over senior singles.  This is a tax benefit piled on top of another tax benefit.

The number of senior ‘ever’ singles (never married, no kids) and divorced/separated persons comprises only about 13 per cent of the population, so how much would it cost to bring the quality of life for these citizens up to the standard of tax relief for married/coupled persons?  The answer is ‘not very much’ in comparison  to what has been given to  married/coupled senior persons.

“Ever” singles are told every day they are worthless and worth less than married/coupled persons even though they have worked 35 – 40 years subsidizing mother/baby hospital care, EI paternal/maternal leave, education taxes even though they have had no children and paid more taxes than families.

  • GOVERNMENTS IGNORE COURT RULINGSRe Allowance Program and Credits, (policyalternatives) 2009 Policy Brief, “A Stronger Foundation-Pension Reform and Old Age Security” by Canadian Centre for Policy Alternatives, page 4, states this program discriminates on basis of marital status as confirmed by case brought under Charter of Rights where federal court agreed program was discriminatory, and ruled it would be too expensive to extend program on basis of income regardless of marital status.’  So what is happening?  Age eligibility for Allowance will change from 60 to 62 beginning in 2023 with full implementation in 2029.  In this democratic, civilized country let’s just ignore federal court rulings and continue a $? million discriminatory program.  Article suggests that ‘OAS (Old Age Security) and GIS (Guaranteed Income Supplement) combined should be increased to at least bring it up to after-tax LICO (Low Income Cut Off) for single individuals.’  And why should married/coupled people get discriminatory marital status benefits where unused credits like Age Credits can be transferred to spouse?

Gross financial discrimination for singles occurs when governments choose to completely ignore court rulings.  Lost Dollar Value to singles:  unable to calculate.

  • PENSION SPLITTINGIt is immoral and ethically irresponsible for governments to deny that pension splitting benefits the wealthy most.  For families who can be exempt from paying 10 – !5 percent income tax on $100,000 and maintain the same income level during retirement as they had during their working years, even though they have less expenses during retirement, is financially discriminating to  singles who cannot pension split.  (This information was revised April 10, 2016 – Lost Dollar Value:  From estimate on income splitting, it has been suggested that income splitting would provide tax relief of $103 for income $30,000 or less and $1,832 for income of $90,000 and over or an average of $794 overall.  If $800 ($794 rounded off) is calculated times 35 years (age 65 to 90), then Lost Dollar Value will equal $28,000.)
  • HOUSING-Financial gurus seem to be leaning towards renting instead of home ownership.  This creates further hardship  for singles and the low income.  If young married/coupled persons are being told that they will probably need to rent because housing prices are out of reach, where does this leave singles and low income persons?  Trend now is towards tiny houses with composting toilets and tanks for storing water, but the rich don’t want to see tiny houses in their backyards.

Try telling singles and low income person that renting is the better alternative when they pay more per square foot and quality of housing is lower than that of houses for families.  If they have problems with not enough income for housing, they are told they should go live with someone.  These people ought to try ‘walking in the shoes’ of singles living in one room or communal situations, where because of low income, they don’t have their own bathroom, and it becomes a ‘dog eat dog’ world where others will, for example, steal food because there is not enough money to buy food. (cprn.org)

The housing market (rental and ownership) is financially completely upside down.  Instead of the rich and middle class paying more for the greatest amount of square footage, they are paying less for the greatest amount of square footage and niceties associated with that.  Singles and low income will be living in hovels, thus violating Maslow’s Hierarchy of Needs principle.

  • IF MONEY IS THERE YOU WILL SPEND IT, IF IT IS NOT, YOU WON’TFinancial studies have come to  conclusions that for people in the lowest income quintile on average have replacement rates of 100 percent, implying their real standard of living actually rises after retirement.  This is such a lie and is totally irrelevant to singles and low income persons.  If there is a poor quality of life before retirement, there still will be a poor quality of life on 100 percent replacement income for singles that does not meet the 1.4 income equivalent (updated November 17, 2017) to that of married/coupled persons living as a single unit.

CONCLUSIONS

Governments, decision makers, some financial advisers to the government. and think tanks are financially illiterate about the financial discrimination of singles.

It seems to be more important for governments to ensure that upper-middle class and upper class maintain their standard of living than it is to treat singles fairly.

Unprecedented growth in value of houses will result in huge tax-free wealth for families and married/coupled persons to the financial detriment of singles and low income.

Marital manna benefits like pension splitting has created a nanny state where married/coupled persons want it all and once these benefits are in place, it is very difficult to get rid of them.  Married/coupled persons have been made irresponsible by their own government.  They are not living a lower life style in their retirement.  A further question is whether these programs will be financially sustainable.

Assumption that retirement income only needs to replaced at 70 percent, for example, does not hold true for both singles and married/coupled persons, because singles require 1.4 income equivalent to married/coupled persons living as a single unit (updated November 17, 2017).  Twenty thousand dollars a year is not an adequate quality of life retirement income for Canadian senior singles.

GOVERNMENTS NEED TO ADDRESS FINANCIAL EQUALITY FIRST FOR ALL CANADIAN CITIZENS REGARDLESS OF MARITAL STATUS, THEN TWEAK CPP.

This blog is of a general nature about financial discrimination of individuals/singles.  It is not intended to provide personal or financial advice.