DOING THE MATH ON FAMILY TAX CREDITS SHOW FINANCIAL DISCRIMINATION OF POOR, LOWER MIDDLE CLASS FAMILIES AND SINGLES-Part 1 of 2

DOING THE MATH ON FAMILY TAX CREDITS SHOW FINANCIAL DISCRIMINATION OF POOR, LOWER MIDDLE CLASS FAMILIES AND SINGLES-Part 1 of 2

(These thoughts are purely the blunt, no nonsense personal opinions of the author about financial fairness and discrimination and are not intended to provide personal or financial advice.)

The Canada Child Benefit (CCB) consists of tax-free monthly payments that began in July, 2016 and provide maximum annual benefit of up to $6,400 per child under the age of six, and up to $5,400 per child ages six through seventeen.  This benefit is income-tested (but not net worth and assets tested), such that the amount depends not only on the family income, but also on the number of children and their ages.  (These amounts start being reduced when the adjusted family net income (AFNI) is over $30,000 and also is dependent on number of children in the family.  On the portion of adjusted family net income between $30,000 and $65,000, the benefit will be phased out at a rate of 7 per cent for a one-child family, 13.5 per cent for a two-child family, 19 per cent for a three-child family and 23 per cent for larger families. Where adjusted family net income exceeds $65,000, remaining benefits will be phased out at rates of $2,450 and 3.2 per cent for one-child family,  $4,725 and 5.7 per cent for two-child family, $6,650 and 8 per cent for three-child family and $8,050 and 9.5 per cent for larger families on the portion of income above $65,000).

The following scenarios from “Doing the child benefit math” by Jamie Golombek (financialpost), Financial Post September 30, 2016 shows financial evaluation performed by Jay Goodis from Tax Templates Inc.  This evaluation shows the impact of CCB on various levels of income in 2016, the after-tax cash they would keep along with their effective tax rates.

Scenario 1 – Low-income family

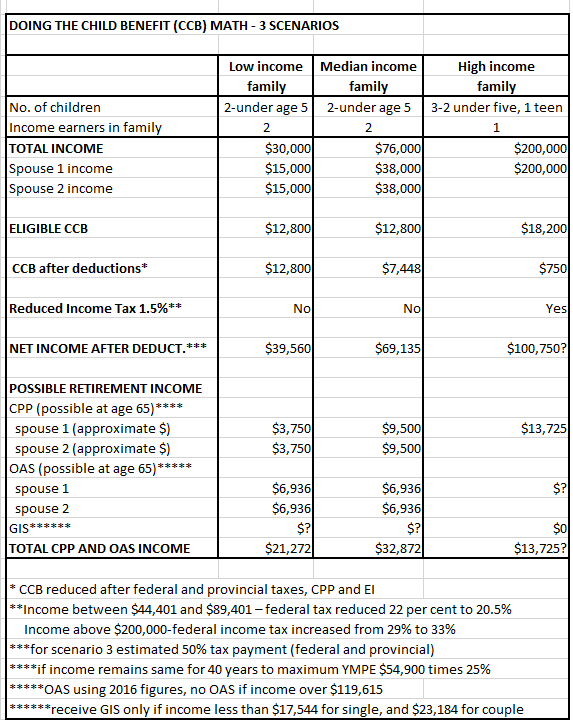
A Manitoba family has two kids under five and two working parents, each earning $15,000 of employment income. They are eligible for the entire CCB of $12,800; after paying CPP, EI, and a bit of tax, they net $39,560 of cash.

What would happen if one parent was able to work more, or was to get a higher paying job, such that she now made $25,000 — an increase of $10,000?  While she’s still in the lowest federal and Manitoba tax brackets, once you factor in the loss of CCB, the additional tax, CPP, and EI, her take-home extra cash is only $5,563, resulting in an effective marginal tax rate of a whopping 44 per cent (39 per cent if you ignore the additional CPP and EI contributions.)

As Goodis observed: “The CCB skews the progressive tax system and imposes a high effective tax on low income earners with children.”

Scenario 2 – Median-income family

A British Columbia couple has two children under the age of five. Their family’s income, consisting solely of employment income, is $76,000 split equally between each spouse. Their $12,800 of CCB is reduced to $7,448; and after federal and provincial taxes, CPP, and EI, the family nets $69,135 of cash. In other words, even with the clawback of some of their CCB, the couple has kept 91 per cent of their earned income.

Scenario 3 – High-income earner

Finally, consider an Ontario professional with three kids, two under five and one teen, earning $200,000 annually.  His CCB will be about $750 for the year.  If he were to earn an extra $1,000 of income, he would keep only just under $400 of it, resulting in an effective marginal tax rate of just over 60 per cent once the loss of the CCB is taken into account. (His status is not stated, assume he is a single parent?)

child-benefit-math-3-scenarios

ANALYSIS

With a fuller analysis of the information the following assumptions can be made:

  1. Minimum wage-most minimum wages in provinces range between $10 and $11 per hour, so it is hard to imagine that family in scenario 1 (low-income family) only makes combined income of $30,000.  At 2,000 annual hours of work per year per person, each person’s hourly rate only equals $7.50.  One must assume they are working part time jobs and are unable to find full time work.  Net income after deductions and with CCB of $39,560 still equals net hourly wage of only about $10 per person.   (The other possibility is that this family is wealthy by having huge net worth and assets that are not considered in the CCB and, therefore, do not need to work at full time jobs). For scenario 2 (medium-income family) the net wage after deductions and with CCB earned per hour equals about $17 per person.  For scenario 3 (high-income earner) and assumed 50% tax plus $750 CCB on $200,000 the net wage earned per hour equals about $50 per person.
  2. Income tax reductions-in scenario 1 (low-income family) get none of the 1.5% Liberal tax reduction because each of their incomes do not fall in the $44,401 and $89,401 range.  The same applies to scenario 2 (medium-income family).  Scenario 3 (high-income earner) gets the 1.5% tax deduction for income between $44,401 and $89,401.  Only upper middle-class families with individual spouse’s income over $44,401 to $89,401 would quality for income tax reductions in these scenarios.
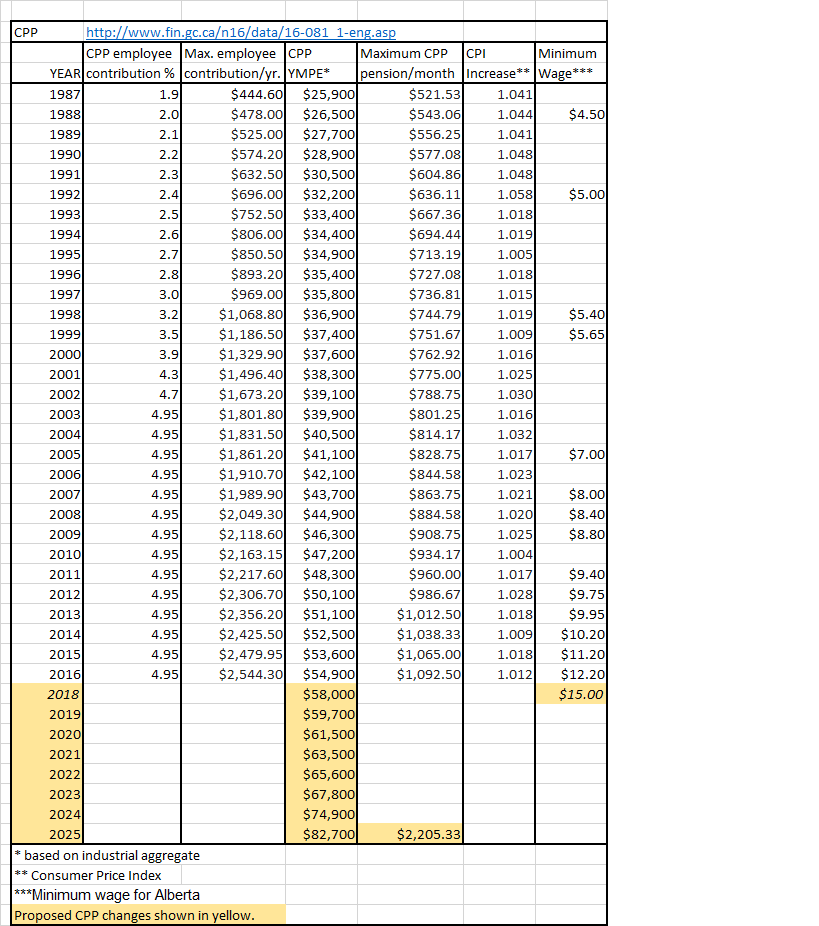
  3. Canada Pension Plan (CPP)-both scenario 1 and 2 families will not receive maximum CPP retirement benefits because their individual incomes fall below the 2016 YMPE $54,900 individual income level.  In scenario 3 (high-income earner), he will earn full CPP benefits.  (Fact:  Canada Child benefit tax-free income will not require CPP contributions, so income excluding CCB was used for calculation of CPP retirement benefits.
  4. Canada Child Benefit (CCB)-For scenario 1 (low-income family) this family receives full Canada Child Benefits.  For scenario 2 (medium-income family) reduction is $4,275 and 5.7% for $76,000 income for total $5,352 CCB reduction. Reduction for scenario 3 (high-income earner) is $18,200 minus $6,650 and 8% for $200,000 income which equals total $17,450 CCB reduction.
  5. Understanding other calculations-For scenario 1 (low-income family) it is stated that an additional $10,000 in income would ‘produce take-home extra cash of only $5,563, resulting in an effective marginal tax rate (tax rate paid on last dollar of income and rate likely to be paid on next dollar of income-it is usually more than what is actually paid because basic exemptions, etc. have not been taken into consideration) of a whopping 44 per cent’. (Fifteen percent federal income tax on $10,000 equals $1,500, about 12% Manitoba provincial tax equals $1,200 and 13.5% Canada Child Benefit reduction on $10,000 equals $1,350 for a total of $4,050 not including additional CPP and EI payments).In scenario 3 (high-income earner, ?single parent) it is stated that with only an additional $1,000 income he would keep just under $400 of it, resulting in an effective marginal tax rate of just over 60 per cent once the loss of the CCB is taken into account.  When one takes into account that he is possibly taking home over $8,000 per month, it is likely that he will be able to max out his RRSP and TFSA accounts and will have maximum CPP benefits on retirement at age 65 if he works 40 years as well as RRSP and TFSA accounts to supplement his retirement income).
  6. Under-reporting of actual benefits received-Marginal tax rate-Since Canada operates on tax brackets, taxpayer will pay more tax when more is earned. However, it’s worth noting that tax rate paid is based on the income in each bracket. So the marginal tax rate doesn’t reflect the total that is paid on income. In fact, what taxpayer actually ends up paying, in terms of a percentage of income, is probably going to be lower than the marginal tax rate.  It should be noted that further possible provincial child assistance and family employment, GST rebate benefits and basic exemptions are not included in these examples.  Therefore, each scenario likely has more benefits than have been described in the examples.

CONCLUSION

As stated above by the financial analyst, statement is repeated here again:   “The CCB skews the progressive tax system and imposes a high effective (marginal used in these examples) tax on low income earners with children.”  Unfortunately, they create financial silos by including only one benefit without taking into consideration of the effect of other benefits.  In this post, attempt was made to include Liberal income tax deductions and possible retirement benefits to provide a better ‘across the board’ analysis of how upper-middle class families and wealthy benefit most.

While many families may view the CCB to be a wonderful program, boutique tax credits when taken into consideration with other programs can be shown to be less financially beneficial to low income and middle income families, especially with a stagnant minimum wage.  A stagnant minimum wage (minimum-wage) with a Canada Child Benefit may provide a better income for low income families for twenty or twenty five years during child-rearing, but will result in lower Canada Pension Plan benefits for seniors during their twenty years as seniors.  A higher minimum wage during child-rearing years will result in a higher income during child-rearing years, lower CCB along with higher CPP during senior years.  It is in the eye of the beholder and financial analysts to determine which is the better scenario.  A higher minimum wage appears to be the better scenario.

Another negative thing that can be said about the Canada Child Benefit program is that reductions of the benefit appear to decrease slightly with the addition of each child (resulting in a little more CCB being paid out with addition of each child).  This progression in CCB reductions appear to not follow equivalence scales (finances) where it is shown that cost of living per family does not increase times each additional child, but rather decreases per addition of each child.  (Example: cost of living square root equivalence scale one adult 1.0, two adults 1.4, two adults one child 1.7, two adults two children 2.0, two adults three children 2.2).  In scenario 2 (medium-income family) CCB benefit would be $3,598 for 1 child under 5, $7,448 for 2 children under five and $11,670 for three children under 5.  So, in fact scenario 2 family with three children would receive $292 more per child than family with one child even though equivalence scales show the cost of living per child is less for three children than it is for one child.

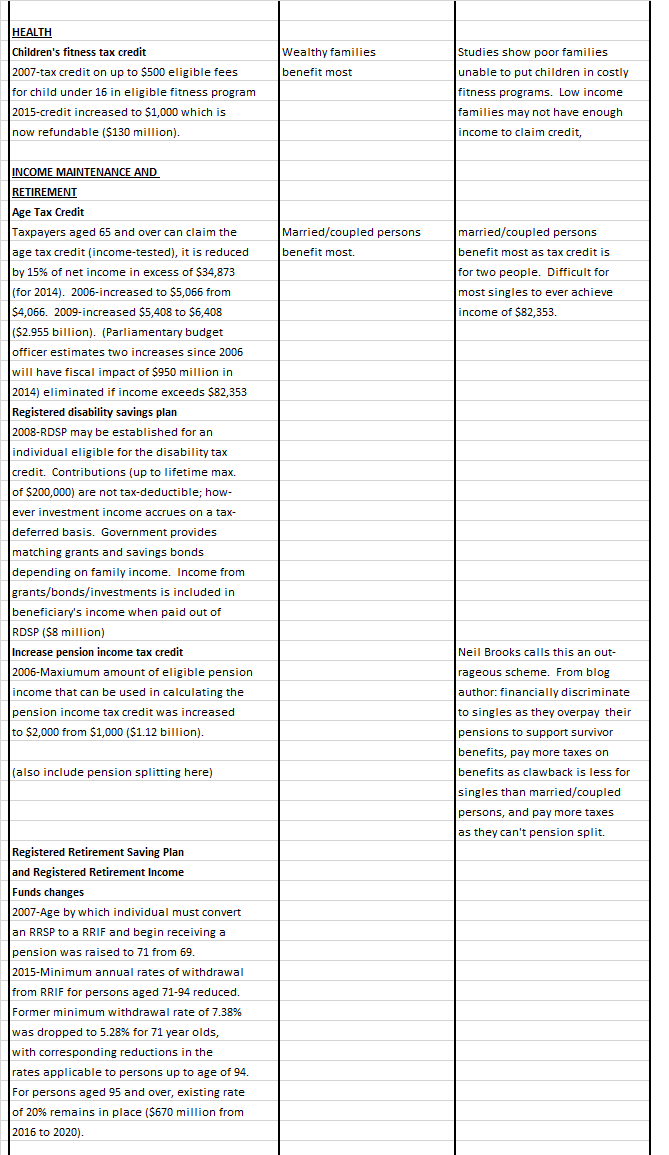
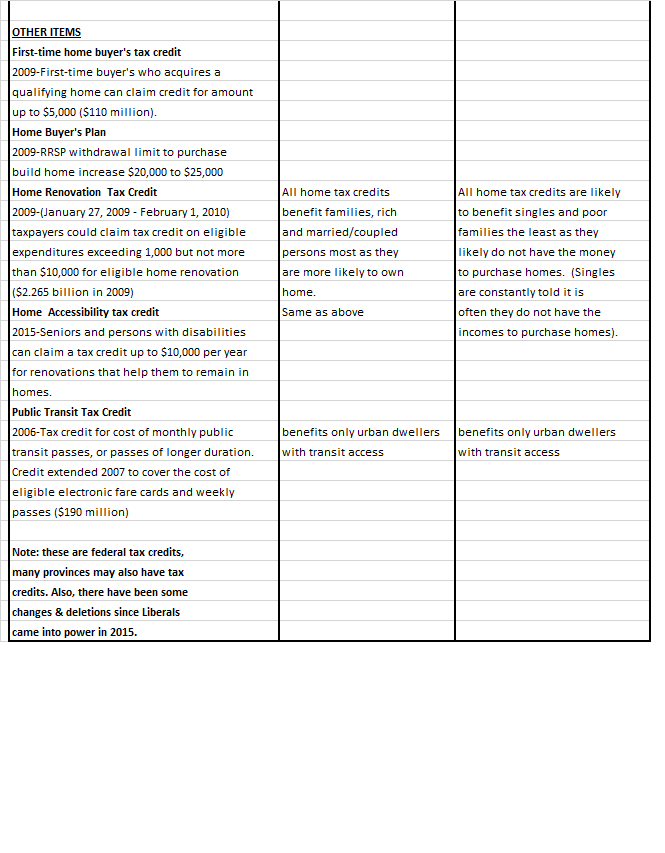
As has been stated in past blog posts, both the Liberal and Conservative parties, while handing out marital manna benefits and family benefits, have at the same time handed out benefits that favor upper-middle class families and wealthy the most. (Singles get none of these family credits and are unable to purchase homes and max out RRSP and TFSA accounts unless they have substantial incomes.) Some of these benefits include Liberal income tax reductions, maximum CPP benefits and exclusion of net worth and assets testing while failing to increase the minimum wage to an indexed living wage.  Politicians and governments continue to financially discriminate against singles and the poor while allowing the upper-middle class and wealthy to increase their wealth.

(This blog is of a general nature about financial discrimination of individuals/singles.  It is not intended to provide personal or financial advice.)

STAGNANT MINIMUM WAGE AND LOW INCOME IMPACT ON CPP ENHANCEMENTS

STAGNANT MINIMUM WAGE AND LOW INCOME IMPACT ON CPP ENHANCEMENTS

(These thoughts are purely the blunt, no nonsense personal opinions of the author about financial fairness and discrimination and are not intended to provide personal or financial advice.)

Occasionally there are events or things in life that will ‘rock you to your core’, ‘knock your socks off’, or ‘set you back on your heels’.  On writing for this blog, one of these things or events is the minimum wage or low income and what an impact this has on financial lives of the poor and low income regards to proposed CPP enhancements.

From Department of Finance, “Background on Agreement in Principle on Canada Pension Plan Enhancement” (fin.gc) for proposed enhancement of CPP states the following:

‘Today, middle class Canadians are working harder than ever, but many are worried that they won’t have put away enough for their retirement.  Each year, fewer and fewer Canadians have workplace pensions to fall back on.  To address this, we made a commitment to Canadians to strengthen the Canada Pension Plan (CPP) in order to help them to achieve their goal of a strong, secure and stable retirement……

There will be gradual 7-year phase-in below the Yearly Maximum Pensionable Earnings (YMPE), followed by a 2-year phase-in of the upper earnings limit….

The maximum amount of earnings subject to CPP (from 2023 to 2025) will be increased by 14%.  The upper earnings limit will be targeted at $82,700 upon full implementation in 2025…..

In 2023, the CPP contribution rate is estimated to be 1% higher for both employers and employees on earnings up to the YMPE.  Beginning in 2024, a separate contribution rate (expected to be 4% each for employers and employees) will be implemented for earnings above the then prevailing YMPE.

All working Canadians will benefit from an enhancement of the CPP. This enhancement will increase income replacement from one-quarter (25%)  to one-third (33%) of pensionable earnings.

As the CPP enhancement will be fully funded, each year of contributing to the enhanced CPP will allow workers to accrue partial additional benefits. In general, full enhanced CPP benefits will be available after about 40 years of making contributions. Partial benefits will be available sooner and will be based on years of contributions.’

The following information regarding the middle class has been taken from (theglobeandmail):

A 2013 internal government document, entitled “What We Know about the Middle Class in Canada,” draws the lines more precisely, deeming the middle class as those whose after-tax income falls between 75 per cent and 150 per cent of the national median – which, using 2012 figures, would include any family taking home $54,150 to $108,300 a year.  “Family,” however, is a catch-all demographic that includes couples of all ages, with or without children, single or double-earners, and single parents. Single people are excluded entirely – one of the fastest growing groups in Canada and a big chunk of the middle class – whose income, using the same government calculation above, would fall between $21,150 and $42,300…..This is one reason why so many millionaires (44 per cent of those who responded to a recent survey by CNBC) outrageously define themselves as middle class when, in fact, once your personal income closes in on $200,000, you leap into the top 1 per cent of earners in Canada….(and top twenty per cent have salaries over $116,000).

Average income (before taxes and transfers) by quintile, all family types, 2013

  • Lowest: Up to $13,000
  • Second: $13,100-$37,000
  • Middle: $37,000-$66,500
  • Fourth: $66,500-$111,600
  • Highest: $111,600 and up

Source, Income Statistics Division, Statistics Canada

What the numbers say: Income levels have fluctuated over the last four decades, with lasting growth concentrated among the wealthiest. In 2011, the incomes of the bottom three quintiles were still lower than in 1976, adjusting for inflation. The top 40 per cent had jumped ahead, with the largest gains made by the top 20 per cent. Compared with 1976, they were the only Canadian households who saw their share of income rise….

What the numbers say: Between 1999 and 2012, the median net worth of Canadian families rose nearly 78 per cent, from $137,200 to $243,800. Most of this wealth is concentrated in housing, especially for lower-income groups. This new wealth wasn’t evenly distributed, however. Gains were higher, the wealthier the family. While median net worth grew by 107 per cent for the richest families, for the bottom 20 per cent it rose just 14.5 per cent. Within the middle class, richer Canadians also did better – the upper middle income saw their worth grow by 90 per cent; the lower middle income by 60 per cent…..

Baby boomers are working longer than expected, debts are rising, and grandma’s housing bonanza is pricing her grandchildren out of the real-estate market, especially in big cities where the best jobs are increasingly concentrated. Paul Kershaw, who studies generational equity at the University of British Columbia’s School of Population and Public Health, has calculated that Canadians in their late 20s and early 30s will have to save, on average, five years longer to produce a down payment, and work one month a year more than their peers in 1976 to cover their mortgage. And according to a June report from the Canadian Centre for Policy Alternatives, thirty-somethings are the only age group with a lower overall net worth in 2012 than they had in 1999…..’

READER COMMENT on above article:

‘This is the reality of Canadians in their twenties and thirties.  They are buffeted on the one hand by a regressive Service Sector (Service Sector-more than fast food outlets- includes banking, insurance, and information technology) senior management style reminiscent of pre industrial revolution feudal management and owners who believe that the 15% federal tax is excessive and should be demolished.  On the other hand these all important Canadians under forty years are hopelessly burdened by the same senior management who are responsible for policy that has created unmanageable long term student debt, unconscionable large mortgages with no long term rate matching to amortization and no defined benefit pension plans….the existing Bank Act and Insurance Act as well as Competition Law provides ample power for an enlightened government to bring fairness to our most important asset – Canadians under forty years old’.

MoneySense (middle-class)data based on Stats.Can. 2011 figures – Middle 20% pre-tax income for unattached individuals is $23,357 to $36,859 and for families of two or more $61,929 to $88,074.

In 2013, Stats.Can. data shows median after-tax income for unattached singles over 65 to be $25,700 and under 65 to be $29,800.  For female lone parent families $39,400, for two parent families with children $85,000 and senior families $52,500.

Living Wage Dollars (politicians) (a basic wage that keeps poor working Canadians off the streets) for 2013 Guelph, Wellington and 2012 Grande Prairie range from $19,284 to $25,380 for unattached singles and $56,796 to $62,844 for two parent, two children family unit.  Living Wage for Guelph/Wellington for 2015 has been set at $16.50 for family unit of two parents and two children. The City of Vancouver employee living wage for 2016 is $20.64.  The calculated living wage for Toronto family unit of four for 2015 is $18.52.

Minimum wage in 2015 (minimum) in provinces looked like this – British Columbia $10.25, Alberta $10.20 ($11.20 in Oct. 2015), Saskatchewan $10.20, Manitoba $10.70, Ontario $11.00, Quebec $10.35, New Brunswick $10.30, Nova Scotia $10.60, Prince Edward Island, $10.35, Newfoundland $10.25, Yukon $10.72, Northwest Territories $10.00, Nunavut $11.00.  For 2016, provincial minimum wage ranges from $10.65 to $13.00.  Very few provinces index minimum wage to inflation.  The Alberta NDP party who came into power in 2014 promises to raise minimum wage to $15 by 2018.

The following table shows CPP contribution and benefit rates from 1987 to 2025.  Future proposed rates are shown in yellow.  It is interesting to note that the maximum CPP pension payout does not equal 25% of the YMPE.  Rather it seems to average around 24%.  Where did the remaining dollars go – perhaps for administrative costs?  Payout for 2025 has been calculated at 32% rather than 33%.

cpp-enhancements

ANALYSIS

  1. Minimum wage or living wage in relation to CPP enhancement – A minimum wage averaging between $10.00 and $11.00 in Canada or approximately $20,000 and $22,000 annual wage for 2,000 worked hours per year means these employees working for forty years will receive virtually nothing in CPP payments in comparison to those employees whose maximum CPP YMPE will be $82,700.  If the estimated amount of CPP after forty years of contribution for $82,700 maximum YMPE will equal about $2,000 per month, then the CPP benefit for $20,000 annual salary could be estimated to be 25% or $500 per month.  Even with a living wage of $20.00 per hour or $40,000 annual salary for 2,000 worked hours will possibly only equal 50% or $1,000 (equivalent to rent or mortgage) CPP benefit per month.  Just what incentive is there for the poor and low income to work when the YMPE will rise to a level that is higher than the middle quintile income of  $37,000-$66,500 and when one of the criteria is working for forty years?  While it is understood that incomes will likely rise over the next forty years, past history has shown that it will repeat itself by not increasing the minimum wage to a living wage equally in proportion to CPP contributions and benefits.  Ever singles and early divorced singles without children deserve better when they  have worked for forty years, never used EI, never used family benefits like maternity or parental benefits, child rearing dropout credits, child benefits and widowed person benefits along with all the marital manna benefits (pension splitting). Question to be answered:  Will the minimum wage along with OAS and GIS rise to same level that CPP YMPE will rise and will they be indexed to same level (33% would be nice) so that CPP, OAS and GIS benefits for the poor and low income will be at least a living wage level throughout their senior lives?
  1.  Upper-middle class will benefit the most while the poor and low income Canadians have been left out of the formula – Politicians and governments continue to coddle the middle class and especially the upper-middle class (so stated by financial government officials themselves in above article “middle class Canadians are working harder than ever”).  The Canadians who will benefit the most from the proposed CPP YMPE are the top two quintiles earning $82,000 and up per year (fourth quintile $66,500-$111,600 average income for all family types as shown in above statistics).  As the CPP YMPE rises at a level that is exponentially higher than the average income level of the middle class, so will the CPP payouts rise at a level that is exponentially higher for the upper middle class.  In the table shown above, the yearly YMPE has risen at a relatively steady rate for each year.  Examples:  The YMPE rose $600 for years 2000 to 2001, $1,200 for 2015 to 2016 and proposed $1,100 for 2022 to 2023.  The YMPE will take a dramatic jump of $7,100 ($67,800 to $74,899) for 2023 to 2024 and $7,800 ($74,900 to $82,700) for 2024 to 2025.  The YMPE, which used to be more ‘middle of the road’ middle class, will now rise to upper middle class levels just like all other defined benefit plans in this country, the higher the salary-the higher the benefit.   (Widowed persons of higher income deceased spouses also benefit more from these plans, but have not made contributions equal to the pension payouts, even though as widowed persons they are now technically single).  It almost certainly can be guaranteed that annual incomes will not increase by that amount for any of the lower income groups and especially for the poor and low income groups.  Pension plans in this country have been made schizophrenic and financially upside-down when they are controlled by the federal government, but minimum wages are controlled by the provinces, while ensuring the wealthy will get wealthier and the poor will remain poor.
  1.  Four things that need to happen to eliminate financial discrimination of CPP enhancements – What is the incentive for ever singles, early divorced singles and poor families to work when government, politicians and businesses purposely implement financial policies that work against them?? Four things need to happen – one. raise minimum wage to a living wage with indexing; two, exponentially increase indexing of OAS and GIS to same level of $82,700 CPP YMPE; three, eliminate marital manna benefits that privilege high income families such as pension splitting and revise programs such as OAS recovery tax so they truly do progressively eliminate OAS according to income for the upper-middle class; and four, review all retirement benefits and retirement programs in totality and with each other (both on federal and provincial level) to prevent creation of financial silos that privilege the wealthy few.

SOLUTION

In addition to the above four items, how about adding six years of CPP benefits to total years worked for singles (ever singles and early divorced singles, excluding widowers), equivalent to child rearing dropout credits? (Added Sept. 26, 2016 but then, singles already work forty years so that idea won’t work.  So how about applying the equivalence scale of 1.4 to the CPP benefits that singles have earned while working)?  It is a known fact that it costs unattached singles more to live (senior-singles-pay-more) than married or coupled family units.  The Canada Revenue Agency knows who singles are as they have indicate themselves as such on their income tax submissions.  Now, wouldn’t that be a novel idea to eliminate financial discrimination and promote financial fairness for singles?

(This blog is of a general nature about financial discrimination of individuals/singles.  It is not intended to provide personal or financial advice.)

CANADA PENSION PLAN JUST ANOTHER GOVERNMENT PROGRAM PROMOTING FINANCIAL DISCRIMINATION OF SINGLES AND THE POOR

CANADA PENSION PLAN JUST ANOTHER GOVERNMENT PROGRAM PROMOTING FINANCIAL DISCRIMINATION OF SINGLES AND THE POOR

(These thoughts are purely the blunt, no nonsense personal opinions of the author about financial fairness and discrimination and are not intended to provide personal or financial advice).

(singles-need-to-learn-how-to-articulate-financial-discrimination-of-singles)

Our last post discussed the financial discrimination of Old Age Security (OAS).  This post discusses the financial discrimination of the Canada Pension Plan (CPP).

CPP is part of the Pillar 2 plan of Canada’s retirement income system for seniors.  Some of the attributes of the plan are:

  • Federal government and Provinces are joint stewards of the CPP
  • Provides retirement, survivor, and disability benefits
  • Universal coverage of all workers in all industries
  • Employees and employers make equal contributions (4.95% each – 9.9% combined in 2015?) on earnings up to annual maximum of $54,900 (2016)
  • Defined Benefit – up to 25% of the average wage
  • Fully portable
  • Inflation-indexed to CPI
  • Actuarially sound for the next 75 years
  • The maximum CPP benefit for 2016 is $1,092.50 per month.

Unfortunately, most Canadians do not realize that the average Canadian will not receive the maximum CPP on retirement.  In fact, most will only receive about $643 per month of CPP maximum.  Why is this so?

Jim Yiu from ‘Retire Happy’ in his article “How much will you get from Canada Pension Plan in Retirement?” states (words in italics are my words):  

‘When planning for retirement, the first piece of advice given is not to plan on getting the maximum.  When you look at the average payout of CPP, it’s just a little over $643 per month in 2016, which is a long way from the maximum. In other words, not everyone gets the maximum. At the most basic level, the amount you get from CPP depends on how much you put into CPP.

Why is it that so many people do not qualify for the maximum amount of CPP? The best way to answer that is to look at how you get the maximum retirement benefit. Eligibility to receive the maximum CPP benefit is based on meeting two criteria:

  1. Contributions – The first criteria is you must contribute into CPP for at least 83% of the time that you are eligible to contribute. Essentially, you are eligible to contribute to CPP from the age of 18 to 65, which is 47 years. 83% of 47 years is 39 years. Thus, the way to look at CPP is on a 39-point system. If you did not contribute into CPP for at least 39 years between the ages of 18 to 65, then you won’t get the maximum. If so, then you might get the maximum but there is another consideration.
  2. Amount of contributions – Every year you work and contribute to CPP between the age of 18 and 65, you add to your benefit. To qualify for the maximum, you must not only contribute to CPP for 39 years but you must also contribute ‘enough’ in each of those years. CPP uses something called the Yearly Maximum Pensionable Earnings (YMPE) to determine whether you contributed enough. (For 2016 the YMPE is $54,900 – EQUIVALENT TO ABOUT $25 PER HOUR).

Basically if you make less than $53,600 of income in 2015 ($54,900 in 2016), you will not contribute enough to CPP to qualify for a point on the 39-point system…..As you can see, it’s not easy to qualify for full CPP especially with the trend of people entering into the workplace later because of education and people retiring earlier.  If you have 39 maximum years of contribution you’ll get the maximum CPP amount. If you have 20 maximum years of contributions you will get approximately half the maximum (you might get some partial credits for part years).

Planning your retirement needs and income requires some understanding of how much you will get from CPP. Many people either assume they will get the maximum or assume they will get nothing at all because they fear the benefit may not be there in the future. Both these assumptions have significant flaws. Take the time to personalize the planning by understanding how the CPP benefit is calculated and how much you will receive.’

ANALYSIS

Reasons why CPP is financially discriminatory to singles with low/moderate incomes and the poor:

    1. The YMPE 2016 salary to get maximum CPP benefits is $54,900 (up $1,300 from last year).  If average annual hours of work equals 2,200 hours then YMPE salary will be approximately $25 per hour.  Many singles and the poor do not have $25/hr. jobs.  In addition politicians, government, and businesses generally refuse to increase the minimum wage or ensure a living wage for all Canadians. If the YMPE is increased by $1,300, why aren’t the wages increased by the same amount for the poor so they can also contribute more to CPP?  Even those persons who work faithfully at full time jobs for forty years, but don’t have $25 per hour jobs will not receive full CPP benefits.  (Is this really what they deserve after working faithfully for their country for forty years)?  So who benefits most from CPP?  It is the middle class and wealthy who have at least $25/hr. jobs and, therefore, are able to get full  CPP benefits.
    2. Early retirement – who gets to retire early?  It is generally the upper middle class and wealthy married or coupled family units because of the marital manna benefits they receive, high incomes and the net worth they have.   In reality many of these families really do not need full CPP benefits.  From personal experience of this blog author, some married or coupled spouses will say both spouses do not need to work when really both spouses should be working or because of their high income only need one spouse working.  (To get full  CPP benefits each Canadian born citizen needs to contribute into CPP for at least 39 years between the ages of 18 to 65.   And, Canadians must not only contribute to CPP for 39 years but they must also contribute ‘enough’ to maximum of YMPE in each of these years).
    3. Marital manna benefits – Married or coupled family units have received many marital manna benefits that allows them to achieve more wealth than many singles and the poor.  One such example is the Child Rearing Drop-out Benefit.  CPP benefits may be increased for years that spouse did not generate income because of staying home to rear child from ages 1 to 6.  This is not necessarily a bad thing in and of itself, but those who are more likely to be able to stay home for child rearing are those with healthy incomes.
    4. Perception of financial  need –  Many politicians, governments, and financial planners have misconceived perceptions that financial goals should be for Canadians to have equal or higher pension income than while working.  In other words, if poor, it is okay to always be poor even in retirement.  For middle class or wealthy they say the goal should be equal or more pension income than working income even with high net worth and assets.  In reality, institutions like the OECD states less wealthy need 100% retirement income  of working income, while wealthy need retirement incomes that are much less of working income.  What is left out of these perceptions is quality of life.  Equal or higher pension income than income while working for singles with low/moderate incomes and the poor especially if paying rent or mortgage in retirement often does not equal a good quality of life.
    5. Proposed enhancements to CPP contributions and benefits – Proposed enhancements where CPP retirement pensions will be higher if taken after age 65 and./or will be higher if person works past age 65 are very good things. However, it is likely that singles and the poor are not the ones who will be able to postpone receiving their CPP benefits, and it is also more likely that singles and the poor are the ones who will need to work longer.  As for increasing CPP contributions now so that CPP benefits can be increased in the future, this generally is a good thing; however, the stress of having to contribute more will be more financially distressing for singles with low and moderate incomes and the poor rather than the middle class and the wealthy.

CONCLUSION

It seems to be more important for politicians and governments to ensure that upper-middle class and wealthy maintain their standard of living than it is to treat ever singles, early divorced singles, single parents and the poor fairly in benefits they receive (cpp).

Upside-down financial systems (upside-down) and marital manna benefits have created a nanny state where married/coupled persons want it all and once these benefits are in place, it is very difficult to eliminate them because of voter entitlement.  Upper middle class and wealthy married/coupled persons have been made irresponsible by their own politicians and government.  Many are not living an equal life style in their retirement, but a much better lifestyle.  A further question is whether these programs will be financially sustainable because upper class and wealthy married or coupled family units have not contributed enough to pay for these benefits.

Much is required of all family units regardless of marital status to educate themselves on what their actual retirement income will be.  If you don’t work, you won’t get CPP.   You won’t get CPP if you don’t work.  You won’t get CPP if you don’t make CPP contributions, for example, working ‘under the table’.  (And, wouldn’t it be nice for parents to pass this financial information onto their children so that their children will also make wise financial decisions)!  Much is required of financial planners to educate themselves on quality of life issues, not just equal or higher pension incomes.  Much is required of politicians and governments to educate themselves on how financially discriminatory many of the pension benefits are and to make changes so that there is financial equality and fairness in distribution of pension benefits for every Canadian,not just middle class married or coupled family units and the wealthy.

(This blog is of a general nature about financial discrimination of individuals/singles.  It is not intended to provide personal or financial advice).

OAS CLAWBACK OUTRAGEOUSLY BENEFICIAL TO UPPER MIDDLE-CLASS MARRIED OR COUPLED SENIORS, BUT FINANCIALLY DISCRIMINATORY TO SINGLES AND POOR

OAS CLAWBACK OUTRAGEOUSLY BENEFICIAL TO UPPER MIDDLE-CLASS MARRIED OR COUPLED SENIORS, BUT FINANCIALLY DISCRIMINATORY TO SINGLES AND POOR

(These thoughts are purely the blunt, no nonsense personal opinions of the author about financial fairness and discrimination and are not intended to provide personal or financial advice).

(six-reasons-why-married-coupled-persons-are-able-to-achieve-more-financial-power-wealth)

Occasionally, there are topics that give one pause resulting in questioning as to the efficacy of the  formulation behind the topic.  The OAS Clawback (proper name is OAS Recovery tax as per Canada Revenue Agency) and the financial discriminatory properties behind the program is one such topic.  One way to resolve the questioning is to look at the topic in detail.

OAS is a federal social program designed to provide a very modest pension to low- and middle-income retirees.  It is part of the universal government benefits for seniors (pillar 1) to ensure income security for senior Canadians.  In 2016 the OAS maximum amount is $6,680 for a single person and $13,760 for a couple. OAS clawback which began around 2011 does very little to clawback the income of upper middle class persons, particularly married or coupled family units.  The clawback of OAS benefits in 2016 starts with a net income per person of $72,809 (couple $145,618)  and completely eliminates OAS with income of $118,055 (couple $236,110).  The repayment calculation is based on the difference between personal income and the threshold amount for the year. The repayment of OAS is 15 percent of that amount.  All OAS is clawed back if personal income is over $118,055.

According to Human Resource Development Canada, only about five percent of seniors receive reduced OAS pensions, and only two percent lose the entire amount.  This program benefits wealthy couples and widowers the most.  OAS clawback for couple only begins at net income of $145,618 ($72,809 per person) thus allowing them to receive full OAS of $13,760 as a couple.  There are not many ever single seniors, early divorced in life seniors and single parent seniors who could hope to achieve a net income of $72,809; however, for wealthy widowers this may be easier to achieve and they are the ones who complain about clawback.

An example of OAS clawback is the following example:  

The threshold for 2015 is $72,809.  If your income in 2015 was $80,000, then your repayment would be 15 percent of the difference between $80,000 and $72,809:

$80,000 – $72,809 = $7,191

$7,191 x 0.15 = $1,078.65

You would have to repay $1,078.65 for the July 2016 – June 2017 period.

Many financial advisors will give strategies on how to avoid the clawback while benefitting married or coupled family units the most.  This is just another example of financial marital manna benefits and manipulation of assets that within the legal limits of Canada Revenue Agency’s laws allows married or coupled person to increase their wealth (manipulation-of-assets).  This also is just another example of the upside finances perpetuated in this country by politicians, government and businesses that benefit married or coupled persons the most (quality-of-life).

From a financial advisor comes this statement (claw-back):  “I also want to put the impact of the claw back into perspective. Although no one likes to give up $6,600 in free money, it’s not like you were going to get to keep it all anyway. As the OAS is taxable, most people in the claw back zone would have paid back over 30% of it in taxes.

Secondly, some clients look at paying claw back as the cost of doing business; while they may not love it, they look at it as a price of their own financial success and as money they really don’t need anyway. Moreover, they might correctly see that in some cases combatting the claw back isn’t worth the effort. For example, although the rest of the article will focus on how dividends are often bad news for retirees trying to avoid the claw back, these same people might also be reluctant to modify their investments to produce other types of investment returns, especially if that means unnecessarily courting more investment risk or triggering a big capital gain in order to rebalance their portfolios”.

Limiting OAS Clawback

There are a few strategies you can implement to reduce clawback amounts (strategies):

  1. Split your pension with your spouse. If your spouse has a lower income, you can transfer up to 50 percent to your spouse, which should reduce your overall income. This could also include a Registered Retirement Income Fund and annuity income.
  2. Dip into your Registered Retirement Savings Plan before you turn 65. An RRSP is only a tax deferral, meaning that at some point, you’ll have to pay those taxes. Consider taking funds out before reaching the age of 65 so you do not lose the OAS.
  3. Use your tax-free savings accounts to generate investment income, which is non-taxable and would not count towards your net income.
  4. Interest on funds borrowed to earn investment income can be deducted and could reduce your net income.
  5. Watch for capital gains. If you are planning a sale of an asset that could trigger large capital gains, consider selling it before you turn 65.

From another financial planner (minimizing-clawback):  “At the end of the day, more people’s concern over OAS clawback will not be such a big deal simply because there are not a lot of people over the age of 65 making more than $72,809 of income. The people that do may have significant pensions or continue to work and earn and income over the age of 65. There will also be a group of people that trigger significant capital gains from the sale of second property or investments but the good news is they will only lose part or all of there OAS in the one year that the capital gains is realized and reported on the tax return. But if you happen to be one of the few that will get affected, make sure you plan ahead accordingly”.

CONCLUSION

The OAS clawback (implemented by Conservative party) is just another example of how politicians and government have ensured that senior upper middle class married or coupled family units with incomes between $72,809 to $118,055 net income per person will benefit more from the OAS government program. These same politicians and government agencies have financially discriminated against ever single seniors, early divorced in life seniors and single parent seniors by ensuring only five percent of seniors will receive reduced OAS pensions, and only two percent lose the entire amount.  Note we have specifically stated upper middle class married or coupled family units because wealthy married and coupled family units have already been excluded from receiving OAS pension by virtue of the $$118,055 (couple $236,110) net income limit.

To add further insult, politicians and government have ensured that the upper middle class will receive benefit upon benefit upon benefit to reduce the effects of the OAS recovery tax program.  The Liberal party (now ruling federal party) implemented a 1.5% reduction in income tax for incomes between $45,282 and $90,563.  These are middle class incomes, not incomes of the poor. Pension splitting is another program that reduces the possibility of OAS clawback.  As stated above, past governments have also ensured that marital manna benefits and ability to manipulate assets have been been given primarily to married or coupled family units all within legal limits of financial laws.  All of these benefits perpetuate an upside-down financial system where the upper middle class and the wealthy are able to achieve greater wealth than ever single, early divorced in life and single parent seniors.  In other words, the OAS Recovery Tax program (supposed to provide income security for poorer seniors) is a failed program which ensures greater wealth for the upper middle class and greater poverty for singles and the poor.

SOLUTION (added August 31, 2016)

Equivalence scales (scales) and net worth –  how many times can it be said over and over again that wealthy and upper middle class married or coupled family units are increasing their wealth by government programs designed to give more to these family units?  To correct this financial discrimination and upside finances for singles and the poor, equivalence scales and net worth need to be applied to these programs.  Monies saved could then be redistributed to the poor regardless of marital status.

(This blog is of a general nature about financial discrimination of individuals/singles.  It is not intended to provide personal or financial advice).

HISTORY OF FAMILY TAX CREDITS OVER DECADES ARE FINANCIALLY DISCRIMINATING TO SINGLES – Part 2 of 2

HISTORY OF FAMILY TAX CREDITS OVER DECADES ARE FINANCIALLY DISCRIMINATING TO SINGLES – Part 2 of 2

(These thoughts are purely the blunt, no nonsense personal opinions of the author about financial fairness and discrimination and are not intended to provide personal or financial advice).

The August 2, 2016 post (decades) outlined almost all of the family tax credits that have been brought into play over the decades.  Many are financially discriminating because they leave  ever singles and early divorced singles out of the equations.  Single parents do receive some of these benefits for their children, but are not included in all the benefits afforded to having a spouse or partner.

family tax benefits over lifetime

The above table (updated Aug. 29/16) shows benefits available to a married or coupled family units with children from time they are able to use maternal and parental benefits to time of death of one spouse (yellow, blue and green fill in).  Single parents only have benefits related to their children (orange fill in).  Married or coupled family units without children have all the benefits related to having a spouse or partner (navy fill in).  Ever singles and early divorced singles, have none of the benefits available to married or coupled family units (fill in is blank because they have none of the benefits of spouse #2. In addition, they are often are unable to max out RRSP and TFSA contributions).  (While late in life divorced singles have none of the benefits for spouse #2, they may have been able to accumulate more net worth and assets while they had a spouse or partner).

Age categories of age 30 to 50 years are used to show suggested family unit of two children, one newborn and second child born two years later.  Life expectancy for Canadians is 80 for men and 84 for women so ages in table were calculated to age 85 assuming both spouses were still alive at age 85.

Estimation of the ADVANTAGES OF BENEFITS include the following:

Maternity and Parental Benefits

It is difficult to determine total number of Canadians who have receive EI benefits in a year as statistics seem to be based on month to month data.  However, there are studies that state annually about 25% of EI claimants receive maternity and parental benefits.  (Some parents may not receive these benefits if they did not contribute to EI or were not employed long enough receive any benefits).

StatsCan’s latest data on Employment Insurance recipients indicates Canada’s federal government (huffingtonpost) is growing stingier with EI benefits since Canada’s EI regime has been significantly toughened under Harper’s Conservative government. Changes that came into place include tougher, more complex rules for keeping EI benefits, and a new requirement that EI beneficiaries who have used EI frequently have to take any job available to them and accept as much as a 30-per-cent pay cut.

There is no such restrictions for maternal and parental benefits.  Although the benefits have a defined time limit (usually up to a year), there is no exhaustion of time limits for benefits for maternity and parental benefits as there is for regular unemployed persons (also can have benefits for multiple pregnancies).  While it is acknowledged that mothers go through stress of caring for a new infant, it should also be acknowledged that unemployed persons receiving EI go through stress of applying for EI and then constantly have to be looking for a job while EI benefits are running out and they have no money to pay for expenses.  Employees in EI offices are often not the most pleasant people to deal with.

Question:  do beneficiaries of EI (i.e. two or more children) use more benefits than other beneficiaries during working life of 35 years?  Present maximum EI contributions equal about $1,000 per year.  Over a 35 year period of working, contributions by a married or coupled family if both spouses are working is approximately $70,000 (this only holds true if each spouse is employed for 35 years each, many wealthier couples retire at age 60, not 65).  If a married or coupled family unit have two children with a maximum allowed $50,800 EI yearly insurable earnings at 55%, they will basically have used a large portion of the monies they contributed to the plan (with three children they will definitely likely have used all monies contributed).

Study ‘Benefitting from Extended Parental Leave’, March 2003, Katherine Marshall (statcan):  “Significantly more mothers who returned within eight months reported annual earnings below $20,000 in their previous or current job (49%) compared with those who returned after almost a year (29%) … this suggests that women with lower earnings (and possibly lower savings) may not be financially able to stay at home for an entire year on 55% of their earnings….Also, more likely to be a household where total income was under $40,000 (46%) compared with those who returned between nine and twelve months (38%)”.  Many families and family organizations are lobbying for the lengthening of maternal and parental leaves to two years.  It has to be stated once again that upside down financing ensures that more wealthy parents get to use full EI benefits than poor parents. Dollar value assigned for maximum maternity and parental EI benefits for two children equals approximately $55,880 ($50,800 X 55% X two children).

Canada Child Benefits – the outrageous discrimination of this program where net worth and assets has not been taken into consideration has already been discussed (poverty). Maximum annual Canada Child Benefits for 2016 are set at $6,400 per child ages one and up to six years and $5,500 for children ages 6 to 17.  Dollar value calculation using ‘middle of the road’ value (maximum values divided by 2) of $6,400 and $5.400 annually ($3,200 times five years times two children ages 1 and up to six equals approximately $32,000, $2,700 times 12 years times 2 children ages 6 to 17 equals approximately $64,800) equals a total of approximately $96,800.

Registered Education Savings Plan (RESP) based on the amount of the RESP contributions and income level, the government may additionally contribute up to $7,200 per child as well as other grants. Dollar value for two children may total at least $14,400 of government benefits not counting other grants such as provincial grants.

Spousal Registered Retirement Savings Plan (RRSP) allows a higher earner, called a spousal contributor, to contribute to an RRSP in their spouse’s name (it is the spouse who is the account holder).  A spousal  RRSP is a means of splitting income while working and during retirement and, therefore, possibly pay less tax. (It is not possible to calculate how much income tax might be saved).

Tax Free Savings Account (TFSA) – implemented in year 2009 with maximum contribution allowed per person of $5,500.  For years 2009 to 2016, the approximate maximum allowable amounts for spouse #2 is a total $42,000 (all tax free and not including monies generated from investments).  The Canadian Parliamentary Budget Office states “the TFSA program is regressive, overall, it offers no additional benefit to low- or middle-wealth households” (global) .  TFSAs for the wealthy are used as tax shelters.  It has been suggested that one half of Canadians have a TFSA account, but only half of those with the account have contributed to the account on a regular basis.  It is a well known fact that mostly wealthy Canadians have been able to contribute the maximum amounts to their accounts even in their senior years (another upside financial scheme to allow wealthier Canadians to gain even more wealth).  Many singles and poor families do not have the financial ability to max out their TFSA contributions.  Dollar value used for spouse #2-lifespan from age 30 to 85 years equals $5,500 time 55 years for a total of $302,500.

Income tax (federal) decreased by 1.5% for those earning between $45,282 and $90,563 – each spouse receives benefit of reduced income tax.  Using 2015 Canada Income Tax form, the calculated income tax for approximate income between $45,282 and $90,563 is $16,539.  A 1.5% tax reduction equals $248 annually.  The majority of ever singles and early divorced persons do not have incomes over $45,282, especially seniors. While middle class families with children get less of the Canada Child Benefit, this is offset by the reduced income tax. This is one benefit piled on top of another benefit.  Dollar value used for spouse #2 (assuming 55 working years) is $248 time 55 working years for a total of $13,640.

Pension Splittingallows splitting of the pension income between spouses to reduce tax paid.  This strategy allows the spouse who has the highest income to lower his/her tax payable by sharing up to 50% of his/her pension income with his/her spouse.  Apparently 2.2 million Canadian seniors benefit from pension income splitting.   This may also allow the higher earner to receive the full OAS benefit without clawbacks.  Review of online data (Splitting) shows:  “of the $1.2 billion federal cost for pension splitting in 2015, $250 million of that cost is due to increases in OAS payments that wouldn’t have otherwise occurred. Hole. Wealthiest 10% of families get 31% of this benefit while bottom 50% of families get 2% of the benefits.  Single-parent families and Canadians living alone would gain no benefit from the creation of this tax loophole.   The gains from the pension income splitting loophole go disproportionately to the richest four deciles—the richest 40% of the Canadian senior population. In fact, the richer the senior family, the more it receives from this loophole. The poorer the senior family, the less support it receives. The poorest 10% of seniors receive an average of 10 cents in terms of a tax break from this loophole, whereas the richest 10% receive an average of $820 in perks. The richest 10% of senior families receive more benefit from this loophole than the bottom 70%. Looking at it from another vantage point, one out of five of the richest 10% of Canada’s senior families receive a cheque for over $1,000 from this program while three out of five make some gain from it. Of the poorest half of all senior families, only one out of every 1,000 seniors gets more than $1,000 from pension income splitting. Seven out of 10 seniors enjoy no benefit at all from this tax loophole. The poorest half of all senior families—they’re making less than $36,000 a year—receive only $2 out of ever $100 paid out by this loophole. In contrast, the richest 10% of senior families making over $85,000 receive $30 out of every $100 paid out. Most of the seniors in the bottom 40% of the income distribution are single women. As such, there is no one to split with and therefore no benefit from this loophole. The cost of this tax loophole is large and gets larger every year. While most of this program’s payouts are going to Canada’s richest seniors who don’t need extra support, there remain seniors who live below the poverty line.  In fact, to lift all Canadian seniors above the After-Tax Low Income Measure (AT-LIM) poverty line in Canada, it would cost approximately $1.5 billion a year—slightly less than Canadian governments are currently spending to support Canada’s richest seniors.  As with many government decisions, budgets are all about policy choices: in the case of pension income splitting, the political choice is to support rich senior families instead of lifting all seniors out of poverty – even though they both cost approximately the same.  While income splitting is often touted as a loophole for middle class Canadians, this study illustrates how in reality, it is actually a loophole for Canada’s richest families…..The richer the family, the more it stands to gain; the poorer the family, the more it stands to lose. Under any income splitting scenario, the bottom six deciles of Canadian families wouldn’t even get an equal share of the benefits”.  Dollar Value:  If the richest 10% receive an average of $820 in these perks annually, then $800 at 20 years from age 65 to 85 equals $16,000 in income tax savings not including the benefits received from OAS not being clawbacked.

OAS Clawbackthe clawback of OAS benefits in 2016 starts with a net income per person $72,809 (couple $145,618)  and completely eliminates OAS with income of $118,055 (couple $236,110).  According to Human Resource Development Canada, only about five percent of seniors receive reduced OAS pensions, and only two percent lose the entire amount.  This program benefits wealthy couples and widowers the most. Essentially, there is virtually no clawback for the wealthy so no dollar value is calculated. No dollar value attached, but it is apparent that upside down financing prevails and wealthy families lose nothing-they get to retain their wealth.  The OAS Clawback benefit is basically a useless benefit.

Involuntary Separation Benefit –  in Involuntary Separation (spouse in nursing home), certain benefits may help pay for energy costs, and provides relief for sales and property tax and may also allow a portion of the Long-Term Care Home accommodation cost to remain with the spouse in the community. Qualifying under “Involuntary Separation” would allow both spouses to receive their pensions as single individuals (usually applies to low income seniors).  Not possible to calculate dollar value.

Survivor Benefits – benefits can apply to pensions including public pensions.  Details will not be discussed here and no dollar value has been assigned.

LOST DOLLAR VALUE TO SINGLES or looking at it in another way – Estimated Positive Dollar Value for married or coupled family units with two children

  • Maternal and Parental Benefits $55,880
  • Canada Child Benefits $96,800
  • RESP $14,400
  • Spousal RRSP (not possible to estimate dollar value)
  • TFSA $302,500
  • Income tax Reduction $13,640
  • Pension splitting $16,000
  • OAS Clawback (useless benefit as only richest 5% of Canadians get clawbacked-most married or coupled Canadians get to keep their OAS even with wealth)
  • Total $490,220

Estimated Positive Dollar Value for married or coupled family units without children

  • Spousal RRSP (not possible to estimate dollar value)
  • TFSA $302,500
  • Income tax Reduction $13,640
  • Pension splitting $16,000
  • Total $332,140

Estimated Positive Dollar Value for Single Parent with two children                    (added Aug. 24/16)

  • Maternal and Parental Benefits $55,880
  • Canada Child Benefits $96,800
  • RESP $14,400
  • Total $167,080

Estimated Positive Dollar Value for Ever Single and Early Divorced Singles  – Total $0 due to fact of no children and no spouse or partner (added Aug. 24/16)

CONCLUSION

New Canada Child Benefits if they continue in perpetuity for next twenty years implies that many middle class and wealthy married and coupled family units with children will receive benefits that equal the costs of raising children (estimated $250,000 per child) while growing their wealth.  Benefits on top of benefits and overlapping of benefits are most advantageous for married or coupled persons with children and without children.  Some benefits carry through all the way from age 30 to age 85.

While it is recognized that this exercise has only a gestimate of dollar values, there can be no doubt that many of the benefits (most initiated by the Conservative and perpetuated by the Liberal Party) continue to increase wealth for middle class and higher income married and coupled family units with and without children.  Singles parents only receive the child benefits.  Singles, single parents and poor families can never financially achieve same kind of wealth as married or coupled family units because they have been left out of financial formulas due to financial discrimination.  The political will is to support rich families instead of lifting singles and poor families out of poverty.

(This blog is of a general nature about financial discrimination of individuals/singles.  It is not intended to provide personal or financial advice).

NET WORTH AND ASSETS CONTRIBUTE TO FINANCIAL DISCRIMINATION OF SINGLES-Part 2 of 2

NET WORTH AND ASSETS CONTRIBUTE TO FINANCIAL DISCRIMINATION OF SINGLESPart 2 of 2

(These thoughts are purely the blunt, no nonsense personal opinions of the author about financial fairness and discrimination and are not intended to provide personal or financial advice).

When politicians, government and the wealthy continue to perpetuate myths that net worth and assets are too difficult to calculate or should not or cannot be included in financial formulas, this continues to make it possible for the wealthy to maintain their wealth and impossible for singles and the poor to maintain or increase their financial well-being thus resulting in financial discrimination and poverty for these groups.

The following three examples show how inclusion or exclusion of net worth and assets perpetuates the myths proposed by financial analysts, politicians, government and the wealthy.

EXAMPLE #1

Affordable Housing (services)

One assistance program in Alberta is Community Housing which is a subsidized rental program. It provides housing to families and individuals who have a low or modest income. Program funding comes from the federal, provincial, and municipal governments.To qualify, applicants must be Canadian Citizens, independent landed immigrants, or government sponsored landed immigrants. Assets and belongings cannot exceed $7,000. Assets include, but are not limited to:

  • bank accounts
  • investments (excluding RRSPs)
  • equity in property
  • equity in a motor vehicle (assessed by reviewing the value in the most current Canadian Red Book)

EXAMPLE #2

Legal Aid Alberta (legalaid)

Financial Eligibility Guidelines – If income falls within the amounts listed below, person(s) may be eligible for legal representation and to have a lawyer appointed.  Representational services are not free. Repayment will be discussed if a lawyer is appointed.  Legal Aid’s Financial Eligibility Guidelines allow the following eligible monthly income for family size of 1 – $1,638, 2 – $2,027, 3 – $2,885, 4 – $3,120, 5 – $3,354 and 6+ – $3,587.

An example of this is an actual court case going on at the present time.  Legal Aid has refused to assist client’s claim of defence for an estimated $25,000 in legal fees.  Legal Aid says client still has a large amount of property ($500,000 mortgage free), $34,000 in savings, tax free savings account (TFSA), and GICs and mutual funds worth another $21,000, plus $570 a month in old-age security payments with monthly expenses of $1,660.  Legal Aid does not give coverage to individuals with assets in excess of $120,000.  Legal Aid states: “client would be left with well over a half a million dollars in assets even after payment of legal fees.”

EXAMPLE #3

Family Tax Credits (tax-credits)

June 11, 2016 Financial Post Personal Finance Plan “Farm Plan Risky for Couple with 4 kids” shows how plethora of tax credits works for this family, Ed 32 and Teresa 33, stay at home spouse have four children ages 5, 3, 1 and newborn.  Government employee Ed brings home $2,680 after monthly tax income.  Net worth is already $502,000 including $200,000 paid for house.  Non taxable Liberal Canada Child Benefit for four children will be $1,811 per month bringing income to $4,491 per month.  (From ages 6 to 17, Canada Child Benefit will be $1,478 per month).

LESSONS LEARNED

These three examples show how the inclusion or exclusion of net worth and assets benefit the wealthy and families more than singles and poor families.  In Example #1, to receive housing assistance only $7,000 is allowed in assets.  Really, that is it? Compare that to Example 3 where a family already having significant net worth will receive benefit upon benefit upon benefit in addition to Family Tax Credits.  In Example #2, this could be said to be a good case where financial fairness has prevailed.  This client has plenty of net worth and assets to pay for $25,000 legal defence.  When the Legal Aid income scales are analyzed, it is apparent they have at least used some form of equivalence scales (finances). Hallelujah, here is one example where a family unit of two is not assessed at a value times two of that of family unit of one!

CONCLUSION

This post is just another example of the blatant hypocrisy and upside-down finances that financial analysts, politicians and government, and families perpetuate by not including net worth and assets in all financial formulas across the board whether they are local, provincial or federal or of a service type such as Legal Aid.  The blatant financial discrimination of singles and the poor continues while the wealthy get to write their own ticket to wealth by paying less and increasing wealth.

(This blog is of a general nature about financial discrimination of individuals/singles.  It is not intended to provide personal or financial advice).

NET WORTH AND ASSETS CONTRIBUTE TO FINANCIAL DISCRIMINATION OF SINGLES-Part 1 of 2

NET WORTH AND ASSETS CONTRIBUTE TO FINANCIAL DISCRIMINATION OF SINGLES-Part 1 of 2

(These thoughts are purely the blunt, no nonsense personal opinions of the author and are not intended to provide personal or financial advice).

Past posts on this blog have shown how financial  formulas that do not include net worth and assets in the formulation promote financial discrimination of singles and the poor.

In past posts financial profiles from the Financial Post have been used to show reasons why and how singles are financially discriminated against.  The editor of the Financial Post profiles Andrew Allentuck, published an interesting article on November 9, 2011 “The rich not an easy target for the taxman” (financialpost).

The idea of taxing the rich is back in fashion.  Advocates for hitting wealthy people with extra taxes argue that it would add to national or provincial revenues and counter the maldistribution of wealth in Canada….

Taxing wealth by taxing income is bad economics.  Wealth is a stock while income is a flow, notes Fred O’Riordan, national advisor for tax services with Ernst & Young in Ottawa.  People can be wealthy, but if they are not employed or if they are retired, they may have modest incomes,  In turn, there are people with high incomes who are spendthrifts and do not build up much wealth.  Advocates for taxing the rich have to aim for the right target….

Today, wealth taxes (in Canada) continue to exist at low rates charged as probate fees when estates are wound up.  (These low fees have helped stop flow of monies out of the country as experienced by countries with high probate fees)…..

The problem, Mr. O’Riordan notes, is that wealth is more portable than income and is easily moved by the living. Money can be electronically zipped around the world in seconds.  Moreover, if the wealthy can see special levies coming, they can shift their wealth away from tax assessor’s hands.

Even if a country or a state or a province were to decide to tax wealth, hurdles would be substantial.  Mansions and lavish condos are immovable and therefore easy to tax. Financial assets like stocks and bonds, mutual funds and bank accounts are registered in various places and therefore also are relatively easy to tax.

Wealth taxation gets harder when the target is art hanging on walls, collections of comic books and baseball cards, all of which are subject to tests of authenticity and changing fashions.  When it comes to buried treasure, such as jewels or gold in safe deposit boxes, merely finding assets would be challenging…..

The difficulty of assessing the value of art, furs, jewels and other trappings of wealth would push tax authorities to focus on easy targets.  Houses and condos are a large component of most people’s wealth.  Yet taxes on homes would be regressive, Mr. O’Riordan says.  “Middle-class people would have a higher proportion of their net worth in houses than do the very rich.  Moreover, home equity rises with age as mortgage are paid off.  So a tax on easily measured home prices or values would hit the middle classes and the middle-aged and the elderly harder than they would young families or young people or who have little equity in their houses or condos”, he argues.

Intellectual property like copyrights and patents are even harder to value.  The value of the most powerful form of wealth, human capital, would be a tax appraiser’s nightmare….

Finally, there are questions of how much tax is too much tax.  Income is already taxed via annual returns, then retaxed when spent via sales taxes and the GST or HST, real estate taxes and sin taxes….To tax it again when unspent as wealthy might be widely resisted. Moreover, a tax on savings or, as some might see it, on thrift itself, could drive down national savings.  Businesses needing loans would be driven to borrow abroad.  Rising foreign debt would weaken the dollar.  As Leonard Loboda, a business advisor in Winnipeg explains, “soaking the rich historically defeats investment.”

COMMENTS ON ARTICLE

These comments are in reference to multiple benefits doled out by politicians, government and businesses without regard to net worth and assets.  To do nothing in assessing net worth and assets when handing out benefits is a blatant disregard of and promotes financial discrimination of singles and poor families.  An example of this is past post on family tax credits (program).

“People can be wealthy, but if they are not employed or if they are retired, they may have modest incomes,  In turn, there are people with high incomes who are spendthrifts and do not build up much wealth”.  Really???  Just because wealthy people may not be employed or have modest incomes or are retired does not mean they should receive more benefits than those who are gainfully employed with low incomes and less wealth (example:  family tax credits given in full amount to wealthy families who have low income and many children).  For those with high income who are spendthrifts, isn’t that their problem for being financially irresponsible?   It is also irresponsible for politicians and government to give benefits to this group.  (Family tax credits are only partially doing the right thing by using graduated income levels to reduce benefits for those with higher incomes).

Irresponsible financial behaviours on the part of those holding the wealth–it is irresponsible for those with wealth (applies to all persons regardless of marital status) to seek financial assistance when they have the means to use up some of their net worth and assets.  If persons can’t afford to pay house taxes or afford to  live, but have huge expensive houses, they should sell their homes and move to less expensive dwellings.

Upside down financing–net worth and assets of the wealthy where they often pay less in taxes, but get more in benefits is perpetuated by upside down financing initiated by the wealthy, politicians and government (housing is just one example) (finances).

Financial analysts and think tanks perpetuate financial advice that benefits mostly wealthy and those with more net worth and assets.  True facts about what it costs singles to live is often under-reported.  All the extra benefits given to married or coupled family units are not looked at in one big picture, but rather in isolated statements. Some financial analysts and think tanks do not treat home equity as a retirement asset.  (They believe that replacement rate analysis has as its objective an income that allows one to enjoy a lifestyle comparable to that which existed pre-retirement. They do not include home equity because they accept that the pre-retirement lifestyle for many middle-and moderate-income Canadians include continued homeownership). (financial).  In other words, those who have never been able to afford homeownership deserve to live a lesser lifestyle throughout their lives and into retirement.

When politicians, government and the wealthy continue to perpetuate myths that net worth and assets are too difficult to calculate or should not be included in financial formulas, this continues to make it possible for the wealthy to maintain their wealth and impossible for singles and the poor to maintain or increase their financial well-being thus resulting in financial discrimination for these groups.

(This blog is of a general nature about financial discrimination of individuals/singles.  It is not intended to provide personal or financial advice).

MARRIED OR COUPLED FAMILY UNITS MORE ABLE TO WORK THEMSELVES TO RICHES WHILE SINGLES WORK THEMSELVES TO ‘DEATH’

MARRIED OR COUPLED FAMILY UNITS MORE ABLE TO WORK THEMSELVES TO RICHES WHILE SINGLES WORK THEMSELVES TO ‘DEATH’

(These thoughts are purely the blunt, no nonsense personal opinions of the author and are not intended to provide personal or financial advice).

The July 3, 2016 post “Boutique Tax Credits Pushing Singles Into Poverty-Part 2 of 2”  (credits) outlined how married or coupled family units are generally able to achieve greater wealth because of tax credits.  This post will discuss how married or coupled family units with multiple sources of income will likely achieve greater wealth than singles with multiple sources of income.  To achieve the same level of wealth as married or coupled family units, singles would have to work themselves to ‘death’ while paying more income  tax.

Case #2 used information from Financial Post Personal Finance Plan, March 24, 2016 “Couple Sick  of Existing Like College Students Are Living Below Their Means, But Could Use Financial Tuneup” (financialpost).  This case shows how this married family unit, Mark 45 and Cathy 43 with two kids 9 and 12, have already achieved equivalent millionaire wealth in their 40s. They bring home income of $8,670 per month from two jobs and two rental properties. Mark’s job is part time and tenuous. He travels to northern Ontario for his job and to service the rental properties  They say ‘we live like college students, and we are tired of it.’ Financial advice is given on how they can retire at age 65, keep all their properties and have surplus income for travel and pleasure that they now forego.

One could say that some married or coupled family units will work themselves ‘silly’ (like college students) while singles are often told they are spendthrifts, selfish and don’t work hard enough.  In order for singles to achieve the level of wealth this couple has, they would have to work two or three jobs, pay more tax and not get the same tax credits this couple does.  In other words, they would have to work themselves to ‘death’ or to poor health.

Just one example of taxes that all family units most likely will have to pay is 2015 federal taxes of 15% on taxable income up to $44,701, 22% on income $44,701 to $89,401, 26% on income $89,401 to $138,586 and 29% over $138,586.  It is agreed that each person in family units of singles or married  family units pay the same taxes per employed person; however, the married family units with children will get multiple family tax credits, thus paying less tax.

CONCLUSION

It is absurd how singles are perceived to be able to achieve same financial success as married or coupled families unit with children, but when observations using cold, hard down to basics math are used, it quickly becomes apparent that singles and early divorced (with and without children) are unable to achieve same financial success except with $500,000 salaries, huge inheritances or winning the lottery.

(This blog is of a general nature about financial discrimination of individuals/singles.  It is not intended to provide personal or financial advice).

FINANCIAL POST PERSONAL AND FAMILY FINANCIAL PROFILES STAR RATINGS-Part 2 of 2

FINANCIAL POST PERSONAL AND FAMILY FINANCIAL PROFILES STAR RATINGS-Part 2 of 2

(These thoughts are purely the blunt, no nonsense personal opinions of the author and are not intended to provide personal or financial advice.)

(six-reasons-why-married-coupled-persons-are-able-to-achieve-more-financial-power-wealth than singles)

(Andrew Allentuck from the Financial Post oversees the personal and family finance profile evaluations.  Anyone can submit their financial profile to the Financial Post for analysis by a financial planner.  Some of these cases have been used in this blog.  It is helpful to know the background behind these financial analyses.  In Part 2 of 2 the following information outlines the top ten questions that the Financial Post receives regarding these financial profile evaluations.  The blog author’s comments re questions are entered below some of the questions.)

Financial  Post, December 22, 2012 “THE TOP 10 FAMILY FINANCE QUESTIONS OF 2012 (financialpost)

‘….In hundreds of letters to Family Finance requesting assistance and commenting on the problems folks face in paying their bills, 10 top issues emerged:

  • Debt…a 1.0% interest rate increase on a home equity line of credit will turn a $100,000 interest-only loan floating at 3.5% or $3,500 to a heftier $4,500 a year…

  • Tax shelters Inability to make the most of RRSPs, RESPs, TFSAs and, for those who qualify Registered Disability Savings Plans (RDSPs) spurred many readers to ask how they could sock away more money and which choices in the alphabet soup of these plans would be most tax efficient.  

  • Downsizing Family transition from children to empty nests and the need to raise cash for retirement spending came up in more than half of our cases.  The amount of money that can be raised or the amount of debt that can be liberated depends on the market price of home or cottage.  Where prices are very high – think Vancouver, Victoria, Calgary and Toronto – readers sensed that they could  take a profit over cost, especially if they had owned the home for many years, pay debts and have cash left over for a smaller home or for renting….’

Comment:  The unfortunate truth is that many seniors (married or coupled and widowers) living in their expensive big homes do not want to downsize.  Many financial assistance programs have been implemented included house tax assistance and renovation assistance.  Many singles and poor families, however, do not have the ability to own big expensive homes.  Singles are told they can move or go live with someone if they have problems  with housing.  It is primarily only wealthy families that have cottages or second properties, motorhomes and other expensive toys.

  • ‘Children Couples and those expecting a first child wrote in dozens of cases to ask what is the cost of raising a child.  A 2011 study by the Manitoba Department of Agriculture suggested that a child born in 2010 would set its parents back by $191,665…..’

Comment:  Some statistics give a figure of $250,000.  To 18 years of each child, this amounts to $13,889 per year and $1157 per month.  It is difficult to understand why parents (beyond replacing themselves with two children) would have three, four, five children when they know they won’t be able to support themselves and their children within the parameters of their budgets and salaries. When it is known that there is a world population explosion and the earth will not be able to sustain this population explosion, why would responsible parents have more than two children?

  • ‘Boundaries It is one thing to know the statistics of child-rearing expense and another to  manage it.  Readers asked many times how much they could afford to give their kids for RESPs and for activities while at home.  It was common to find cases in which parents, strapped for money, spent $400 to  $500 a month for sport yet could have cut down on hockey and put enough money into RESPs to qualify for maximum government grants.  Indulgences included foreign travel with parents and money for cars for teenagers.  When the parents wound up strapped for cash, it was clear that they had failed to set boundaries on what they would spend and what they might ask their older children to earn to support their sports, hobbies and travel.’

Comment:  Straight from a financial person’s mouth-married or coupled families with children often don’t set boundaries in reality to what they can afford.  However, singles are often told they spend too much and are selfish even though they don’t have the same financial income and assets as married or coupled families with children.

  • ‘Limits to portfolio growth

  • Understanding risk

  • Insurance Virtually every reader has insurance for his home and car, but life insurance is another matter.  A third of  our readers need more insurance than they have to cover to risk that the single breadwinner in a family could die prematurely.  Another third have inappropriate coverage with costly whole life that builds cash value slowly, or universal life they (and many financial analysts) can’t understand.  The remainder need to adjust their coverage up or down with how their lives have changed.  The math within life insurance is complex, the tax breaks that life insurance can afford are valuable, and the protection against many creditor claims life insurance can provide are precious, but few readers  understand how intricate a product life insurance is.’

Comment:  Life insurance should be made mandatory for all married or coupled family units, just like home and car insurance.  Life insurance should replace all boutique tax credits directed towards widowers as they are now technically ‘single’.  Ever singles and divorced persons do not get benefits that widowers get and are, in fact, helping to support widowers with these benefits. Also, education on term insurance as the most cost effective insurance needs to be promoted.

  • ‘Retirement age A generation of readers grew up aspiring to retire at age 55.  Two-thirds of the letters to Family Finance raise the question of how they can get enough money to retire then or a little later.  Today, the mid-50s goal is so 1980 – before the crashes of the dot-coms, 9/11 and the 2008 debt crisis.  In fact, few readers have sufficient capital to make it to 55.  Instead, working another decade to 65 or even 67….is necessary.  Working longer not only allows more savings, it postpones the time that retirees have to start drawing down their capital.  Working longer also provides a reason to get up in the morning, maintains associations, and even sustains credit ratings.  Full retirement at age 55 is an idea whose time has come and gone for most.’

Comment:  Again, straight from a financial person’s mouth-married or coupled family units seem to believe they can retire early after having received multiple family tax credits, and then be able to pension split without paying very little for these credits.  Many singles have to work longer while paying to help support married or coupled family units and the multiple tax credits they receive.  Singles receive very little of these tax credits.

  • ‘Make a budget Many requests to Family Finance ask for help making a budget.  Readers regard having a set of rules as a key to meeting savings goals for their kids and retirement.  Where cash is tight, a set of rules for the road is surely a good  idea.  Just thinking about what categories of spending should have various allocations each month is helpful.  Mundane it may be, but writing a budget can be a first step to sound family finance.’

Comment:  Everyone should have a budget.  In addition to family budgeting, parents need to teach their children about budgeting, the Rule of 72 and what the real costs are for items like expensive sports activities.  If singles are thought to be spendthrifts and selfish, maybe it is because their parents never taught them anything about finances.  Or, maybe it is because married or coupled family units with children don’t even to try to understand what it costs single persons to live once they leave  home.  More married or coupled family units with children need to educate themselves on all the benefits they receive, how little they are paying for these benefits and what it is costing other family units like singles to support these benefits that they, themselves, do not receive.

CONCLUSION

It would be helpful if all citizens learn to take responsibility for their own financial well-being instead of looking to others to support them in the form of government tax credits. The present upside down financial situation of giving to the wealthy (particularly married or coupled or family units with children) while making them pay less needs to be reversed so those who truly need assistance receive this assistance (poor singles and poor families with children).  It is absurd that the wealthy are accumulating huge inheritances like TFSA accounts without paying taxes on these accounts.  It is absurd that the wealthy parents want to leave huge inheritances for their children, but do not wish to give up assets like big houses while receiving tax credits such as house tax financial assistance and pension-splitting.  It is absurd that governments do not take into accounts assets as well as income when handing out tax credits.

(This blog is of a general nature about financial discrimination of individuals/singles.  It is not intended to provide personal or financial advice.)

BOUTIQUE TAX CREDITS INCONSISTENT AND FINANCIALLY DISCRIMINATING (Part 2 of 2)

BOUTIQUE TAX CREDITS INCONSISTENT AND FINANCIALLY DISCRIMINATING (Part 2 of 2)

These thoughts are purely the blunt, no nonsense personal opinions of the author and are not intended to provide personal or financial advice.

(The following information is taken from:  Policy Forum: The Case Against Boutique Tax Credits and Similar Tax Expenditures by Neil Brooks (brooks) (abstractwhich show SELECTED TAX EXPENDITURES INTRODUCED OR SUBSTANTIALLY AMENDED FROM 2006 TO 2015 (page 129).  His article states:  

The table that follows lists selected tax expenditures introduced or substantially amended by the Conservative government between 2006 and 2015. These tax expenditures are listed under the headings and in the order shown in the Department of Finance’s Tax Expenditures and Evaluations 2014. To provide some context, a few of the listings have a brief introduction. The year in parentheses following the listing is the year the measure was introduced or enriched. The projected cost for 2014 of new and amended tax expenditures is then given, if it was provided in that year’s tax expenditures and evaluations report.

Where the tax expenditure takes the form of a tax credit, the table indicates the amount of the credit. The actual value of the credit to the taxpayer is almost always 15 percent (the lowest federal tax rate in 2015) of the amount claimed by the taxpayer.  For example, although the maximum amount of the children’s fitness tax credit was increased to $1,000 in 2015, the maximum federal tax saving to the taxpayer is $150 ($1,000 × 0.15).

Some of the costs to the government as outlined in the Brooks article for the Selected Boutique Tax Credit Benefits are as follows:  charitable donation benefits and exemption of capital gains $265 million from 2017 to 2020,  first time donor’s super credit $7 million, children’s arts tax credit $42 million, textbook tax credit for post-secondary education and certified occupational training $34 million-amount claimed by students (not transferred to parents), post-secondary scholarships, fellowships, and bursaries exempt from tax $45 million, Canada employment tax credit $2.145 billion, volunteer firefighters tax credit $17 million, search and rescue volunteers tax credit $4 million, family caregiver tax credit $65 million, age tax credit $2.955 billion 2009 (parliamentary budget officer estimates that the two increases in the age credit since 2006 will have a fiscal impact of $950 million in 2014), registered disability saving plan $8 million, pension income tax credit $1.12 billion, changes to registered retirement savings plans and registered retirement income funds $670 million from 2016 to 2020, first-time home buyer’s tax credit $110 million, home renovation tax credit $2.265 billion in 2009), public transit tax credit $190 million.

(It should be noted that some of these have changed or been deleted since the Liberal party won the 2015 election).

Table – page 1 of 4

boutique tax credit 5

Table – page 2 of 4

boutique tax credit 6

Table – page 3 of 4

boutique tax credit 7

Table – page 4 of 4

boutique tax credit 8

This blog is of a general nature about financial discrimination of individuals/singles.  It is not intended to provide personal or financial advice.