SENIOR SINGLES PAY MORE – PART 2 OF 4

FINANCIAL FAIRNESS FOR SENIOR SINGLES NOT PART OF PLAN

(These thoughts are purely the blunt, no nonsense personal opinions of the author and are not intended to be used as personal or financial advice).

This article was published in a local newspaper on August 19, 2015. The Conservative Party was in power federally at the time. In the October, 2015 federal elections the Conservatives were ousted by the Liberal Party. Proper names have been removed.)

In the midst of a Federal Election the financial rhetoric continues. The Conservative Member of Parliament, Wildrose, in his latest mailbox flyer, states that Conservatives have been committed to helping provide Canadian seniors with a secure and dignified retirement. The reality is that married/partnered people stand to gain much more from the Conservative Action Plan 2015 and other Conservative financial initiatives than individual/single seniors.

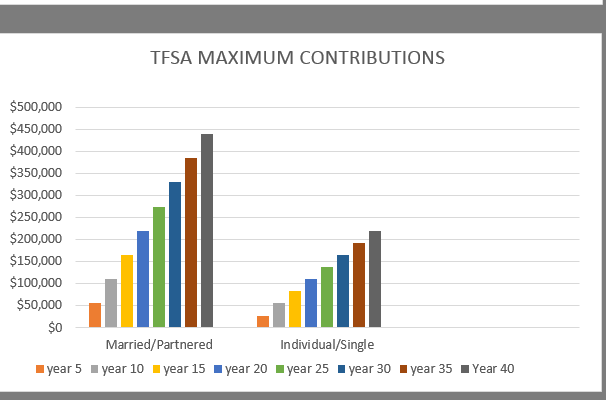
First, increases in the contribution limits of the TFSA account favors married/partnered people as the contribution limit per person is doubled. (The doubling of the TFSA was rescinded by the Liberals when they came into power in the October, 2015 federal election).

Second, pension splitting benefits applies only to married/couple people, not singles.

Third, the Age Credit benefits initiative increased by an amount of approximately $1,000. This benefit is incrementally reduced by 15% of net income exceeding approximately $35,000 and is eliminated when net income exceeds approximately $80,000. Any unused portion of the Age Credit can be transferred to the individual’s spouse or common-law partner. Comparable benefit of unused portion to individuals/singles without a spouse/common-law partner is zero.

Fourth, in the targeted tax relief benefits a senior couple can earn $40,720 without paying income tax (marital manna benefit), while a single senior can only earn $20,360 before paying income tax.

Fifth, Allowance for people ages 60 to 64 benefits are available to the spouses or common-law partners of GIS recipients. The spouse, age 60 to 64, of a senior with a single income of less than $31,584 may receive an allowance of $1,070.60 per month. This is an additional $12,000 per year. Furthermore, this benefit may also be available to immigrant married/coupled people who have been in the country for only ten years. Canadian-born and immigrant individuals/singles have nothing comparable to this benefit.

These are just a few of many more examples.

The following tables showing the income and net worth/wealth of unattached individuals versus families of two or more have been taken from MoneySense, The All-Canadian Wealth Test, January 2015 (moneysense) (based on Statistics Canada 2011 data)

____________________________________________________________________

INCOME TABLE

______________________________________________________________________________

INCOME

HOW DOES YOUR PAY STACK UP

_____________________________________________________________________

Quintiles                    Unattached Individuals        Families of Two or More

Bottom 20%                 $0 to $18,717                         $0 to $38,754

Lower-Middle 20%        $18,718 to $23,356                 $38,755 to $61,928

Middle 20%                  $23,357 to $36,859                 $61,929 to $88,074

Upper-Middle 20%         $36,860 to $55,498                $88,075 to $125,009

Highest 20%                 $55,499 and up                      $125,010 and up

______________________________________________________________________________

NET WORTH TABLE

____________________________________________________________________

NET WORTH

ARE YOU RICH?

______________________________________________________________________________

Quintiles                     Unattached Individuals        Families of Two or More

Bottom 20%                 Negative to $2,468                  Negative to $67,970

Lower-Middle 20%         $2,469 to $19,264                   $67,971 to $263,656

Middle 20%                   $19,265 to $128,087                $263,657 to $589,686

Upper-Middle 20%         $128,088 to $455,876              $589,687 to $1,139,488

Highest 20%                 $455,877 and over                   $1,139,489 and up

______________________________________________________________________________

An individual/single person who has an income of more than $55,000 is considered to be in the top 20% ‘wealthy’ category, but has great difficulty living a ‘wealthy’ lifestyle on $55,000 especially if they have a mortgage or need to pay rent in their senior years (meanwhile wealthy family income is $125,000 and up). Women between ages 45 and 64 earn on average $23,000 less than men.

What is even more revealing is the net worth of unattached individuals compared to families of two or more. The MoneySense article makes the following comments:

“The collective net worth of the lowest 40% of individuals wouldn’t match the poorest 20% of families. Families can build wealth faster than individuals because they can pool resources, which enables them to pay down debts faster and make larger purchases. And what a difference it makes: between ages 55 and 65, families are worth, on average, a whopping $670,000 more than unattached individuals in the same age group”.


(It should be noted that the net worth is probably even higher for families of two or more, since it appears that single parents with children are included in families of two or more statistics.  Single and divorced/separated parents of children, especially if younger in age, should excluded from families of two or more and placed into  their own category for more accurate statistics -added January 20, 2016).

It is always prudent to have more than one source for verification of facts, so here are another two.

The “Current State of Canadian Family Finances 2013-2014” report by the Vanier Institute of the Family vanierinstitute.ca states that

“between 1999 and 2012 the net worth of families advanced more than it did for unattached individuals”.

The 2009 “Report of the National Seniors Council on Low Income Among Seniors” (seniorscouncil) states that:

“between 1980 and 2006, the unattached have the highest incidence of low income of any group, with 15.5 percent of unattached seniors living below LICO in 2006, a rate 11 times higher than that of senior couples (1.4 per cent)”.

So how can married/coupled people continue to demand more financial benefits? How can governments continue to increase the financial means of married/coupled people at the expense of unattached individuals/singles? And, how expensive is it really to raise children when families can achieve so much more net worth than singles? Financial fairness requires balance and elimination of unfair benefits such as income/pension splitting and ability to transfer credits from one spouse to another.

The Conservative MP claims to “stand up for Canada’s seniors who have helped make Canada the strong and prosperous country it is today”. However, this holds true more for married/coupled people in Canada than it does for individuals/singles. In his flyer, the Conservative MP wants feedback on the question “Am I on the right track to deliver support to seniors?” For senior individuals/singles the answer is a resounding and unequivocal “NO”.

Individuals/singles need to stand up, speak out and make facts such as the above known to their members of Parliament, those with decision-making power, and families. Individuals/singles need to decide which political parties are detrimental to their financial health and vote for the party which best meets their financial needs in the Federal election. They need to demand financial sensibility and equality. Financial discrimination of one segment of the population over another is a blatant violation of human rights and civil rights.

(This blog is of a general nature about financial discrimination of individuals/singles  It is not intended to provide personal or financial advice.)

TFSA BOONDOGGLE FOR SINGLES AND LOW-INCOME CANADIANS

TFSA BOONDOGGLE FOR SINGLES AND LOW -INCOME CANADIANS

These thoughts are purely the blunt, no nonsense personal opinions of the author and are not intended to be used as personal or financial advice.    

Comment: This article was previously published in a local newspaper and is available on the internet. There were 51 recommends for this article. The final outcome (dependent on the results of the October 2015 Canadian Election) was that proposed changes to increase the TFSA to $10,000 by the Conservative party election promises was reverted back to $5,500 by the successful Liberal Party under Prime Minister Justin Trudeau . Regardless of what the TFSA limit is, with no cap on the contribution amounts, individuals/singles will still be at a significant financial disadvantage to married/coupled persons. Wording has been slightly changed from the original publication but does not change the thought content of the original publication (changes and additions to wording have been italicized).

The Federal Progressive Conservatives had in their infinite wisdom proposed in an election promise that the Tax Free Savings Account (TFSA) limits be changed from $5,500 to $10,000 per year.

To show the effects of having just $5,500 as a contribution amount for married/partnered versus individual/single Canadians, everybody sharpen your financial pencils and dare to do this simple math exercise-calculator not required.

Step 1 – Create two columns, one labelled married/partnered, the other individual/single. In each column for year 1 enter $11,000 for highest possible contribution for both spouses, and $5,500 for a single. Continue up to year 5 or up to year 40 (suggested number of income producing years). Then total the amounts in each column. At year 5 married/partnered total will be $55,000, single amount will be $27,500.

Step 2 – Now using the ‘Rule of 72’ https://en.wikipedia.org/wiki/Rule_of_72 -calculate the amount of possible compounding interest, investment income that can be generated from amounts in each column. Rate of return of 7 per cent will double the bottom line amount in 10 years and double again in 20 years and so on. Okay, you can use a calculator for this step!

Step 3 – Create a graph for amounts in each column, one for married/partnered totals, another line for individual/single totals. Each step in the graph could be shown for every five years up to forty years.

Results for $5,500 contribution (not including investment or interest amounts) amounts are shown in table below:


TFSA MAXIMUM CONTRIBUTIONS PER YEAR FOR MARRIED/PARTNERED VERSUS SINGLES

NOTE: Does not include potential compounded interest/investment income

TFSA TOTAL        Married/Partnered    Individual/Single

Year 5                      $ 55,000                       $ 27,500

Year 10                     $110,000                     $ 55,000

Year 15                     $165,000                     $ 82,500

Year 20                     $220,000                     $110,000

Year 25                     $275,000                     $137,500

Year 30                     $330,000                     $165,000

Year 35                     $385,000                     $192,500

Year 40                  $440,000                    $220,000

tfsa graph

This simple math exercise, which takes TFSA financial amounts down to the lowest common denominator, shows the proposed $10,000 yearly TFSA (all tax free!) would exponentially increase the wealth of married/partnered and high-income Canadians, while flat-lining the wealth of singles and low-income Canadians.

Add in Registered Retirement Savings account (RRSP) amounts with potential investment growth and wealth spread becomes even wider.

Thank you, Progressive Conservative Party for failing this simple math exercise, lining your own pockets just because you are married/partnered and wealthy, lining the pockets of married/partnered and high-income Canadians to levels of untold wealth while kicking off the financial bus individuals/singles and low-income Canadians who are unable to max out TFSA and RRSP contributions or make contributions to both programs.

Shame on Finn Poschmann, V.P. and Director of Research, C.D. Howe Institute for also failing this simple math exercise. In the Calgary Herald, “Popularity of TFSAs could mean lifetime cap in the future”, April 23, 2015, page D3 and business.financialpost.com/personal-finance  he states:

“That is absolutely fantastic, when you picture a world where a huge share of Canadians are retiring and living for a very long time, knowing that they have significant savings on hand. And there will less draw on public support programs which is also great….” He further goes on to state: “When TFSAs do become big, they may be a political target, and a financial target for government. However, it would be morally wrong for government to turn course, then, and go back on the commitment made to savers when they are doing their saving. So changing the tax rules retroactively would be very, very bad”.

Who are your financial advisors that would lead you to such an off-balanced decision and statement? Why would think tank persons, who are supposedly critical thinkers, and politicians make such a morally unfair decision to increase TFSA amounts without a cap in the first place and then think it is morally wrong for government to change course after the morally unfair decision has been made? This decision does nothing to erase the use of public support programs as only the wealthy will benefit from raising the TFSA amount.

It is no wonder that Canadian individuals/singles with and without children and low-income persons are in financial despair, repeat, financial despair. With governments, businesses, society and families giving financial preference and perks to married/coupled people and full complement families with two heads of households, individuals/singles are repeatedly having to pay more and get less and can’t even remotely begin to ever ‘catch up’ or be on an equal playing field with married/coupled Canadians.

Financial discrimination and violation of the human rights of individuals/singles and low income people must stop. There must be a cap on TSFA amounts and the cap must be put in place right now rather than later. It is socially, morally and ethically reprehensible, irresponsible and shameful to consciously make the already wealthy even wealthier at the expense of the poor.

Political parties who fail to use simple math formulations to avoid financial discriminatory policies and promises don’t deserve to be in power. Get out and vote! Individuals/singles and low income Canadians, contact your Members of Parliament regarding the financial discrimination of singles and low income persons! (Election took place in October, 2015 with the Liberal party winning a majority and TFSA amount remaining at $5,500).

Lost Dollars Value List

Stay tuned, this is a work in progress and will hopefully appear in future blog entries.

(This paragraph on lost dollar value for TFSA was added April 10, 2016 – If age 25 to age 65 or forty years and annual contribution of $5,000 is calculated for maximum contribution of TFSA that can be used by spouse number two, then calculated lost dollar value equals $200,000 – $5,000 times 40 years.  This does not include amounts lost through compound interest and investment potential.)

The blog posted here is of a general nature about financial discrimination of individuals/singles. It is not intended to provide personal or financial advice.