OAS CLAWBACK OUTRAGEOUSLY BENEFICIAL TO UPPER MIDDLE-CLASS MARRIED OR COUPLED SENIORS, BUT FINANCIALLY DISCRIMINATORY TO SINGLES AND POOR
(These thoughts are purely the blunt, no nonsense personal opinions of the author about financial fairness and discrimination and are not intended to provide personal or financial advice).
(six-reasons-why-married-coupled-persons-are-able-to-achieve-more-financial-power-wealth)
Occasionally, there are topics that give one pause resulting in questioning as to the efficacy of the formulation behind the topic. The OAS Clawback (proper name is OAS Recovery tax as per Canada Revenue Agency) and the financial discriminatory properties behind the program is one such topic. One way to resolve the questioning is to look at the topic in detail.
OAS is a federal social program designed to provide a very modest pension to low- and middle-income retirees. It is part of the universal government benefits for seniors (pillar 1) to ensure income security for senior Canadians. In 2016 the OAS maximum amount is $6,680 for a single person and $13,760 for a couple. OAS clawback which began around 2011 does very little to clawback the income of upper middle class persons, particularly married or coupled family units. The clawback of OAS benefits in 2016 starts with a net income per person of $72,809 (couple $145,618) and completely eliminates OAS with income of $118,055 (couple $236,110). The repayment calculation is based on the difference between personal income and the threshold amount for the year. The repayment of OAS is 15 percent of that amount. All OAS is clawed back if personal income is over $118,055.
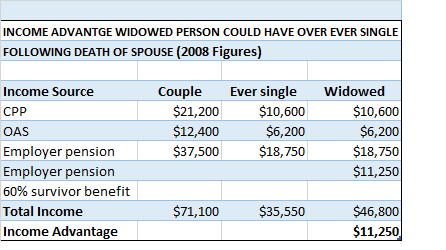
According to Human Resource Development Canada, only about five percent of seniors receive reduced OAS pensions, and only two percent lose the entire amount. This program benefits wealthy couples and widowers the most. OAS clawback for couple only begins at net income of $145,618 ($72,809 per person) thus allowing them to receive full OAS of $13,760 as a couple. There are not many ever single seniors, early divorced in life seniors and single parent seniors who could hope to achieve a net income of $72,809; however, for wealthy widowers this may be easier to achieve and they are the ones who complain about clawback.
An example of OAS clawback is the following example:
The threshold for 2015 is $72,809. If your income in 2015 was $80,000, then your repayment would be 15 percent of the difference between $80,000 and $72,809:
$80,000 – $72,809 = $7,191
$7,191 x 0.15 = $1,078.65
You would have to repay $1,078.65 for the July 2016 – June 2017 period.
Many financial advisors will give strategies on how to avoid the clawback while benefitting married or coupled family units the most. This is just another example of financial marital manna benefits and manipulation of assets that within the legal limits of Canada Revenue Agency’s laws allows married or coupled person to increase their wealth (manipulation-of-assets). This also is just another example of the upside finances perpetuated in this country by politicians, government and businesses that benefit married or coupled persons the most (quality-of-life).
From a financial advisor comes this statement (claw-back): “I also want to put the impact of the claw back into perspective. Although no one likes to give up $6,600 in free money, it’s not like you were going to get to keep it all anyway. As the OAS is taxable, most people in the claw back zone would have paid back over 30% of it in taxes.
Secondly, some clients look at paying claw back as the cost of doing business; while they may not love it, they look at it as a price of their own financial success and as money they really don’t need anyway. Moreover, they might correctly see that in some cases combatting the claw back isn’t worth the effort. For example, although the rest of the article will focus on how dividends are often bad news for retirees trying to avoid the claw back, these same people might also be reluctant to modify their investments to produce other types of investment returns, especially if that means unnecessarily courting more investment risk or triggering a big capital gain in order to rebalance their portfolios”.
Limiting OAS Clawback
There are a few strategies you can implement to reduce clawback amounts (strategies):
- Split your pension with your spouse. If your spouse has a lower income, you can transfer up to 50 percent to your spouse, which should reduce your overall income. This could also include a Registered Retirement Income Fund and annuity income.
- Dip into your Registered Retirement Savings Plan before you turn 65. An RRSP is only a tax deferral, meaning that at some point, you’ll have to pay those taxes. Consider taking funds out before reaching the age of 65 so you do not lose the OAS.
- Use your tax-free savings accounts to generate investment income, which is non-taxable and would not count towards your net income.
- Interest on funds borrowed to earn investment income can be deducted and could reduce your net income.
- Watch for capital gains. If you are planning a sale of an asset that could trigger large capital gains, consider selling it before you turn 65.
From another financial planner (minimizing-clawback): “At the end of the day, more people’s concern over OAS clawback will not be such a big deal simply because there are not a lot of people over the age of 65 making more than $72,809 of income. The people that do may have significant pensions or continue to work and earn and income over the age of 65. There will also be a group of people that trigger significant capital gains from the sale of second property or investments but the good news is they will only lose part or all of there OAS in the one year that the capital gains is realized and reported on the tax return. But if you happen to be one of the few that will get affected, make sure you plan ahead accordingly”.
CONCLUSION
The OAS clawback (implemented by Conservative party) is just another example of how politicians and government have ensured that senior upper middle class married or coupled family units with incomes between $72,809 to $118,055 net income per person will benefit more from the OAS government program. These same politicians and government agencies have financially discriminated against ever single seniors, early divorced in life seniors and single parent seniors by ensuring only five percent of seniors will receive reduced OAS pensions, and only two percent lose the entire amount. Note we have specifically stated upper middle class married or coupled family units because wealthy married and coupled family units have already been excluded from receiving OAS pension by virtue of the $$118,055 (couple $236,110) net income limit.
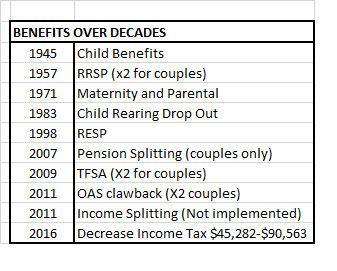
To add further insult, politicians and government have ensured that the upper middle class will receive benefit upon benefit upon benefit to reduce the effects of the OAS recovery tax program. The Liberal party (now ruling federal party) implemented a 1.5% reduction in income tax for incomes between $45,282 and $90,563. These are middle class incomes, not incomes of the poor. Pension splitting is another program that reduces the possibility of OAS clawback. As stated above, past governments have also ensured that marital manna benefits and ability to manipulate assets have been been given primarily to married or coupled family units all within legal limits of financial laws. All of these benefits perpetuate an upside-down financial system where the upper middle class and the wealthy are able to achieve greater wealth than ever single, early divorced in life and single parent seniors. In other words, the OAS Recovery Tax program (supposed to provide income security for poorer seniors) is a failed program which ensures greater wealth for the upper middle class and greater poverty for singles and the poor.
SOLUTION (added August 31, 2016)
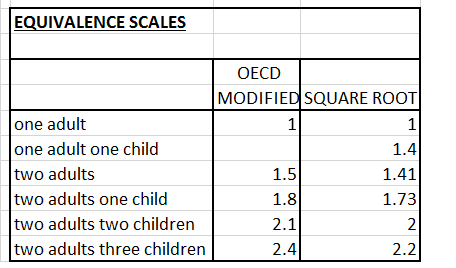
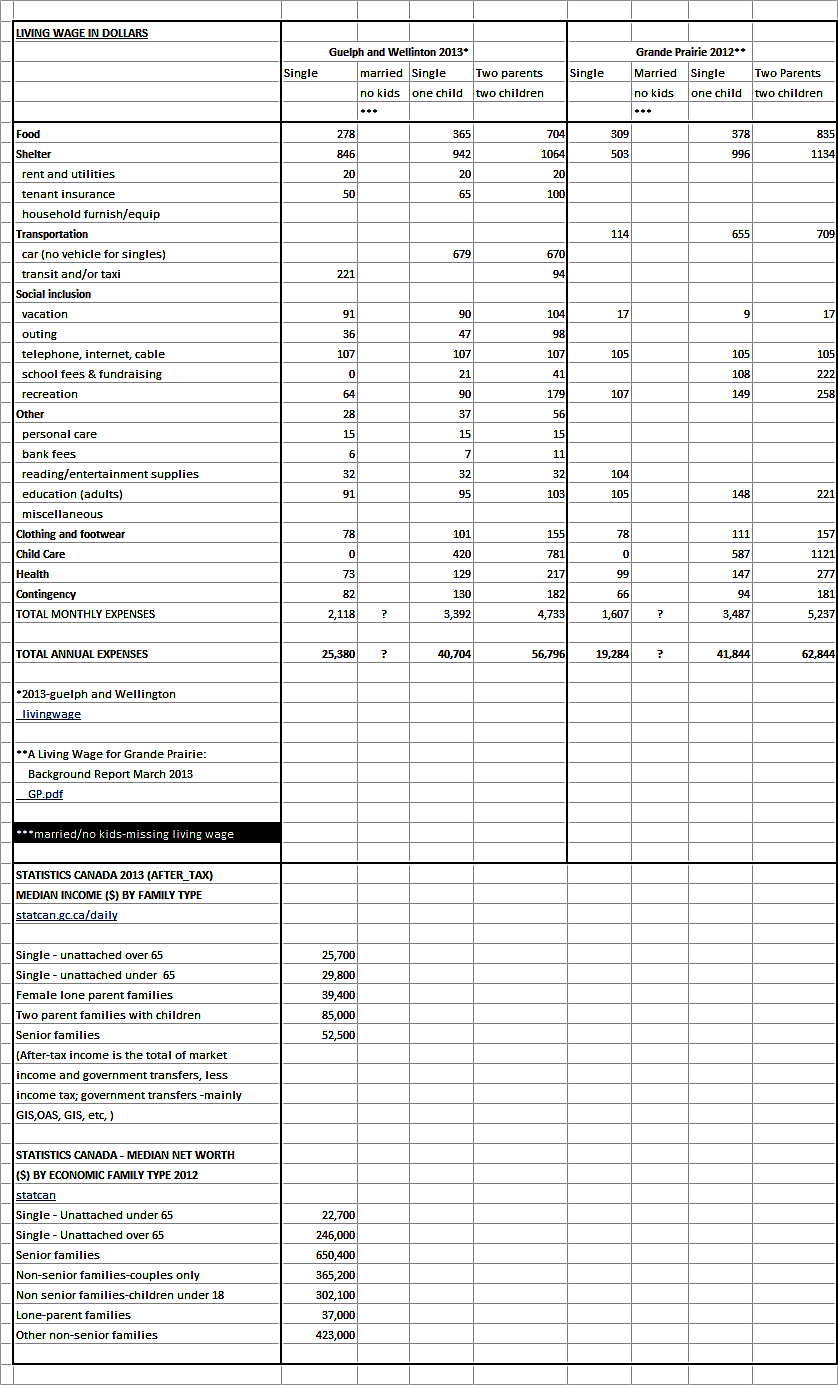
Equivalence scales (scales) and net worth – how many times can it be said over and over again that wealthy and upper middle class married or coupled family units are increasing their wealth by government programs designed to give more to these family units? To correct this financial discrimination and upside finances for singles and the poor, equivalence scales and net worth need to be applied to these programs. Monies saved could then be redistributed to the poor regardless of marital status.
(This blog is of a general nature about financial discrimination of individuals/singles. It is not intended to provide personal or financial advice).