FINANCIAL POST PERSONAL AND FAMILY FINANCIAL PROFILES STAR RATINGS-Part 1 of 2

FINANCIAL POST PERSONAL AND FAMILY FINANCIAL PROFILES STAR RATINGS-Part 1 of 2

(These thoughts are purely the blunt, no nonsense personal opinions of the author and are not intended to provide personal or financial advice).

six-reasons-why-married-coupled-persons-are-able-to-achieve-more-financial-power-wealth than singles.

(Andrew Allentuck from the Financial Post oversees the personal and family finance profile evaluations.  Anyone can submit their financial profile to the Financial Post for analysis by a financial planner.  Some of these cases have been used in this blog as in last post.  It is helpful to know the background behind these financial analyses).

Star ranking system as stated by Allentuck is as follows (top rating is five stars):

Financial Post, December 21, 2013 “HOW MANY STARS DOES YOUR RETIREMENT DESERVE?” (financialpost)

*One star means the potential retiree is in a troublesome place.  Few people who write to Family Finance are in the level at which there is no way to sustain a way of life without such major transformations as selling a home to raise cash, working to age 68, 70, or even 72 or telling children for whom money has not been set aside for post secondary education that they will have to finance it on their own.

In this category are people with business failures from which they have not recovered, low paying jobs, and modest savings.  Some one star cases involve what may be called “elective poverty”. The result is that the individual will have no hope of maintaining the present, rather modest standard of living.

Blog Author’s comment:  That ‘few people who  write to Family Finance are in this level’ explains why there are so few singles without children in these profiles.   Many singles and the poor fall into this category.  They are often told they cannot afford to buy a house and put money into savings.  They can only do one or the other, not both at the same time. Singles are often told they have to work longer than married or coupled person families to achieve a decent retirement lifestyle.  Many families with children seem to  make bad financial choices like putting their boys into hockey or going on yearly family vacations instead of, for example, maxing out RESP contributions to get the government grant.

**Two stars means that present savings and pensions will be insufficient to maintain a desired way of life, but that with time, perhaps restructuring of debt to eliminate loans with double digit interest rates, perhaps sale of a cottage and downsizing to one car, a retirement plan will be reworkable.  Some Family Finance cases get two stars as a result of divorce splitting assets that would have been adequate for two people sharing expenses but that are inadequate when savings have to support two  homes and when, as a result of loss of spouse, pension splitting is no longer possible.

Blog Author’s comment:  For singles and the poor the sale of a cottage is out of the question because they have no cottage to sell.  Straight from a financial person’s mouth – some profiles ‘get two stars as a result of divorce splitting assets that would have been adequate for two people sharing expenses but that are inadequate’ to support an individual and pension splitting is no longer possible.  This blog has stated over and over again that married/coupled family units require less money to live and pension splitting is financially discriminatory to singles and poor.  Singles are not able to pension split and poor families receive less value from pension splitting than wealthy married or coupled persons.  Many singles and poor families get two stars simply because they are financially discriminated against by not receiving equal benefits to wealthy married or coupled family units.

***Three stars means that a person or couple is on track for retirement as planned.  Debts may have to be reduced or a job stretched for a few more years, but time will be an ally.  A modest rate of return on conservatively invested assets and continuing or perhaps increased savings rate will achieve sufficient capital to produce investment income, perhaps bolstered by expected benefits from government and private pension plans.  At this level, it may be necessary to trim expenses to raise the rate of savings, but the machinery for a satisfactory retirement is in place.  It may be useful to suspend savings to pay down debt, then, when money is no longer draining to pay interest, to  restore savings and add what has been spent on debt service to retirement savings.  This financial engineering works on a solid foundation for asset growth.  Most Family Finance cases get this average but satisfactory rating.

****Four stars means a retirement plan is well conceived and that restructuring of savings or assets or lowering of expectations will not be needed.  There may be a need to reduce the costs of generating income, for example, by shifting from mutual funds with high fees to exchange trade funds with low fees.  This level is an adjustment process, not a restructuring of personal finances.  Many people with defined benefit pensions get four stars.  Their pensions are managed by experts, the management fees they pay are low and payments are guaranteed no matter what happens, for investment risk is borne by managers, not beneficiaries.

Blog Author’s comment:  Regarding statement ‘many people with defined benefit pensions get four stars’, benefits received from defined benefit pensions depend on how many years employee has contributed to the pension plan.  A few years of contributions will yield a very small pension.  Also, married or coupled person family units fail to realize that singles get less from defined benefit pensions because they have to pay more taxes on their pensions and cannot pension split.  Defined benefit pensions are inherently financially discriminatory to singles because survivors of the spouses get survivor benefits, but survivors have not contributed to the plan.  When spouse of plan deceases then whatever is remaining should be willed to the surviving spouse, just as single’s remaining benefits are willed to his or her estate.  Surviving spouse should treated equally to a single, after all, they are now ‘single’.

*****Five stars means that the person or couple will have sufficient income for living as planned.  If nothing changes, the plan will work and sustain income at the required level.  The five star evaluation is, in a sense, a level at which people with average jobs will not have suffered such crises as asset division in divorce, major investment loss or ill health forcing premature retirement.  Structurally, at the five star level, retirement income source are diversified with substantial pensions and a clutch of investments to provide discretionary income.  Most people with five stars have defined benefit pension plans and almost all have two breadwinners.

Blog Author comment:  It seems most profiles presented in the Financial Post do not achieve five star status even with a million dollars or more in assets.  Again from financial person’s mouth, in regards to two breadwinners, it is almost inherently impossible to a singles to achieve same financial retirement wealth as married/coupled persons unless they ‘work themselves to death’ with addition of part time or full time job in addition to regular job.  Many single parents are forced to work more than one job to make financial ends meet.

Allentuck provides the following methodology for rating retirement readiness:

  • Savings rate:  if savings are 10% or more of disposable income, score 1 point, if 20%, 2 points, if 30% 3 points, etc.  If less than 10% of disposable income, then no stars.

  • If job has a defined benefit pension, add 3 points.  If indexed plan, add 1 more point.

  • If there are no significant debts other than credit card charges paid each month, add 2 points.  If debt service costs are 20% or more of take home income, take off 1 point, if 20% of take home income, take of 2 points, etc.

  • If spouse can split eligible pension income, add 1 point.  If no spouse to split, take off 1 point.

  • If you have ten or more years to retirement add 2 points.  If less than 10 years, add 1 point.  If retired, 0 points.

  • If total investments both registered and non-registered less debts equal 20 or more times estimated annual pre-tax retirement income, add 5 points.  If 15 times estimated retirement income, add 4 points.  If 10 times, add 3 points.  If less than ten times estimated retirement income to two times retirement income, there are no points.  If negative net worth, deduct 5 points.

  • If total after tax retirement income is 120% of estimated retirement expenses, add 2 points, if 100% of retirement income, add 1 point.  If 90%  of retirement income, take off 1 point for each 10% it is less than estimated retirement expenses.

  • TOTAL:  If you have 10 points or more, you would probably get 5 stars.

Blog Author’s comment:  The five star rating and point system is interesting and does provide value in determining retirement readiness.  It also shows some of financial discriminatory aspects that governments perpetuate against singles and poor families. The system also continues to hide salient details as to why singles and the poor face financial discrimination and are unable to attain same financial power and wealth as married or coupled family units.

Savings rate:  Only the wealthy will receive top points because they have the most disposable income.  Defined pension benefits:  Benefits received depends on how many years of contribution there were and, as stated above, pension plans are inherently financially discriminatory to singles and the poor.  Three points will have more value to a married or coupled family unit  than they will to singles because of this discrimination.  Pension splitting:  Straight from financial person’s mouth, pension splitting is financially beneficial to married or coupled family units.  Singles will never get this point and, in fact, will lose one point because there is no spouse to split pension income with.  Total Investments:  The wealthy and married or coupled family units generally will have been able to accumulate more investments than singles and the poor; therefore, they will get more points in this rating system.  Total after-tax retirement income:  It is interesting to note many of the married or coupled family units profiled in the Financial Post cases will have even more retirement income with less expenses than while earning income and raising children.  This is because they are able to accumulate more wealth and have received many government benefits, so they will receive more points.

It is ironic that singles most likely are inherently excluded from receiving  a total of five stars because they receive less value from their defined benefits pensions and can never get the one point for pension income splitting and actually have to take off one point.  As stated those most likely to receive five stars have two breadwinners as opposed to one.

Financial Post, December 26, 2012 “THE MAKING OF FAMILY FINANCE” (financialpost)

QUOTE:  ‘The question is a common thread in our email messages and Web comments:  Why don’t you look for real problems of lower-income people who really need free financial advice?  For the record, the after-tax income of about 50% of those who ask for our help is in the range of $58,000 to $65,000 for families with two parents working and $45,000 to $55,000 for single people seeking our help.  About 30% have incomes between $100,000 and $200,000 a  year.

We hear from a few people, about 5% of inquiries, with incomes over $200,000.  And 15% have incomes below $35,000 a year.  So the vast majority of the 40 inquiries or so we receive every week fall between $58,500 and $200,000 a year.

We take on few cases of folks with incomes over $200,000 since, at that level, people can afford accountant and portfolio managers.

Those on the lower end of the scale also often fall off before reaching the final stages of our analysis because for many there is just no constructive advice on debt management and investment solutions to be offered.  When money is so tight, there is little room for creativity and finessing financial plans.’

(This blog is of a general nature about financial discrimination of individuals/singles.  It is not intended to provide personal or financial advice).

BOUTIQUE TAX CREDITS PUSHING SINGLES INTO POVERTY-Part 2 of 2

BOUTIQUE TAX CREDITS PUSHING SINGLES INTO POVERTY-Part 2 of 2

These thoughts are purely the blunt, no nonsense personal opinions of the author and are not intended to provide personal or financial advice.

six-reasons-why-married-coupled-persons-are-able-to-achieve-more-financial-power-wealth

(The last two posts discussed how detrimental boutique tax credits can become to the financial well-being of a country and its citizens.  These were based on ‘Policy Forum:  The Case Against Boutique Tax Credit and Similar Expenditures’ by Neil brooks (abstract).

This post itemizes four personal finance cases showing how certain family units may benefit far more  than other family units like ever singles and singles with children).

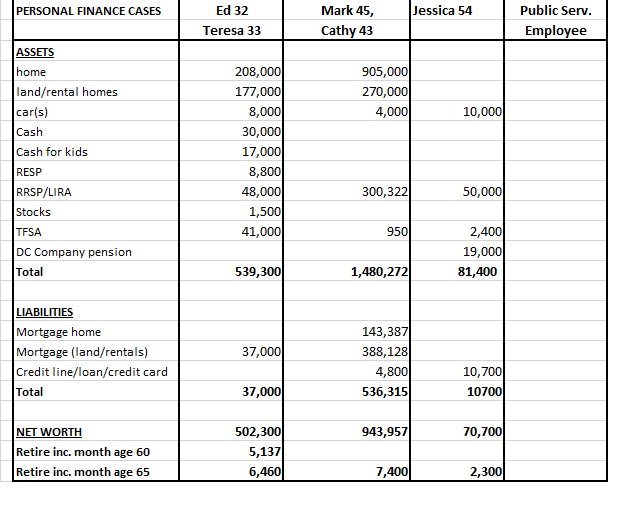
CASE 1 – Financial Post Personal Finance Plan, June 11, 2016 – ‘Farm Plan Risky for Couple with 4 Kids’ (financialpost)

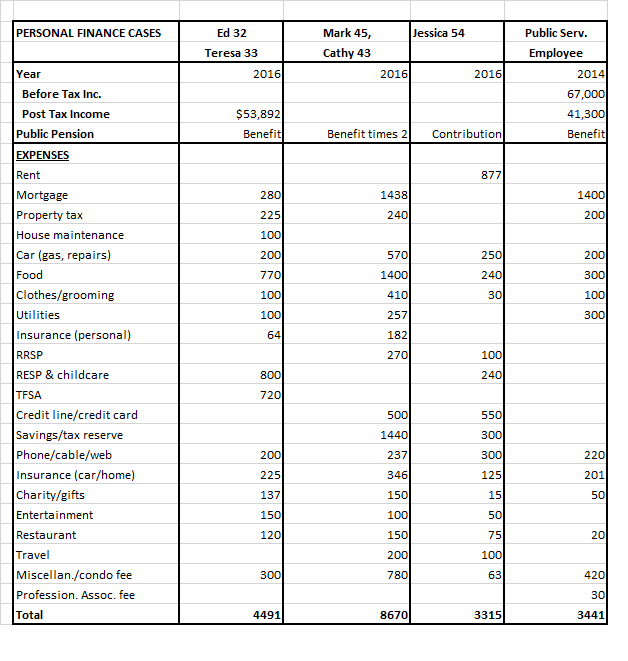
Ed age 32 and Teresa 33 have four children ages 5, 3, 1 and newborn in British Columbia. Ed works for a government agency, Teresa is a homemaker.  At age 32 and 33, already have a net worth of $502,000 ($208,000 home not in the Vancouver area fully paid and $177,000 land with $37,000 (21%) mortgage.  They would like to sell their house, move out of town and set up a small farm.  Ed would give up his government job and secure income by selling eggs and produce.  Would like to retire with about $4,000 in present-day dollars and after tax.

Ed brings home $2,680 per month plus tax-free Canada Child Benefit (CCB) $1,811 for their four children, all under the age of 6 for total family disposable income to $4,491 per month (CCB is about 40 per cent of take-home income.  (When all four children are ages 6 to 17, the CCB will be $1,478 a month based on 2016 rates).

Financial Planner’s Recommendations – Maximize Registered Education Savings Plans (RESP), so they can capture Canada Education Savings Grant (CESG) of $500 per beneficiary for total of $7,200 (three per cent annual growth after inflation would generate about $270,000 or about $67,500 per child for post secondary-education).  Advice is that Ed continue working until the age of 60 and when the youngest child is 18.  Advice is also given for purchase of the farm, details of which will not be discussed here.  Each spouse would add $5,500 to their TFSAs for every year until Ed is age 60.

At retirement, if Ed retires at age 60 and Teresa continues as a stay at home spouse, in 2016 dollars they would have a total pre-tax income of $68,495, or $5,137 per month to spend after 10 per cent tax and no tax on TFSA payments.  At age 65, they would have total income of $86,163 with no tax on TFSA payouts and pension and age credits or $6,460 a month to spend.

If they follow financial planner advice for retirement at age 60 and maxed out contributions of RESPs and TFSAs, rough calculations show they will have received approximately $339,000 child benefits, $308,000 tax free TFSA savings  and $28,800 RESP government grants for total $675,800.  This does not include all possible benefits from other sources such as provinces, GST/HST credits and interest generated from investments.  If Ed is deceased before Teresa, as a widower Teresa will receive even more benefits as a survivor with survivor pension benefits.

All things remaining the same their assets at age 60 with farm/house $485,000, RRSP $48,000, and TFSA $349,000 will equal a total of $882,000.  So, at age 60 they will have assets close to millionaire status while paying very little in taxes.  (Financial Post rating – two stars out of five).

CASE 2 –  Financial Post Personal Finance Plan, March 24, 2016  ‘Couple sick of existing like college student are living below their means, but could still use a financial tuneup’ (financialpost)

Ontario couple Mark 45 and Cathy 43 have two kids 9 and 12 and bring home $8,670 per month ($7,000 from jobs and net rent income $1,670 from two rental properties that produce good income  in North).  At ages of 45 and 43 they already have assets of $1,480,272 including RRSPs of $300,322, liabilities of $536,315 for net worth of $943,957. Their two cars are 10 and 15 years old.  They feel like they are living like college students. Mark’s job is not secure and produces a lot of stress. They have not contributed to children’s RESP and 130 year old house requires repairs.

Financial planner advice is to restructure their finances, put money into RESPs for children and maximize RRSPs.  Both spouses have defined benefit pension plans from past employment..

At retirement pensions, RRSP, rental income and CPP/OAS at age 65 would generate  pre-tax income of $105,672.  After age and pension splitting, after-tax income at 16% tax would be about $7,400 a month.  Financial planner states they would have surplus income for travel and pleasure which they now forego, (plus they will still have assets of home and rental properties). (Financial Post rating – four stars out of five).


CASE 3 – Financial Post Personal Finance Plan, May 21, 2016 ‘Home Ownership Possible but Tight’ (financialpost)

Jessica, age 54 lives in Ontario and has three grown children.  She would like to buy $150,000 house in small town Ontario.  Assets are $40,000 LIRA, $2,400 in TFSA, $10,000 RRSP and $19,000 in company defined contribution pension plan, car $10,000 and debts of $10,700 for $70,400 net worth total.  Her take home pay is $3,315 per month. She puts $240 in TFSA, $100 in RRSP and $300 in non registered account per month. “Her outlook is to retire in 10 years, but that will be struggle.  She has to make a middle income (so stated) go a long way”.

Financial planner advice is to pay off debts in nine months.  Advice is given for purchase of a home with three per cent twenty five year mortgage and saving for retirement but it will be on a financial shoestring.  At retirement and after age and pension credits and 10% tax, she should have take home pay of $2,300 per month.  Final comment:  “her retirement will be hostage to unexpected expenses.  But she will have the security of a home of her own”.  (Financial Post rating two stars out of five).

CASE 4-Public Service Canadian employees

In same job/wage categories with 2013 annual income around $67,000 for never married singles, no children (calculations may vary slightly in provinces regarding tax and other deductions) approximate payroll deductions include income tax $11,000, CPP and EI $3,200, union dues $900, public pension contributions $5,300, RRSP deductions $3,500, parking $1,200, health premiums and insurance $600, for total of $25,700.  This leaves $41,300 take home yearly income or $3,441 per month.

personal finance cases 1

personal finance cases 2

CONCLUSION

The above four cases show four distinctly different cases, two family units with children, one single parent family unit with children and one family ever single family unit.

  • It is astounding how two parent family units with children can accumulate wealth while single parent and unattached person family units struggle to live on on $3,300 and $3,400 after tax dollars per month or $39,600 and $40,800 annually while working and into their retirement years.
  • It is absurd that tax credits should comprise 40 per cent of a family’s income when  they have the ability to become wealthy enough to not have to pay mortgage or rent. In some provinces, singles cannot have assets of more than $7,000 to get affordable housing, so why should families have assets of half a million dollars and still get full child tax credits?
  • It is absurd that a family unit never pay full taxes at any time during child rearing years only to have the ability to retire early at age 60 and have more retirement income than they had during child rearing years  and have paid little or no taxes.
  • It is absurd to claim poverty because of what it costs to raise children when in age thirties and forties family units with children already have assets of half a million dollars and higher.
  • It is absurd that married/coupled family units with children in retirement pay less than 20 per cent in taxes on very healthy retirement incomes because of pension spitting and other credits.  Where is fairness when they pay same or less level of taxes as singles on lower incomes?
  • Financial planner calls Jessica’s income middle class, but she has difficulties living on it.
  • Married or coupled family units possibly have a much better retirement life than singles in family units with and without children.  (Singles with children generally have the greatest financial struggle).
  • Life during working years is just as difficult for singles as it is for married or coupled family units.
  • Government, politicians and families need to consider all family units in financial formulas.  These should be based on equivalence scales to provide financial fairness for all family units.  Financial fairness should include not only income, but also assets.
  • It should also be stated that when examining many of the Financial Post profiles for divorced persons with children, particularly those beyond child rearing years, many appear to have assets beyond $750,000.  How is this possible?  One reason might be inherited wealth.  Second reason which has been stated over and over again in this blog is the ability for married/coupled persons with children family units to gain wealth and, therefore, already have considerable wealth when they are divorced later in life.

LESSONS LEARNED

IT IS INHERENTLY WRONG FOR GOVERNMENTS TO NOT INCLUDE ASSETS AS WELL AS INCOME WHEN DOLING OUT TAX CREDITS.  THESE CREDITS SHOULD BE GIVEN TO THE POOR, NOT THOSE WITH LOW INCOME AND WEALTHY ASSETS.  BETTER YET,  TAX CREDITS SHOULD  BE COMPLETELY ELIMINATED AND REPLACED BY TAXES WHICH ARE BASED ON  INCOME AND ASSETS.

(This blog is of a general nature about financial discrimination of individuals/singles.  It is not intended to provide personal or financial advice).
BOUTIQUE TAX CREDITS INCONSISTENT AND FINANCIALLY DISCRIMINATING (Part 2 of 2)

BOUTIQUE TAX CREDITS INCONSISTENT AND FINANCIALLY DISCRIMINATING (Part 2 of 2)

These thoughts are purely the blunt, no nonsense personal opinions of the author and are not intended to provide personal or financial advice.

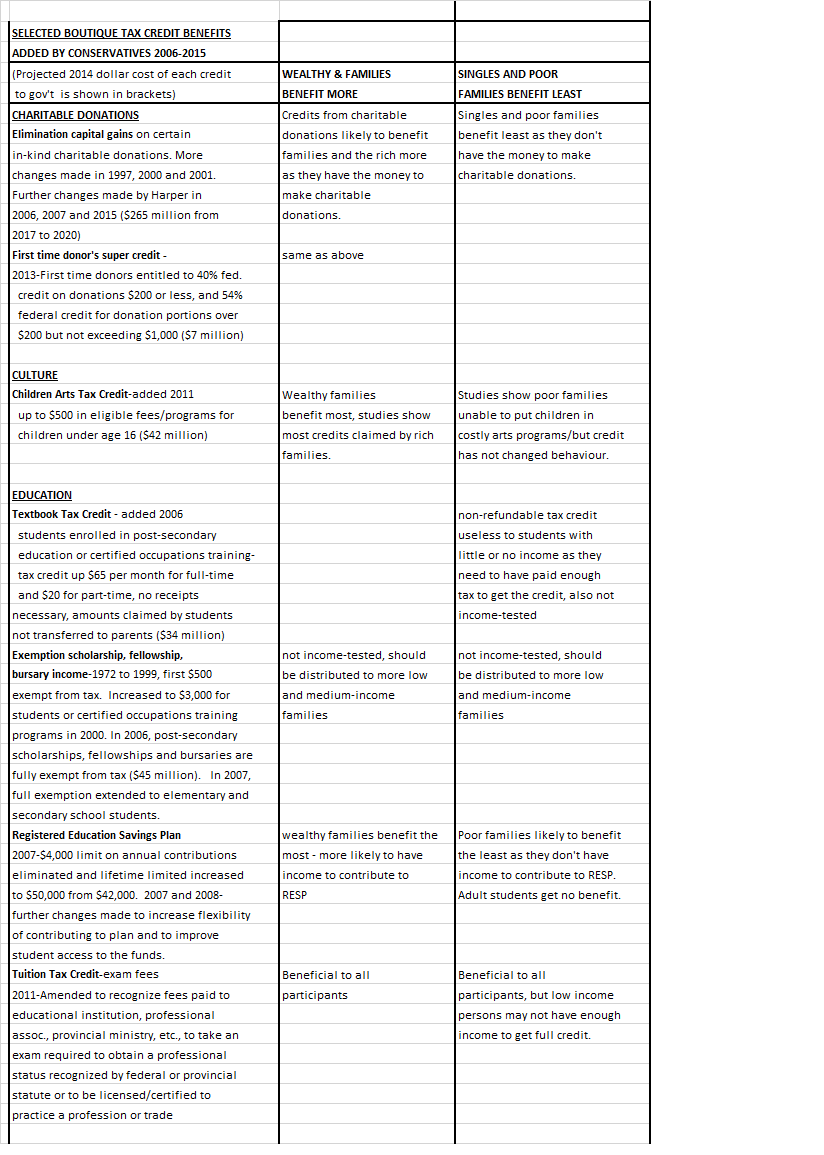
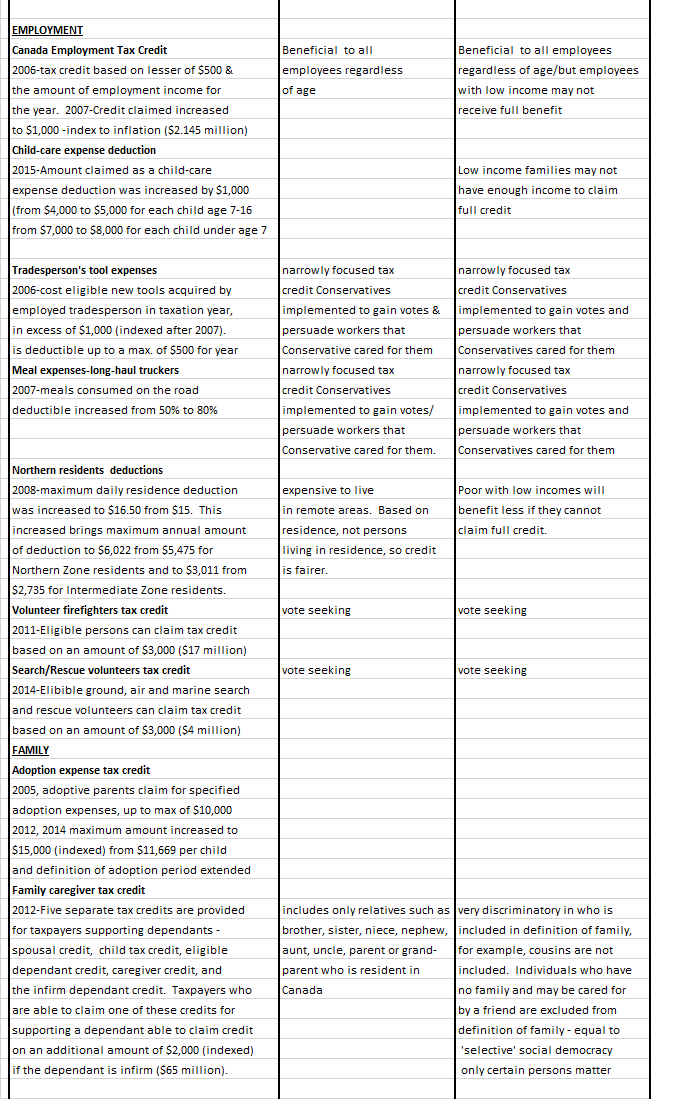
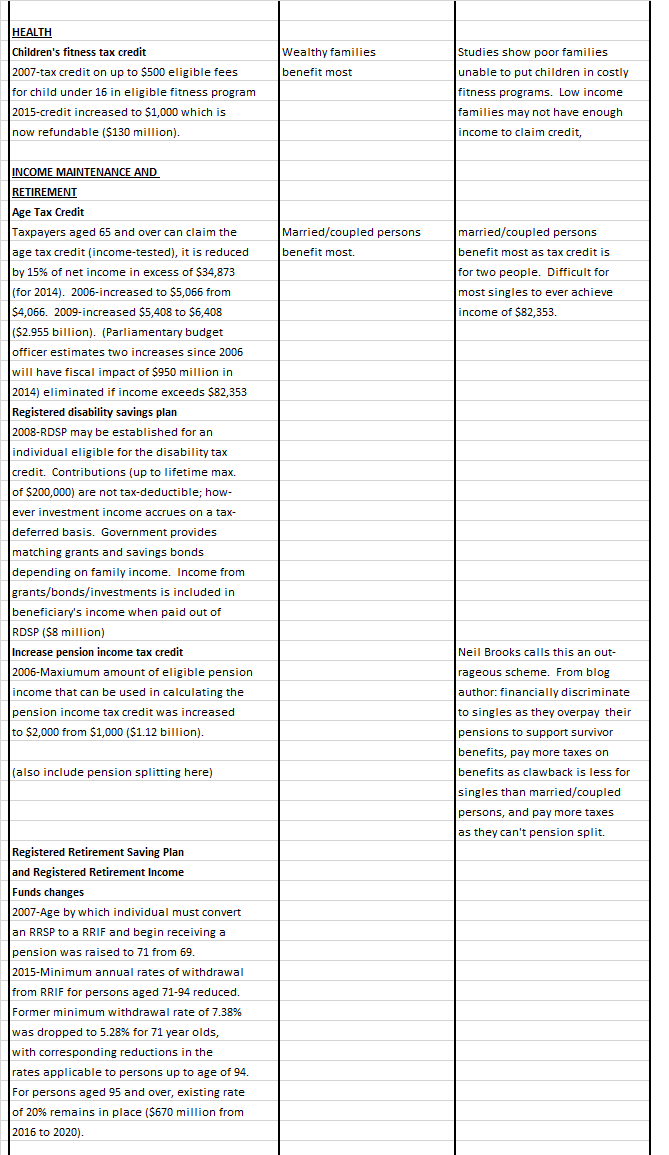
(The following information is taken from:  Policy Forum: The Case Against Boutique Tax Credits and Similar Tax Expenditures by Neil Brooks (brooks) (abstractwhich show SELECTED TAX EXPENDITURES INTRODUCED OR SUBSTANTIALLY AMENDED FROM 2006 TO 2015 (page 129).  His article states:  

The table that follows lists selected tax expenditures introduced or substantially amended by the Conservative government between 2006 and 2015. These tax expenditures are listed under the headings and in the order shown in the Department of Finance’s Tax Expenditures and Evaluations 2014. To provide some context, a few of the listings have a brief introduction. The year in parentheses following the listing is the year the measure was introduced or enriched. The projected cost for 2014 of new and amended tax expenditures is then given, if it was provided in that year’s tax expenditures and evaluations report.

Where the tax expenditure takes the form of a tax credit, the table indicates the amount of the credit. The actual value of the credit to the taxpayer is almost always 15 percent (the lowest federal tax rate in 2015) of the amount claimed by the taxpayer.  For example, although the maximum amount of the children’s fitness tax credit was increased to $1,000 in 2015, the maximum federal tax saving to the taxpayer is $150 ($1,000 × 0.15).

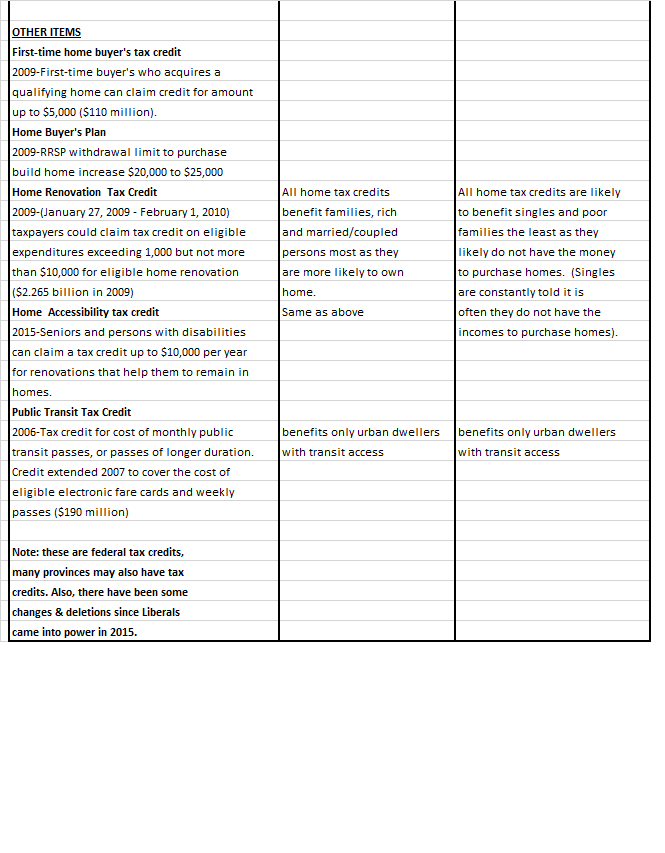
Some of the costs to the government as outlined in the Brooks article for the Selected Boutique Tax Credit Benefits are as follows:  charitable donation benefits and exemption of capital gains $265 million from 2017 to 2020,  first time donor’s super credit $7 million, children’s arts tax credit $42 million, textbook tax credit for post-secondary education and certified occupational training $34 million-amount claimed by students (not transferred to parents), post-secondary scholarships, fellowships, and bursaries exempt from tax $45 million, Canada employment tax credit $2.145 billion, volunteer firefighters tax credit $17 million, search and rescue volunteers tax credit $4 million, family caregiver tax credit $65 million, age tax credit $2.955 billion 2009 (parliamentary budget officer estimates that the two increases in the age credit since 2006 will have a fiscal impact of $950 million in 2014), registered disability saving plan $8 million, pension income tax credit $1.12 billion, changes to registered retirement savings plans and registered retirement income funds $670 million from 2016 to 2020, first-time home buyer’s tax credit $110 million, home renovation tax credit $2.265 billion in 2009), public transit tax credit $190 million.

(It should be noted that some of these have changed or been deleted since the Liberal party won the 2015 election).

Table – page 1 of 4

boutique tax credit 5

Table – page 2 of 4

boutique tax credit 6

Table – page 3 of 4

boutique tax credit 7

Table – page 4 of 4

boutique tax credit 8

This blog is of a general nature about financial discrimination of individuals/singles.  It is not intended to provide personal or financial advice.


CANADIAN SNOWBIRDS LIKELY RICH CANADIAN FAMILIES FINANCIALLY DISADVANTAGING SINGLES AND THE POOR

CANADIAN SNOWBIRDS LIKELY RICH CANADIAN FAMILIES FINANCIALLY DISADVANTAGING SINGLES AND THE POOR

These thoughts are purely the blunt, no nonsense personal opinions of the author and are not intended to provide personal or financial advice.

Who are the Canadian Snowbirds (Canadians who spend winter outside of Canada)? They are Canadians who spend up to approximately 182 days or six months out of Canada and in the United States each year usually during the winter season.

A new system is being implemented whereby Canadian snowbirds will be able to be tracked more easily for financial fraud during their snowbird stays.  Some snowbirds think they should be able to stay longer than six months in the USA.

According to MoneySense, ‘Follow the Flock South, October 8, 2013 moneysense more than one million Canadians age 55 and up lead lifestyle of snowbirds.

Avoiding the Snowbirds’ Trap’ thestar article states:

  • ‘that the study by the University of Florida Bureau of Economic and Business Research revealed that Florida’s five-million population over 55 swelled by more than a million people every winter, and 82 per cent of these snowbirds came from Canada.  The study stated that not only are the number of snowbirds continuing to increase, encouraged by the dollar and cheaper real estate, they are getting younger as baby-boomers retire.
  • There are trade-offs that have to be made.  The winter snowbirds have a large impact on life in Florida.  One of the complicating issues is that those people are only in the state for part of the year.
  • State and county governments responsible for roads and transportation are often caught in a quandary of whether or not to improve infrastructure to cope with the winter traffic jams, or plan around the six summer months when the snowbirds have left and roads, public transit, even retail malls are relatively deserted.  One key finding of the study was that 81 per cent or 500,000 snowbirds spending their winters in Florida actually own their secondary home in the sunshine state.
  • Canadians are the biggest foreign purchasers of U.S. residential real estate and own an estimated $50 billion worth in Florida alone.
  • There also has been talk about proposed USA legislation creating a Retirees Visa, increasing the current six-month limit on a winter stay for snowbirds to eight months.’

Canadians snowbirds make their presence felt:  spending $5 billion in 2012, just in the big-four sunshine states of Florida, Arizona, Texas and California alone according to the Canadian Snowbird Association. snowbirds

The following article give some interesting facts of Canadian real estate purchases in the USA:  ‘2015 Profile of Home Buying – Activity of International Clients (Residential) in USA-April/14 to Mar/15′ realtor.org

  • In April, 2014 to March, 2015 homes estimated to be sold to foreign buyers were approximately 209,000 with total sales estimated to be $104 billion.
  • Fourteen per cent were from Canada (29,260 sales) with sales of $11.2 billion ($382,775 per sale).  About 47% of Canadian buyers bought for vacation properties and 12% for vacation and rental.  Types of housing purchased include 46% detached homes, 35% condos, and 12% townhomes.  Remaining 7% were commercial, land and other purchases.  On average Canadian buyers purchased properties valued at $380,000 and about 73% were purchased on an all-cash basis.
  • Dollar value of Canadian sales for 2009 $8.9 billion, 2010 $17.1 billion, 2011 $13.0 billion, 2012 $15.9 billion, 2013 $11.8 billion, 2014 $13.8 billion.
  • Fifty per cent of sales were in the four states of Florida, California, Texas and Arizona.
  • Foreign buyers tended to be upscale buyers (all buyers, not just Canadian) who paid overall USA average house price of $499,600 compared to average USA house price of about $255,600.
  • An average of 8% of USA residents were interested in buying in Canada in 2015.

SO WHO CAN AFFORD TO BUY SECOND PROPERTIES OUTSIDE OF CANADA AND RESIDE THERE FOR SIX MONTHS OF THE YEAR?

According to Statistics Canada there were approximately 5 million seniors age 65 and over in 2011.  About 47% are in family unit of two or more persons, the rest are singles and widowers.

One could probably estimate that most of the Canadian snowbirds are families as singles are less likely to be able to purchase a second home and stay in the USA for six months of the year. (See MoneySense All-Canadian Wealth Test below).   Forty-seven per cent of the 5 million Canadian seniors equals about 2,350,000 family units.  If 80% or 500,000 Canadians own second homes in Florida alone, that is a lot of money flowing out of Canada to the USA (another 20% of Floridian snowbirds do not own second homes in Florida).

WHERE IS ALL THE WEALTH GOING?

While wealthy Canadians are able to buy second homes and spend six month of the year outside the country, singles, poor families and the poor are left behind to support the country with money they don’t have.

One could say that if Canadian governments placed financial values for the country as one of their priorities, they would certainly not give future approval for outside the country stays over six months and they would maybe even shorten the stay to three or four months (added Arpil 26, 2016).

Yes, snowbirds still pay annual income taxes and property taxes, but  their houses are likely sitting empty for half the year.  Yes, they are not taking jobs away from USA citizens, but they also are taking their money away from Canada and spending it in the USA. Comments listed at the end of this post shows how entitled these rich snowbirds feel with no regard to what is happening financially to the country of which they are citizens.  (The last comment is one of better ones).

‘Money Sense “All Canadian Wealth Test’ 2009’ moneysense – Quote:  While incomes are far from equal, wealth is even more unbalanced. The richest 20% of Canadian households control about 69% of the wealth in Canada. The next quintile down possesses a further 20% of the net worth. Not much is left over for other people. The bottom 60% of households control only 11% of Canada’s wealth. In fact, the bottom fifth of the population possess no wealth and actually owe a few thousand dollars more than they own.

Families of Two or more Income 2015 MoneySense All Canadian Wealth Test (based on 2011 data) moneysense.2015

Upper-middle 20% quintile      $88,075 to $125,009

Highest 20% quintile                $125,010 and up

Families of Two or More Wealth 2015 MoneySense All Canadian Wealth Test (based on 2011 data)

Upper-middle 20% quintile       $589,687 to $1,139,488

Highest 20% quintile                 $1,139,489 and up

Above amounts are misleading as they include single parents with children.  If these persons are removed from the totals, net worth is probably much higher.

The Upper-middle 20% quintile of unattached individuals had a net worth of $128,068 to $455,876 and the Highest 20% quintile $455,877 and over.  (Does this include widowers? If it does, they are more likely to have greater net worth than ‘ever’-never married, no kids singles or early in life divorced/separated singles.)

The number of census families in Canada—married couples, common-law couples and lone-parent families equalled about 9.4 million families in 2011.

According to Statistics Canada there were approximately 4,945,055 seniors aged 65 and over in Canada in 2011.

Senior families of two or more persons comprise about 44% of the population, singles 13% and widowers 43%.

Opinion comments submitted by readers in response to the articles

From “Crooked Canadian Snowbirds risk losing their benefits under new security program” bnn.ca/News

-’Crooked Canadian Snowbirds??? Gimme a break.. The snowbirds you are talking about worked hard, saved and now are just wanting to enjoy some winters away from the cold and wet before the rising cost of health insurance keeps them hostage in Canada.  They are not taking any jobs from Americans and are not impairing the Canadian economy in anyway; cut them slack and stop making them out as criminals.


-By leaving the country for more than six months, you are spending your money elsewhere and not on the Canadian economy.  You will also lose health benefits such as the provincial health care that is free to Canadian citizens.  If you leave the country for more than six months, you should not be able to retain these benefits.  These are all costly benefits paid into and by taxpayers that should not be taken advantage of by anyone…Winter is only for six months.  I am one of those who runs away from winters, and that is more than enough time!!!’

From “Canadian Snowbirds Risk Losing Benefits under New Exit-Tracking System” snowbirds

-Snowbirds that spend six months in warmer countries pay for all year health care fees (British Columbia), income tax, property tax, but only use it for six months.  The government should be happy with it.  Nobody is exploiting the system.  Seniors have worked all their lives to pay for what the younger generation has now, so now it is time for the younger generation to pay for the next one and leave seniors alone.  They did their jobs and paid their dues.


-I used to work for (government) investigations and at that time we were uncovering $10 of fraud for every $1 spent on detecting it.  So you would have expected that the Government would hire more investigators until the ratio became 1-1.  However, it is difficult to convince voters that the government can save money by hiring more public servants.


-Provided they also go after rich tax cheats and their offshore tax havens, I’m fine with this.  It’s a myth that if you pay into a program, you’re automatically entitled to a benefit.  You’re only entitled to the benefit if you meet the criteria…in this case, the criteria is that you physically be in Canada for a certain portion of every year.  The programs are most often income supplements…not ‘retire in the sun’ strategies.  To think otherwise is the ultimate ‘entitlement mentality’.


-I will be judged for smamming my parents here, but this fits them to a tee.  Many years ago retired…early.  Moved from northern community to a border community.  Shop over the border every single day for everything.  They go to Florida 6 months a year.  Then come home and complain about Canada for the other 6 months.  We discussed (if one could call it) this once.  My parents were once proud Canadians.  Started with little, had children, used all the services available to them, for us.  As soon as they got what they needed.  BOOM.  Repubs overnight.  ‘Why should I pay for health care taxes for someone else?  We are never here’. Reminding them that they were part of the systems they used, while they were a young family fell on deaf ears. Children are not born selfish and greedy.  They are taught these terrible qualities.  I do agree we should be going offshore hunting for tax evaders, but this is a serious issue as well.  I remember suggesting to them ‘Why don’t you just move down there full time’?  Verbatim – ‘We will lose all our pension and health’.  Fools!’

End of comments.

This blog is of a general nature about financial discrimination of individuals/singles.  It is not intended to provide personal or financial advice.

HOW MANY MORE DECADES WILL IT TAKE TO ERASE FINANCIAL DISCRIMINATION OF SINGLES?

HOW MANY MORE DECADES WILL IT TAKE TO ERASE FINANCIAL DISCRIMINATION OF SINGLES?

These thoughts are purely the blunt, no nonsense personal opinions of the author and are not intended to provide personal or financial advice.

In the discussion of financial discrimination of singles, it is useful to look at the history of financial discrimination.  Two women who were strong advocates of financial equality were Marie Babare Edwards and Vivien Kellems.

Marie Babare Edwards (January 2, 1919-December 31, 2008) , was a psychologist who helped pioneer a “singles pride” movement in the 1970s through her book (co-author Eleanor Hoover), “The Challenge of Being Single,” and workshops she taught died two days before her 90th birthday.  Her 1974 book included a “A Singles’ Lib Manifesto” and spelled out the unfair costs of being single in taxes, the workplace, insurance, and housing.

Divorced after 11 years of marriage and rearing her 9-year old son alone, Edwards found herself suddenly in sync with a third of the adult U.S. population that was single — then 43 million people.

Edwards became a zealous advocate for equal social status for the never or formerly married.

Kay Trimberger, a sociologist and author of “The New Single Woman” (2005), called Edwards forward-thinking, “a pioneer, writing about the social issues of singles before it was popular. For that reason, her writing sort of got lost.”

Edwards considered the book and seminars through most of the 1970s, “my most significant contribution as a psychologist,” she later wrote, because she helped “individuals and institutions appreciate singlehood as an alternate and viable lifestyle.” (She was an extrovert who came close to remarrying several times.)  (latimes)

Vivien Kellems (1896-1975), tax resister, feminist,  industrialist and runner as a senator, fought for numerous causes during her lifetime. While she believed in equality for women (in the workplace and in the home), and she proved an avid supporter of a woman’s right to vote.  However, some of her most contentious fights were  Kellems’ highly publicized battles with the Internal Revenue Service(IRS).

Already a prominent industrialist in Connecticut, she waded into the fight for the Equal Rights Amendment.  In stating her case, she put forward her own brand of individualist feminism. By contrast, many “social feminists” at the time such as Eleanor Roosevelt opposed the ERA because it would strike down “protective legislation” for women. In 1943, Kellems asked “what are you going to do with all these women in industry? If we’re good enough to go into these factories and turn out munitions in order to win this war, we’re good enough to hold those jobs after the war and to sit at a table to determine the kind of peace that shall be made, and the kind of world we and our children are going to have in the future.”

In the years that followed, Kellems continued to battle the IRS.  Protesting that tax laws unfairly penalized unmarried individuals, Kellems never filled out another tax return. She, instead, signed blank returns every year and sent them to the IRS. She continued her fight for tax law reform right up until her death in 1975. (connecticuthistory and historynewsnetwork)

MORAL OF THE STORY

Kellems’  fight for financial equality covered several decades, notably the 1940s to the 1970s.  Marie Babare Edward’s book in 1974 was published about forty years ago.

So how far have we come in the last sixty to seventy years in eliminating financial discrimination of singles (‘ever’ singles and early divorced)?

In Canada, while we do have equality in taxes being equal for individuals regardless of marital status, we do not have equality in singles receiving benefits equal  to marital  benefits and equal inclusion in financial formulas with married/coupled persons and widowers.

Much work still needs to be done.  The question is how many more decades is it going to take to have true financial equality for singles?

This blog is of a general nature about financial discrimination of individuals/singles.  It is not intended to provide personal or financial advice.

EVALUATION OF MONEYSENSE ARTICLES RE THE COST OF RETIRING WELL: COUPLES VERSUS SINGLES, DECEMBER, 2014 AND JANUARY, 2015.

EVALUATION OF MONEYSENSE ARTICLES RE THE COST OF RETIRING WELL:   COUPLES VERSUS SINGLES, DECEMBER, 2014 AND JANUARY, 2015.

These thoughts are purely the blunt, no nonsense personal opinions of the author and are not intended to provide personal or financial advice.

SOURCES OF INFORMATION FOR THIS BLOG POST

MoneySense, December, 2014, “The Cost of Retirement Happiness” by David Aston (couples) /the-cost-of-retirement-happiness/

MoneySense January, 2015, “Single Retirees: The Power of One” by David Aston (singles) /single-retirees-the-power-of-one/

Kudos to MoneySense-they are one of the few sources of information that identify what it truly costs singles to live in comparison to married/coupled persons.

——————————————————————————————————————–

The above articles for couples and singles were presented in two different timeframes by MoneySense.  financialfairnessforsingles.ca thought it would be an interesting exercise to combine the figures from both articles and complete an analysis of the figures for the married/coupled retirees versus the singles retirees.  (It is important to note that the definition of ‘single’ status by MoneySense is not the same definition used by financialfairnessforsingles.ca and Statistics Canada.  The only person who is truly single in the six profiles is Spencer as an ‘ever’ single person (never married, no children), while Reynolds is divorced and McDonald is widowed.  This is based on and justified by the Canadian Income Tax forms where the status of the tax filer has to be entered re status of married, single, divorced/separated or widowed and Statistics Canada definitions of marital status).

MoneySense Comments on Retirees Incomes

Couples – According to MoneySense author, a couple should be able to have a middle-class retirement lifestyle spending $42,000 to $72,000 a year including income taxes and assuming there is a paid-for home and no debt.  After tax, that will leave about $38,000 to $62,000 a year to spend as couples choose.  The minimum of about $38,000 (excluding taxes) should be sufficient to cover the basics, including operating a car and eating healthy.  Money Coaches Canada advises keeping annual spending on the basics within the $25,000 to $35,000 range, while trying to ensure there is at least $10,000 for extras, (Dec. /14, article).

Singles – According to MoneySense author, a middle class single retiree should count on spending approximately $30,000 to $50,000 a year including taxes and assuming there is a paid-for home and no debt.  This is about 70% of what is required for a couple since it costs about 70% of the couple’s rate for a single to maintain the same lifestyle as a couple.

For $30,000 income, taxes would be about $2,000 to $3,000 for older singles and $3,800 to $5,100 for younger singles below age 65.  After taxes and if budget is tight, singles should allow at least $20,000 to $25,000 a year for the basics (including shelter, groceries, transportation and clothing) and at least $5,000 for the extras like entertainment and travel, (Jan. /15, article).

Detailed Financial Information

Couples

Case #1 – It is stated that the Taylors live frugally but comfortably.  They have a paid-for three-bedroom home in a nice neighborhood and a ten-year old mid-level car. They eat out occasionally and take regular vacations.  They spend just over $25,000 on the basics, which leaves enough left over to spend almost $12,000 on the extras.  They both have university educations and held high-paying jobs in the technology industry while raising one child, who now lives independently.  Their modest spending habits allowed them to build their savings quickly while working, so they were able to retire in their early 50s and have a large nest egg.

Many advisers tell prospective retirees that they need to replace 70% to 80% of the peak income they had while working, but the Taylors live on less than 20% of the $250,000 they earned while working.

Case #2 – The Statscan couple depicts the average spending by senior couple.  (Source: Statistics Canada, Survey of household spending in 2010) plus inflation adjustments using the Consumer Price Index.

Case #3 – The Coopers, both close to 70, have lots of money to do the things they consider important, but don’t live a lavish lifestyle.  They spend modestly on the basics, which leaves plenty for the extras that give them the most satisfaction, like travel.  Their basic spending, at just under $45,000, isn’t much more than that of the Statscan couple.  But by economizing on the basics, they can afford to spend about $36,000 on the extras.  They learned frugality early on in life.  During their working years, they lived on his public sector professional salary while she had primary responsibility for the household and raising three children.  They also benefitted from his pension plan and saved by living well within their means and invested wisely. They have two vehicles (buy them used and keep them well beyond ten years).  Now they have far more money than they need to support their accustomed lifestyle.

The Coopers love to spend money for the benefit of their extended family.  They have a two-bedroom condo in the city as well as a vacation property.  They use their $16,000 travel budget for regular vacations.  They even spend some of their budget to cover the cost of extended family joining them on vacation.  They also contribute to their grandkids’ RESPs.  And while the $6,000 they budget for charitable and personal gifts is not enormous, they have distributed around $500,000 to their kids over the years to give them a good start.

Singles

Case #1 – ‘Ever’ single Spencer is in her early 60s and had to stop working at her physically demanding public sector job over a year ago due to a repetitive stress injury.  She hopes to return to work in some role, but even if she is unable to work again she feels she can live comfortably and sustainably on what she now has in savings, as well as government and employer pensions.  She has a $38,000 budget and pays $5,000 in income tax. Based on having a paid-for home she will spend about $23,000 on basics which leaves about $10,000 left for the extras.  She recently made the choice to move to a small town, mainly for the small town lifestyle, but also for the lower cost of living as well.  Money has been set aside to purchase a modest home.  (She does state that earlier in life she had some bad spending habits; however, she has learned to make careful, purposeful spending choices).

Case #2 – Reynolds in her early 60s (split up with her partner about ten years ago and no children?) is intent on making the most of retirement and has above-average means to do so.  Recently retired after a career in the public sector, she has a budget of $73,000 a year, including about $33,000 for the basics, and a sizeable $25,000 for the extras.  She likes to travel and has about $6,000 a year allocated to it.  In the early years of her career she was fixated on saving, which helped provide the ample nest egg she has today, including a group RRSP.

Case #3 – McDonald, a widower in his late 60s, has an above average budget of about $81,000, including $41,000 for the basics and $21,000 for the extras.  He uses his money to support hobbies, travel and spending on his two grown children and their families.  He is trying to find a balance between spending his money and leaving a large legacy.  He takes two to three trips a year with his $10,000 budget.  His budget also covers some travel for his children and relatives.  He spends quite a bit on groceries and restaurants, including paying for meals with extended family.  He happily spends less than his ample means would allow.

Qualifying Statements by MoneySense about the two articles

The MoneySense author along with Money Coaches Canada notes that the category ‘shelter’ includes property taxes, utilities, maintenance, house insurance, rent and mortgage payments.  Case #3 Statscan figures include a small proportion of costs attributable to a second home.  For the ‘vehicle’ category, $2,000 a year has been added for depreciation.  The category ‘home and garden’ includes cleaning supplies, furnishings, appliances, garden supplies and services.  The category ‘recreation and entertainment’ includes computer equipment and supplies, recreation vehicles, games of chance, and educational costs.

The author also makes the following qualifying statements: “If you are single, you know that retirement planning is tougher for you than it is for couples.  You have no one to rely on but yourself, and you can’t share expenses or split income.  As a result, you can’t just take the cost of retirement for couples and divide it by two. Situations vary, but a single person will need to spend roughly 70% as much as a couple to enjoy an equivalent lifestyle in retirement…The figure for couples isn’t twice the figure for singles–it is only about 40% higher because spouses are able to share costs for things like housing and cars.  The higher per-person income singles need also results in higher taxes”.

Table

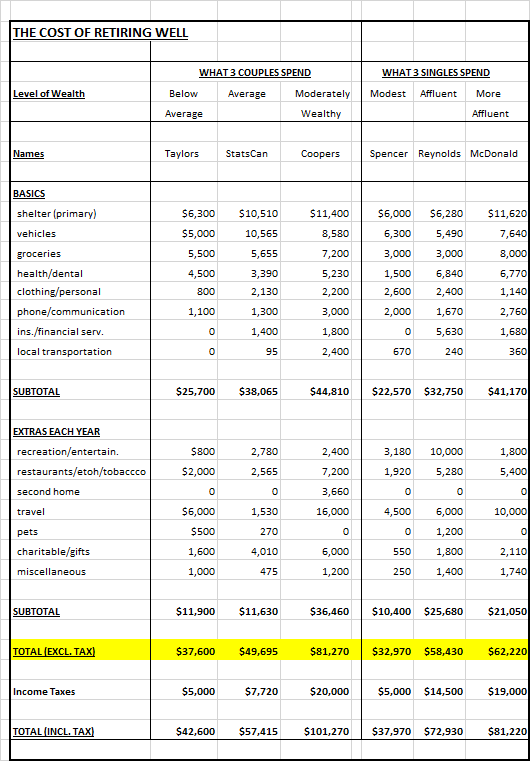
The following table combines the financial profiles of the three couples and three singles from the two articles into one table.

Following the table are financialfairnessforsingles.ca comments evaluating the results of the financial profiles.

moneysense cost of retiring well

Analysis of the Financial Profiles of Couples Versus Singles

Marital Status

First, it is important to get one fact straight.  Couples who divorce/separate and persons who are widowed are not singles.  The only person who is truly single in the six profiles is Spencer as an ‘ever’ single person (never married, no children).  The profile of the ‘ever’ single person shows that she is likely at the bottom of the financial status list in terms of wealth as she is the one with a modest home in a small town where it is cheaper to live.  The separated person likely has a better financial profile because she was able to accumulate wealth as a coupled person for twenty-five or thirty years and was separated later in life (if she had separated earlier in life, she likely would have a financial profile more equal to the ‘ever’ single profile).  All of the other profiles show that they have more wealth and homes in nice neighborhoods and even second homes (Coopers).

Benefits

Marital status also determines who is likely to have more benefits.  It can be assumed that the couples have the higher financial status simply because they are married or widowed.  The married profiles will most likely pay less income tax than the single profiles because couples receive two of everything, have the ability to pension split and can get survivor benefits when widowed, etc.   As retirees, the two profiles that lose on benefits are the ‘ever’ single person and the person who is separated.

It is stated that most of the couples have lived so frugally that they now have more money than they need, but at same time have three bedroom houses in nice neighborhood, vacation home, and can retire in their 50s and 60s with a very comfortable lifestyles.  This implies, even with frugality, they had plenty of money to spend and save as married/coupled families with children.

The single person is the one that has to move to a smaller town to lower living expenses while others are living in what appears to be substantial housing.

Taxes

On examination of the profiles, it is easy to see that the persons who are paying the most taxes are the ever single person, the separated person and the widowed person.  The Taylor couple pays the same taxes as the ‘ever’ single person (Spencer), but they have approximately $5,000 more in income and appear to have much more wealth in terms of assets (must be the pension splitting).  It pays to be married.  The Statscan couple pays less income tax (almost one half of the amount equal to 13.4%) than the separated Reynolds person (20%), but her income does not come even close to double of the Statscan couple.  The Coopers are paying only $20,000 on $100,000 income (20%).

The widowed person (McDonald) with all of his wealth is most likely receiving survivor benefits.  Did he pay extra for these benefits and why is he portrayed as being single?   If he is now single why should he receive anything more than the ‘ever’ single person and the separated person?

Benefits to Families of Coupled People

The profiles of the coupled persons and the previously coupled person (widower McDonald) blatantly state that they have more money than they can spend and have given generous monetary gifts, paid for the meals of their kids, grandchildren and extended family members, etc.

Married/coupled people or previously coupled people are often able to give exorbitant gifts, inheritances, etc. to family and extended family.  Does this not create a sense of entitlement for family, children and grandchildren who begin to expect this all the time? How does this extravagance teach frugality?

Emergency Monies

Where in any of these profiles has money been set aside for emergencies?  The person most likely to be unable to pay for financial emergencies due to illness, financial issues, etc. is the ever single person with the least accumulation of wealth.

Education, Education, Education!!!

It is beyond comprehension on how governments, families, society and think tanks lack knowledge and are financially illiterate on the true facts of how ‘ever’ singles and divorced/separated retirees are financially robbed to subsidize married/coupled retirees by paying more taxes while getting less benefits like pension splitting and widower benefits in this country.

Singles require 70% of the income/wealth of Couples

How many ways can this fact be stated and how many different sources of information does the government and society need to make changes on how singles are financially discriminated against in this country??  Do Members of Parliament ever think to include singles when making important decisions like pension splitting and benefits that benefit only the married/coupled and families of this country?  Government, businesses, society and media only ever talk about middle class families. Singles meanwhile have been financially discriminated against by their government and society.

 How expensive is it to raise a child?

So how expensive is it to raise one child, two children, and three children and still come out on top in terms of wealth in the personal profiles?  Governments, society and families, think tanks continue to talk about how expensive it is to raise a child, and yet many families are able to leave large legacies/inheritances to their children.  Unfortunately, based on the facts this seems to be based on the half-truths and lies of governments, society, families and think tanks.

Profiling

Singles are often profiled as having excessive spending habits/lifestyles while married/coupled persons are usually profiled as being frugal.  Married/coupled persons in their retired state are still profiled as being frugal even though they can give extravagant gifts (in one case around $500,000) to their children and grandchildren and spend more money on items like vacations.

 Happy, happy, happy!!!!!

In both articles the profiles and the author comments seem to imply that everyone is happy, happy, and happy with their financial status.  ‘Ever’ singles and divorced/separated retirees are blatantly told they should be happy with what they have even though they have been discriminated against financially.

‘Ever’ single persons and divorced/separated persons not so lucky to have achieved equivalent wealth (70%) of married/coupled persons as shown in above examples wish to state they are not happy with being financially discriminated against on every level of government and society.  They are not asking for more than married/coupled people.  They are asking for financial fairness.

FINAL STATEMENT

Governments, businesses, society, families, think tanks all maintain that the middle class is being affected most by poverty.  The real truth is that ‘ever’ singles, singles with kids, persons divorced/separated early in marriage/coupling, and families with low incomes are being affected most by poverty.  Singles (‘ever’ and divorced/separated) in this country are not happy with always being excluded from financial formulas and conversations.  They are human and in their humanity are equal to married/coupled people, and it is time that they are treated with the same financial fairness, dignity and respect as married/coupled people.

This blog is of a general nature about financial discrimination of individuals/singles.  It is not intended to provide personal or financial advice.

MONEY BENEFIT PROGRAMS FINANCIALLY BENEFIT MARRIED/COUPLED PERSONS AND FAMILIES MORE THAN SINGLES

MONEY BENEFIT PROGRAMS FINANCIALLY  BENEFIT MARRIED/COUPLED PERSONS AND FAMILIES MORE THAN SINGLES

These thoughts are purely the blunt, no nonsense personal opinions of the author and are not intended to provide personal or financial advice.

Married/coupled persons and families often receive ‘free money’benefits that financially benefit them much more than singles.

Two very good examples of these benefits are the Alaska Permanent Fund Dividend and the ‘Ralph Klein $400 Bucks’ Program.

Alaska Permanent Funds Dividends

The Alaska Permanent Fund Dividend (PFD) program implemented in 1982 is an annual payment paid to individuals (children as well as adults) rather than households.  It is paid irrespective of any income from other sources and does not require the performance of work or the willingness to accept a job if offered.  Unlike social assistance programs, it is not means-tested.

The book “Alaska’s Permanent Fund Dividend:  Examining Its Suitability as a Model”, edited by Karl Widerquist and Michael W. Howard states the following:

‘…..In 2008, when the PFD reached its highest level at $2,069, the individual  poverty threshold in the United States was approximately $11,000; for a family of four it was approximately $22,000.  Thus, at its highest level, the PFD would have provided less than 20 percent of the income necessary for an to individual to reach the poverty threshold, but almost 40 percent of the income necessary for a family of four to reach the poverty threshold……Thus, on basis of its level alone, the PFD is at best a partial basic income…

Finally, because of its flat and universal nature, the PFD on its own makes a very modest contribution to the reduction of inequality.  But the PFD together with the elimination of the state individual income tax that was part of its founding has an overall regressive effect on income distribution.  To have a significant redistributive effect, the PFD would have to be recouped from wealthy individuals; in the absence of a progressive state income, consumption, or wealth tax, the PF would have to be distributed on a sliding scale with larger dividends given to those with less income from other sources, rather than as a uniform flat payment….

The PFD does serve as an excellent model for the conceptualization of natural resources as commonly owned—an important step along the path to acceptance of the idea of a basic income.  It provides a model of cash transfers to individuals without any stigma of dependence, fraud, waste, or failure—attributes often attached recipients of other government cash transfers.  The PFD’s funding source in natural resources rather than in taxes on individual income or wealth seems to exempt it recipients from any need to justify their use of the dividend, and to exempt the transfer as a whole from the ‘socialist’ label….’

It has been argued that it is preferable to have oil profits distributed broadly rather than end up in the pockets of only a few corporate executives, wealthy shareholders, and political cronies.

Alaska is the only state that does not collect sales tax or levy an individual income tax on any type of of personal income, either earned or unearned.  Every Alaskan, children as well as adults, receives a payment each year from the Alaska Permanent Fund Corporation.  The USA does not have child benefits, although there is a child tax credit system for parents or guardians of children under 17 who meet certain requirements.  (The PFD is taxable by the Federal government).

Further review of information shows that in 2002, the poorest 20% of Alaskans relied on their dividend for 25% of their total income….some Alaskans depend on their dividend for up to a quarter of their yearly income, especially Native Alaskans, who make up 15% of the population. Those in poverty brackets and many of those living a subsistence lifestyle cannot afford to lose the dividend as a source of income.

However, review of articles on this program also states that the sense of entitlement has been established where it is very difficult to reduce state spending in this particular benefit at the expense of politicians losing their jobs, because state residents view these dividends as ‘rights’, not ‘privileges’.

One could argue that monies are being given to children who have not earned that privilege.  They have earned no money and have not paid any taxes.

If one looks at the PFD contributions over a twenty year period (lifetime of a family with children) in comparison to singles /individuals, the financial unfairness becomes apparent very quickly.  From 1996 to 2015,the benefits have ranged from a low of $846 to a high of $2,072 annually.  For a family of four the twenty year total amounts to $113,156 and for a single/individual person the amount is $28,289.  A lot more can be done with $113,000 than $28,000.

Prosperity Bonus (‘Ralph Klein $400 Bucks’) Program

The Prosperity Bonus, also nicknamed Ralph (Premier of Alberta at that time) bucks, announced in September 2005, was the name given to a program designed to pay money back to residents of the province of Alberta as a result of a massive oil-fuelled provincial budget surplus.  This program gave $400 to every citizen of Albertan in the year 2005.

For a family of four, the benefit was $1,600, while a single/individual received $400.

ANALYSIS

‘Free Money’ Benefits allow families to achieve greater wealth than singles/individuals even though the children of these families have not earned any income or paid any taxes. Married/coupled persons without children also achieve greater financial benefits because of accumulated assets times two.

SOLUTIONS

To achieve greater financial equality between singles/individuals and married/coupled persons and families, the following suggestions are submitted:

  • Eliminate children from these programs until they reach the age majority since they have not made any contributions to the coffers in the form of salaries or taxes; rather, they are using resources such as education instead of contributing to them.
  • Top up benefits to singles at rate of 70 percent 1.4 Market Basket Measure to that of married/coupled persons as it costs more for singles to live than married/coupled persons living as a single unit (updated August 31, 2018).

This blog is of a general nature about financial discrimination of individuals/singles.  It is not intended to provide personal or financial advice.


CONTINUED FINANCIAL ILLITERACY OF FINANCIAL GURUS EQUALS FINANCIAL DISCRIMINATION OF SENIOR SINGLES (Part 1 of 2)

CONTINUED FINANCIAL ILLITERACY OF FINANCIAL GURUS EQUALS FINANCIAL DISCRIMINATION OF SENIOR SINGLES (Part 1 of 2)

(This blog is of a general nature about financial discrimination of individuals/singles.  It is not intended to provide personal or financial advice.)

In February, 2016 the Broadbent Institute and Richard Shillington of Tristat Resources in Canada has published the report:  “An Analysis of the Economic Circumstances of Canadian Seniors” http://goo.gl/HNP2Ee

The report information is mainly directed towards poverty of seniors without an employer pension plan (roughly 47 per cent) and therefore, many of these seniors have wholly inadequate retirement savings.

Using LIM (low-income measure) senior poverty has increased from a low of 3.9 per cent in 1995 to 11.1 per, or one in nine, in 2013.  The poverty rates for single seniors, particularly women (at nearly 30 per cent), are very high and need to be addressed, (Page 2).   (LICO, or Low Income Cut Off, is not used here because it is not a true income poverty indicator as it was set in 1992 where families spend 20 per cent more of their income on necessities than was typical and has not been reset since.)

(It should be noted in the report that single seniors does not refer to marital status, but the fact that they live alone.  Therefore, single seniors includes ‘ever’ singles, divorced/separated, and widowed seniors living alone.)

In Canada, the income-tested OAS (Old Age Security) and GIS (Guaranteed Income Supplement) benefits together provide a regular minimum economic guarantee and are used to supplement regular income (from CPP-Canadian Pension Plan, private pensions and private savings) to lift seniors out of poverty.

Some of  the key findings of the report include:

  • The proportion of the population receiving the GIS is higher for senior singles than couples, and higher for single women (between 44 per cent and 48 per cent) than for single men (between 31 percent and 37 per cent), (Page 3).
  • ‘Roughly half of those aged 55-64 with no employer pension  benefits….. have savings that represent less than one year’s worth of the resources they need to supplement OAS/GIS and CPP.  Fewer than 20 per cent have enough savings to support the supplemented resources required for at least five years, (Page 3)…..For those with incomes in $50,000-$100,000 range, the median value is only $21,000…..(Page 3).
  • The overall median value of retirement assets of those aged 55-64 with no accrued pension benefits is just over $3,000.  For those with annual incomes in the range of $25,000-$50,000. the median value is just over $250.  For those with incomes in the $50,000-$100,000 range, the median value is only $21,000, (Page 3).
  • Only a small minority (roughly 15-20 per cent) of middle-income Canadians retiring without an employee pension plan have saved….enough for retirement.  The vast majority of those families with annual incomes of $50,000 and more will be hard pressed to save enough in their remaining period to retirement (less than 10 years)…..(Page 3).
  • The seniors’ poverty gap is $2.5 billion in aggregate annually, due to the 719,000 poor seniors (469,000 singles and 250,000 living in an economic family.)  A 10 per cent benefit increase in the GIS to address this gap would cost $1,628 million, and would reduce the number of poor seniors (married/coupled and singles) by about 149,000, (Page 3).
  • In the recent election, the Federal Liberal Party promised to increase the GIS by 10 per cent for single seniors.  (NOTE:  this does not include coupled seniors).  A simulation using Statistics Canada’s Social Policy Simulation Database and Model (SPSD/M) suggests this would cost $700 million and remove about 85,000 single seniors from the poverty roles, with a reduction in the singles poverty rate of 5.7 percentage points, (Page 3).  (Singles poverty rate of 5.7 percentage points from approximately  28 per cent for senior single females, and 24 per cent for senior single males, that’s all???)

Factors Affecting Seniors Poverty

As of July 2015, the income-tested maximum annual OAS/GIS benefits for seniors aged 65 and over with no other source of income were $15,970 for singles and $25,746 for couples…..The GIS is phased out as income rises and is reduced to zero above an annual income (thus calculated) of $17,136 for single seniors and $22,068 for senior couples, (Page 9).

Reliance on the GIS is greater for single seniors than it is for senior couples across all age ranges…..  For example, 41 per cent of all seniors over 85 receive the GIS, while only 30 per cent of seniors aged 66-69 receive it. (Page 9).

Pension Coverage (Page 12)

The difference in incomes at retirement between those seniors with and without a pension income is stark…..The difference is not all due simply to the presence or absence of an employer pension plan.  Those who have had an employer pension plan are more likely to have had better paying jobs, and jobs with health and other benefits.  As well, it is possible for those who seek out jobs with a pension are more likely to be those motivated to save for retirement.  But certainly, participating in a pension offers advantages that make it easier to have a higher income at retirement, (Page 12).

For couples, those without pension income have significantly lower total incomes ($52,000) to compared to those with pension income ($68,000).  This is despite their higher income from earnings ($19,100 for those without pension income, compared to $7,200 for those with pension income).

For individuals, the story is very different:  They are more likely than couples to be over the age of 70, and much less likely to be employed.  For single women, the median incomes are $18,000 for those without a pension and $30,400 for those with a pension  For men, the medians are $19,000 and $37,300, respectively.  These gaps are significant, (Page 12).

LIM (Low Income Measure) is used in this report and is based on after-tax income to assess poverty of seniors.  This measure shows what proportion of persons have after-tax incomes that are less than half of the median or midpoint to comparable families.

Two criterion to assess adequacy of income at retirement are:  1)  poverty criterion, and 2) replacement rate concept, (Page 13).

Generally,  the median incomes for those without pension income is just over half for those with pension income, (Page 13).

The report goes on “to suggest that a significant proportion of those without an employer pension plan will not have saved adequately for retirement and will suffer a major loss of income”.

Retirement savings without employer pension (Page 14-16)

Report states that from Survey of Financial Security for 2012 about half of families (what is the definition of family here?) aged 55-64 without an employer pension have virtually no savings; indeed 78 per of them have less than $100,000 in retirement savings.  Lower-income families eligible for OAS/GIS along with CPP may still have little or no drop in income, however inadequate that income might be, (Page 14).

….Vast majority of these families with annual incomes of $50,000 and more will be hard pressed to save enough in their remaining period of retirement (less than 10 years) to avoid a significant fall in income.  It appears that at least 25 per cent have very limited retirement assets despite incomes of $50,000-$200,000, (Page 15).

The report does state that ‘analysis presented in tables is somewhat simplistic because it ignores the impact of public benefits (OAS/GIS and CPP) on the amount that future seniors need to save.  It is also accepted that many seniors need less income in retirement in order to maintain the standard of living that they had pre-retirement.  The actual replacement rate required-the ratio of post-retirement to pre-retirement income-varies by how it is measured (pre- or post-tax).  Seventy per cent is commonly used, although it varies by individual circumstances and tastes; higher values are more appropriate for the poor, and lower values are more appropriate for the very wealthy’, (Page 15-16).

Retirement savings compared to income (Page 16-20)

Tables show widespread under-saving using calculations of 70 per cent pre-tax replacement rate…

Some do not need to save for retirement to get 70 per cent replacement because their income is quite low (below $21,429 for singles and $35,714 for couples).  These individuals and couples were deleted from table 5…..,(Page 16).

To illustrate, a family with an income of $100,000 (pre-tax) is assumed to need $70,000 (70 per cent of $100,000), and will get roughly $25,000 in public support.  Thus, they will need to make up $45,000 per year from their private savings, (Page 16).

Even those with an income of more than $100,000 are unlikely to have more than five years worth of the required supplemental income in their retirement savings; only 21 per cent meet this criterion……(Page 17).

In summary, regardless of income, few of these families have enough savings to supplement their income for even one year.  Only 15-20 per cent have enough for five or more years. (Page 17).

…..Many of those who argue that there is no looming pension crisis have included home equity as a liquid asset.  This analysis has not treated home equity as a retirement asset because the replacement rate analysis has as its objective an income that allows one to enjoy a lifestyle comparable to that which existed pre-retirement.  We do not include home equity here because we accept that the pre-retirement lifestyle for many middle- and moderate-income Canadians include continued homeownership, (Page 19).

One Option:  Reducing seniors poverty with GIS

The report then makes suggestions for decreasing poverty rate. One option is reducing seniors poverty with short term changes to GIS.  One of the paragraphs is as follows:

Table 6 presents estimates of the poverty gap using Statistics Canada’s SPSD/M microsimulation model. The poverty gap is the total amount of money that would be needed to raise the incomes of all poor seniors to the LIM poverty line-ignoring any  behavioral impacts of the transfer programs used to achieve that goal…..The poverty gap is $2.5 billion in aggregate, which is due to the 719,000 seniors:  419,000 singles and 250,000 living in an economic family.  The average gap is $2,400 for singles and $5,500 for seniors in a family, (Page 20-21).

Table 7 represents the results of increasing the single and married GIS amounts by the same percentage.  One should keep in mind that there is an incentive for seniors to appear as singles to governments even if they are living as a couple.  This is because the GIS for senior couples is less than twice the amount for singles.  An increase in the GIS for singles only (with no increase for couples) would increase this so-called ‘tax on marriage’ and associated incentives.  This would encourage couples to hide their cohabitation from the authorities for financial reasons, (Page 21).

The notation (# 28) at the bottom of page 21 states:  While legislation treats those cohabiting the same regardless of their marital status, it is easier to deceive the government if you are not married.  (Really???  How is this so when single status needs to reported on income tax returns; lying about marital status is a felony?).

Taking one example (from Table 7) of the tabulated results, a 10.0 increase is estimated to increase the cost of the GIS by $1,628 million to yield a poverty rate of 10.5 per cent and to reduce the number of poor seniors by about 149,000, (Page 22).

The (Federal) Liberal Party’s proposal in the recent election was to increase the GIS by 10 per cent for single seniors.  The SPSD/M simulation suggests that this would cost $700 million and remove about 85,000 single seniors from poverty, with a reduction in the singles poverty rate of 5.7 percentage points.  While a reasonable starting point, clearly much more can be done to reduce the poverty rate, (Page 22).

Conclusions

Poverty rates for seniors have been trending up since 1995.  Rates remain unacceptably high for single seniors-particularly women-and the worsening trends in pension coverage point to further increases in poverty in the future.  The GIS is the most effective federal mechanism in the short term for reducing the poverty rate and the impact of poverty on seniors, and it can be targeted at senior singles who need it the most, (Page 23).

(This blog is of a general nature about financial discrimination of individuals/singles.  It is not intended to provide personal or financial advice.)


GOVERNMENT CPP BAFFLEGAB MORE IMPORTANT THAN FINANCIAL DISCRIMINATION OF SINGLES AND QUALITY OF LIFE

GOVERNMENT CPP BAFFLEGAB MORE IMPORTANT THAN FINANCIAL DISCRIMINATION AND QUALITY OF LIFE OF CANADIAN SINGLES

These thoughts are purely the blunt, no nonsense personal opinions of the author and are not intended to provide personal or financial advice.

There has been much discussion lately as to whether the CPP (Canada Pension Plan) system should be changed.  The objective of the government is for country to live in a society that takes care of its citizens.  The reality is that some citizens are being taken care of more than others, that is the rich and married/coupled persons while singles and low income are being financially discriminated against.

EXAMPLES OF FINANCIAL DISCRIMINATION

  • TARGETED TAX RELIEF PROGRAMS FOR SENIORS-The Federal Conservative government has a targeted tax relief program where a single senior can now earn $20,360 and a senior couple $40,720 before paying federal income tax.  Program claims that approximately 400,000 seniors (or 7 to 8% of total Canadian seniors) have been removed from the tax rolls altogether.  This so called tax relief for seniors allows federal tax relief for senior singles equal to $1,697 per month and for senior couples $3,393 per month.

The tax relief for senior singles hardly covers a rent or mortgage payment of $1,200 and $250 for food per month (Maslow’s Hierarchy of Need), but amply covers this amount for a senior couple.  For a couple $1200 for rent or mortgage and $500 for food leaves $1693 (or 50% of $40,000) for other necessities and medications and maybe even a nice little vacation all tax free.

It is a well-known fact that singles require more income to that of a married/coupled persons living as a single unit.  In Equivalence scales (Statistics Canada 75F0002M – Section 2 ‘The LIM and proposed Modifications’ (75f0002) (equivalence-scales) if singles are assigned a value of 1.0, then couples require 1.4 times for income, not 2.0. $20,360 times 1.4 equals $28,504 ($2,375 per month) (updated November 18, 2017).  If the federal government cared about income equality and quality of life for senior singles, it would increase the tax free amount for singles.  By not applying equivalence scales to  income for senior singles, they lose $678 a month or approximately $8,000 Lost Dollar Value annually in quality of  life to married/couple retired persons.  (From age 65 to 90, this amounts to $20,000).

When income for senior married/coupled persons is over $40,000 they again get another benefit, that is pension splitting, which singles cannot use increasing quality of life for married/coupled persons over senior singles.  This is a tax benefit piled on top of another tax benefit.

The number of senior ‘ever’ singles (never married, no kids) and divorced/separated persons comprises only about 13 per cent of the population, so how much would it cost to bring the quality of life for these citizens up to the standard of tax relief for married/coupled persons?  The answer is ‘not very much’ in comparison  to what has been given to  married/coupled senior persons.

“Ever” singles are told every day they are worthless and worth less than married/coupled persons even though they have worked 35 – 40 years subsidizing mother/baby hospital care, EI paternal/maternal leave, education taxes even though they have had no children and paid more taxes than families.

  • GOVERNMENTS IGNORE COURT RULINGSRe Allowance Program and Credits, (policyalternatives) 2009 Policy Brief, “A Stronger Foundation-Pension Reform and Old Age Security” by Canadian Centre for Policy Alternatives, page 4, states this program discriminates on basis of marital status as confirmed by case brought under Charter of Rights where federal court agreed program was discriminatory, and ruled it would be too expensive to extend program on basis of income regardless of marital status.’  So what is happening?  Age eligibility for Allowance will change from 60 to 62 beginning in 2023 with full implementation in 2029.  In this democratic, civilized country let’s just ignore federal court rulings and continue a $? million discriminatory program.  Article suggests that ‘OAS (Old Age Security) and GIS (Guaranteed Income Supplement) combined should be increased to at least bring it up to after-tax LICO (Low Income Cut Off) for single individuals.’  And why should married/coupled people get discriminatory marital status benefits where unused credits like Age Credits can be transferred to spouse?

Gross financial discrimination for singles occurs when governments choose to completely ignore court rulings.  Lost Dollar Value to singles:  unable to calculate.

  • PENSION SPLITTINGIt is immoral and ethically irresponsible for governments to deny that pension splitting benefits the wealthy most.  For families who can be exempt from paying 10 – !5 percent income tax on $100,000 and maintain the same income level during retirement as they had during their working years, even though they have less expenses during retirement, is financially discriminating to  singles who cannot pension split.  (This information was revised April 10, 2016 – Lost Dollar Value:  From estimate on income splitting, it has been suggested that income splitting would provide tax relief of $103 for income $30,000 or less and $1,832 for income of $90,000 and over or an average of $794 overall.  If $800 ($794 rounded off) is calculated times 35 years (age 65 to 90), then Lost Dollar Value will equal $28,000.)
  • HOUSING-Financial gurus seem to be leaning towards renting instead of home ownership.  This creates further hardship  for singles and the low income.  If young married/coupled persons are being told that they will probably need to rent because housing prices are out of reach, where does this leave singles and low income persons?  Trend now is towards tiny houses with composting toilets and tanks for storing water, but the rich don’t want to see tiny houses in their backyards.

Try telling singles and low income person that renting is the better alternative when they pay more per square foot and quality of housing is lower than that of houses for families.  If they have problems with not enough income for housing, they are told they should go live with someone.  These people ought to try ‘walking in the shoes’ of singles living in one room or communal situations, where because of low income, they don’t have their own bathroom, and it becomes a ‘dog eat dog’ world where others will, for example, steal food because there is not enough money to buy food. (cprn.org)

The housing market (rental and ownership) is financially completely upside down.  Instead of the rich and middle class paying more for the greatest amount of square footage, they are paying less for the greatest amount of square footage and niceties associated with that.  Singles and low income will be living in hovels, thus violating Maslow’s Hierarchy of Needs principle.

  • IF MONEY IS THERE YOU WILL SPEND IT, IF IT IS NOT, YOU WON’TFinancial studies have come to  conclusions that for people in the lowest income quintile on average have replacement rates of 100 percent, implying their real standard of living actually rises after retirement.  This is such a lie and is totally irrelevant to singles and low income persons.  If there is a poor quality of life before retirement, there still will be a poor quality of life on 100 percent replacement income for singles that does not meet the 1.4 income equivalent (updated November 17, 2017) to that of married/coupled persons living as a single unit.

CONCLUSIONS

Governments, decision makers, some financial advisers to the government. and think tanks are financially illiterate about the financial discrimination of singles.

It seems to be more important for governments to ensure that upper-middle class and upper class maintain their standard of living than it is to treat singles fairly.

Unprecedented growth in value of houses will result in huge tax-free wealth for families and married/coupled persons to the financial detriment of singles and low income.

Marital manna benefits like pension splitting has created a nanny state where married/coupled persons want it all and once these benefits are in place, it is very difficult to get rid of them.  Married/coupled persons have been made irresponsible by their own government.  They are not living a lower life style in their retirement.  A further question is whether these programs will be financially sustainable.

Assumption that retirement income only needs to replaced at 70 percent, for example, does not hold true for both singles and married/coupled persons, because singles require 1.4 income equivalent to married/coupled persons living as a single unit (updated November 17, 2017).  Twenty thousand dollars a year is not an adequate quality of life retirement income for Canadian senior singles.

GOVERNMENTS NEED TO ADDRESS FINANCIAL EQUALITY FIRST FOR ALL CANADIAN CITIZENS REGARDLESS OF MARITAL STATUS, THEN TWEAK CPP.

This blog is of a general nature about financial discrimination of individuals/singles.  It is not intended to provide personal or financial advice.

FINANCIAL GURUS FINANCIALLY ILLITERATE ABOUT SINGLES’ FINANCES

FINANCIAL GURUS FINANCIALLY ILLITERATE ABOUT SINGLES’ FINANCES

(These thoughts are purely the blunt, no nonsense personal opinions of the author and are not intended to be used as personal or financial advice.)

In the definition of family, for example Canada Revenue Agency, ‘ever’ singles and early in life divorced/separated persons are included in the definition of family, but in financial discussions by financial gurus they are often ‘kicked out’ of the family.

Financial gurus are often financially illiterate and discriminatory in the financial affairs of singles.  The most often egregious examples of this is the exclusion of  ‘ever’ singles and early in life divorced/separated persons from their blogs and studies.  The following three examples are used as a basis for this post.

Example #1

(false-assumptions-four-ways-seniors-singles-lose) The December 2, 2015 post “False Assumptions of Article ‘Four Ways Senior Singles Lose Out’” talks about false assumptions and false categorization of singles by Ted Rechtshaffen’s October 13, 2012 article “Four Ways Senior Singles Lose Out”.  In this article he states how widowed persons financially lose out in tens of thousands of dollars because they are no longer part of a couple.   He suggests that tax systems should be made fairer for only widowed and later in life divorced/separated persons.  ‘Ever’ singles and early in life divorced/separated persons were left out by exclusion because definition of single status was incorrectly used.  (Ted Rechtshaffen is president and wealth advisor at TriDelta Financial, a boutique wealth management and planning firm) (http://www.tridelta.ca/)

Example #2

(thebluntbeancounter)  The Blunt Bean Counter blog by Mark Goodfield article “The Burden of Singledom” May 6, 2014 is a response to a single person who stated his blog series on retirement was no help and was indeed obscene (this was stated in his blog) to her as a single person.  He is a Chartered Professional Accountant who readily admits that his blog is for everyone, but in particular high net worth individuals and owners of private corporations.  He states that the target audience was not singles or low income Canadians for the retirement series.  There is no problem with this statement; however, he asked Rona Birenbaum to do a guest post, a well-known and often quoted financial planner who also typically deals with high net worth clients.  Her article, ‘The Burden of Singledom’ again gave no meaningful advice beyond what is already known by singles.

Example #3

Dr. Jack Mintz is the President’s Fellow of the School of Public Policy at the University of Calgary.  Jack Mintz and Philip Bazel published an article in February 2014 called “Income Adequacy among Canadian Seniors:  Helping Singles Most” (policyschool.ucalgary)

In the article the following statements are made:

‘Policies should be directed at these most vulnerable single seniors, such as enhancements to the GIS top-up program targeted at those seniors with the lowest incomes, and increased survivor-benefit rates under the Canada Pension Plan.’

’When the income inadequacy of singles and married couples is evaluated using LICO (Low Income Cut-Off), we find a significantly higher incidence of elderly singles with income under $20,000 below the LICO threshold (52.6 percent) when compared with the LICO incidence of elderly households containing a married couple below $40,000 (15.7 per cent for households containing a couple with one elderly, and 6.3 per cent for households containing a couple with two elderly)’.

Such a statement shows financial illiteracy to the finances realities of senior singles as it costs them 70 per cent of what it costs a married/couple persons to live as a single unit.  A better alternative would be to forget the marital manna benefits directed to survivors or widowed persons and treat all senior singles whether they are ‘ever’ singles, divorced/separated or widowed persons as equals with top-ups equal to 70 percent of married/coupled person units.  The 52.6 per cent for singles versus 15.7 and 6.3 per cent for married persons mentioned in above quote shows an enormous spread between the two and is proof of this.  Financially, while in a coupled state, widowed persons appear to have a pretty good quality of life while singles below LICO appear to never have an equivalent quality of life.

(Many low income singles do not have close family members to live with and when they are forced to cohabitate in non-family situations, they often live in undesirable situations such as other household members stealing food, etc., “Social Housing Waitlists and the One Person Households in Ontario”)  (to-rent-or-own-affordable-housing-that-is-the-question)

Seniors living with family is an expense to the family unit.  However, senior singles living on their own have to incur not only 100% of the living costs, but also 70% of the costs of married/coupled persons as a single unit.

Financial gurus state that 70 per cent replacement of pre-retirement income is the standard norm for retirement.  Statistics Canada analysis has found that gross replacement rates vary by income but typically is about 70 percent.  People in the lowest 20 percent income quintile have replacement rates of 100 percent, implying their real standard of living actually rises after retirement. However, the real truth common sense evaluation of these findings show that married/coupled people financially benefit more than singles and divorced/separated persons.  A higher income level for the low income single person is still a low level income.  Financial gurus seem to think that when Canadians have an equal or greater income during retirement than while they are working, that is okay.  Try telling that to low income Canadian ‘ever’ singles and early in life divorced/separate persons who have not received the same benefits and are unable to save at the same rate as families or married/coupled persons during their working lives and, therefore, have lower retirement income.

(senior-singles-pay-more-part-4-of-4-response-to-reader-letters) An example of retired ‘ever’ singles and early in life divorced/separated singles receiving less is the December 22, 2015 blog “Senior Singles Pay More, Part 4 of 4”  showing that in a targeted tax relief program single seniors pay no tax on up $20,360 income, while married/coupled seniors pay no tax on up to $40,720 income.  (It costs more for singles to live person to person that it does for married/coupled persons.  This program barely covers the rent for a senior single, but allows married/couple senior to live a much better financial lifestyle).  A further example is the 10 per cent increase of the GIS (Guaranteed Income Supplement) for low income single seniors in the 2015 budget. One person has indicated that this has amounted to an increase of only $17 per month.

Conclusion

  1. Financial gurus like Chartered Professional Accountants, writers of blogs, members of think tanks and financial planners need to educate themselves and include all singles in their discussions, not just widowed persons and later in life divorced/separated singles.
  2. Financial gurus need to insure singles of all types are given fair and equal financial status in financial formulas and decision making.
  3. Financial gurus need to become educated on what it truly costs ‘ever’ singles and early in life divorced/separated persons to live.  It costs these persons 70 percent of what it costs married/coupled persons to live as a unit.  These extra living costs need to be included in financial formulas and financial decision making.

The blog posted here is of a general nature about financial discrimination of individuals/singles.  It is not intended to provide personal or financial advice.